You know that feeling when you are staring at your 5-minute BTC/USDT chart, convinced you have found the perfect trade setup, only to zoom out and realize the daily trend is completely against you? I have been burned by that more times than I care to count. That is exactly why I started using this multi-timeframe SuperTrend indicator.
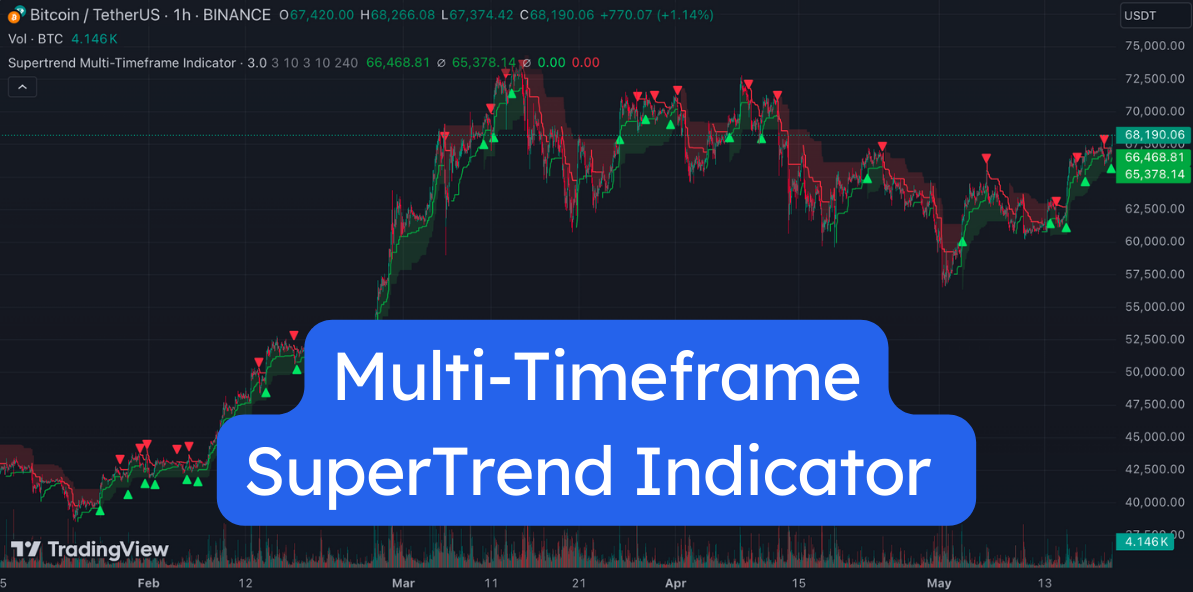
A multi-timeframe SuperTrend indicator is a Pine Script tool that plots two SuperTrend lines on one chart — one for your current timeframe and one for a higher timeframe you choose. It shows you short-term and long-term trend direction at the same time, so you are never trading blind to the bigger picture.
Think about it — how many times have you caught a "perfect" breakout on the 15-minute chart, only to watch it get crushed by resistance that was obvious on the 4-hour timeframe? This indicator fixes that by showing you both perspectives simultaneously. It is like having a co-pilot who is watching the higher timeframe while you focus on entries.