TradingView Scripts 教程:从基础语法到策略回测实战
· 18 min read
Pine Script 是 TradingView 平台的一套脚本语言,用来编写技术指标和自动化交易策略。它的语法很直观,浏览器打开就能写,写完直接挂到图表上看结果。
如果你在找一套方案把你的交易想法变成能用的工具,Pine Script 值得花时间学。我一开始也觉得学一门新语言挺麻烦的,但实际写了几个指标之后就发现,它的设计就是冲着金融图表来的,很多东西比你想象中简单。
Pine Script 是 TradingView 平台的一套脚本语言,用来编写技术指标和自动化交易策略。它的语法很直观,浏览器打开就能写,写完直接挂到图表上看结果。
如果你在找一套方案把你的交易想法变成能用的工具,Pine Script 值得花时间学。我一开始也觉得学一门新语言挺麻烦的,但实际写了几个指标之后就发现,它的设计就是冲着金融图表来的,很多东西比你想象中简单。
策略测试器是 TradingView 内置的回测工具,能在历史价格数据上运行你的交易逻辑,帮你判断一个策略值不值得真金白银往里投。我之前用 BTCUSD 的日线数据跑了一个双均线策略——从 2021 年 1 月测到 2023 年 12 月,年化收益大概 18%,但最大回撤冲到了 28%。光看收益率的话,很容易忽略背后的风险。
TradingView subscription offers are tiered pricing plans that provide additional charting tools, indicator limits, and historical data access. I've tested all three paid tiers — Essential at $14.95/month, Plus at $29.95/month, and Premium at $59.95/month — and what you actually need depends on how many charts you watch and how deep your analysis goes. Right now, the Black Friday 2025 sale is live with up to 80% off annual plans if you buy before November 28.
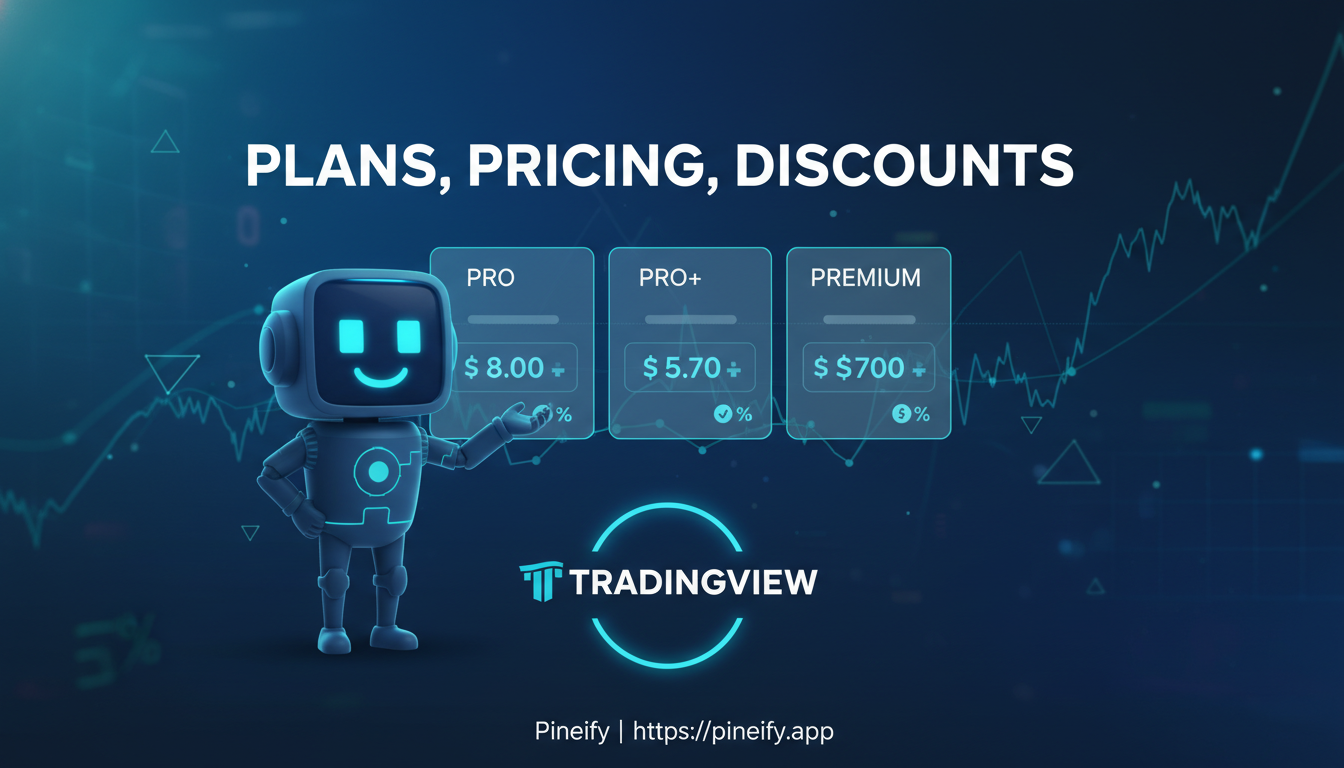
TradingView's big Thanksgiving sale is here, and it's the one I wait for every year. The TradingView Thanksgiving sale is the platform's biggest annual discount event, offering up to 80% off subscription plans with an extra free month on desktop purchases. I've been tracking these deals since 2023, and the 2025 discounts are the deepest I've seen.
The sale runs from November 21st through December 2nd, 2025. It's their largest promotion all year, and I think it's the best time to buy professional-level charting tools without paying full price. Whether you're new to charts or you need every advanced feature, here's how to pick the right plan for your budget.
A TradingView to MT4 connection is a bridge between TradingView's charting engine and MetaTrader 4's order execution system. It lets your TradingView alerts automatically place trades in your MT4 account — no manual entry required.
I've been running this setup since 2023 on my main EURUSD strategy, and it saved me from missing entries during NFP releases when prices move within seconds. Before automation, I'd spot a setup on TradingView, switch tabs to MT4, and by the time I entered the order the price had already moved 5-10 pips. That gets old fast.
I started trading without indicators. Just price, volume, and a lot of guesswork. Four years later, I have tested dozens of TradingView indicators on SPY, QQQ, and individual stocks like AAPL and TSLA, and I can tell you which ones actually earn their screen space and which ones just look pretty. Here is what I have learned.
TradingView and TC2000 serve two different types of traders. TradingView vs TC2000 is a comparison between a global multi-asset charting platform with a large social community and a US-focused stock and options specialist with the fastest scanner in the business. I've traded AAPL, SPY, and ES futures on both platforms for six months. My verdict: pick TradingView if you trade globally and need Pine Script backtesting. Pick TC2000 if US stocks and options are your focus and scanning speed matters most.
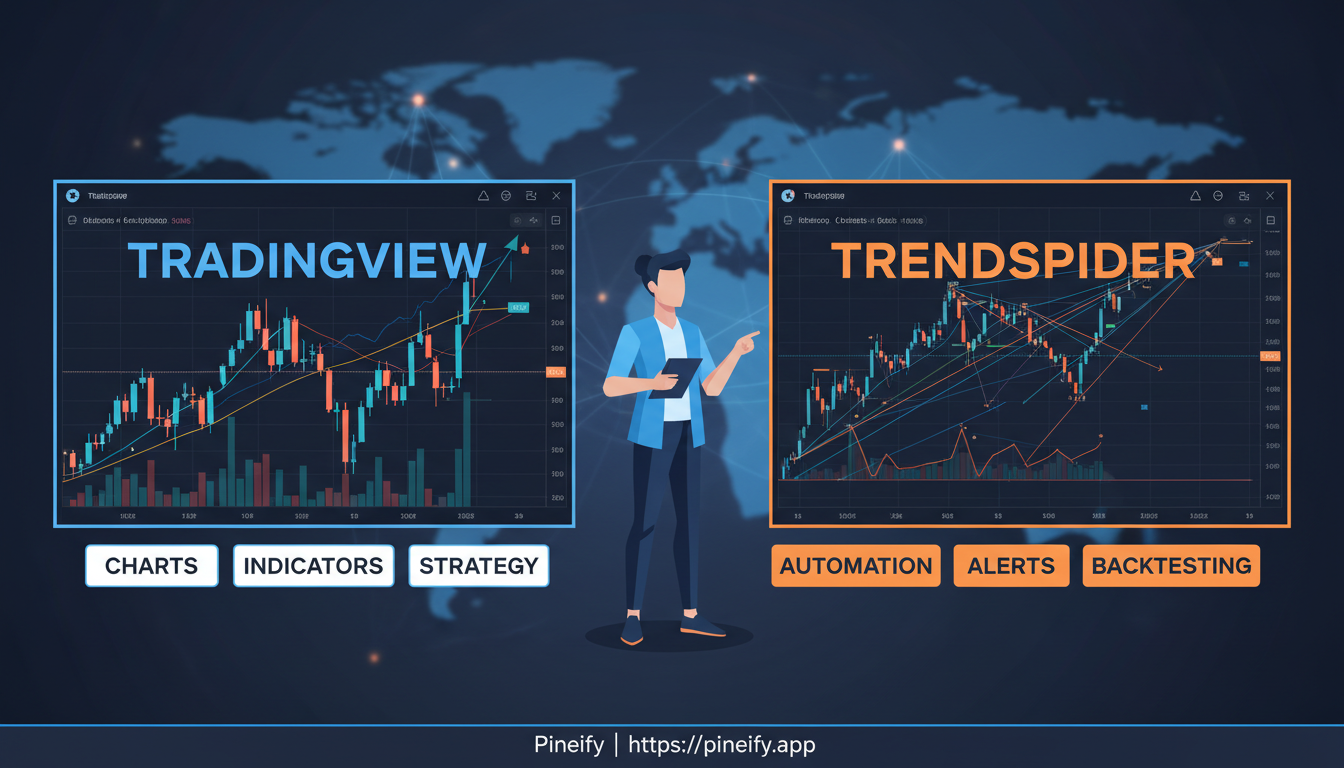
TradingView vs TrendSpider is a comparison between two leading technical analysis platforms: TradingView, a social charting powerhouse, and TrendSpider, an AI-driven automated analysis tool. I've spent time on both, and here's my verdict: pick TradingView if you want community-driven charting and broker integration; pick TrendSpider if automated pattern scanning across thousands of assets matters more. Neither is objectively better — they serve different workflows.
The real question is what kind of trader you are. TradingView feels like a busy global trading desk. You share charts, discuss ideas, and build custom indicators with Pine Script. Over 100 million users publish their analysis there daily. TrendSpider is more like a personal analyst that runs scans while you sleep. It draws trendlines automatically, spots candlestick patterns, and checks multiple timeframes at once without you clicking a thing.
我每天打开TradingView第一件事,就是看指标信号。但不是所有指标都值得贴在图表上——有些杂讯太多,有的滞后到信号出来行情已经走了大半。TradingView技术指标是建立在价格、成交量等原始数据之上的数学计算工具,帮交易者识别趋势方向、�动量强度和潜在反转点。挑对工具、用对参数,结果天差地别。
去年我盯BTC/USD四小时图时,日线RSI跌到28,同时周线MACD柱线开始收窄。两个信号交叉确认后我在19500附近建了仓,两周后涨到22500。那次以后我坚信——好的指标组合远胜单凭直觉。
The Trend Strength Index (TSI) is a double-smoothed momentum oscillator that moves between -100 and +100 with a centerline at zero. Instead of reacting to every price wiggle, it applies two layers of exponential moving averages to the underlying momentum data. This filters out short-term noise and makes the real trend direction easier to spot. I've been using it on daily charts for about a year now, and it consistently gives cleaner reads than standard oscillators on stocks like AAPL and MSFT.