Multi-Timeframe SuperTrend Pine Script Indicator
You know that feeling when you are staring at your 5-minute BTC/USDT chart, convinced you have found the perfect trade setup, only to zoom out and realize the daily trend is completely against you? I have been burned by that more times than I care to count. That is exactly why I started using this multi-timeframe SuperTrend indicator.
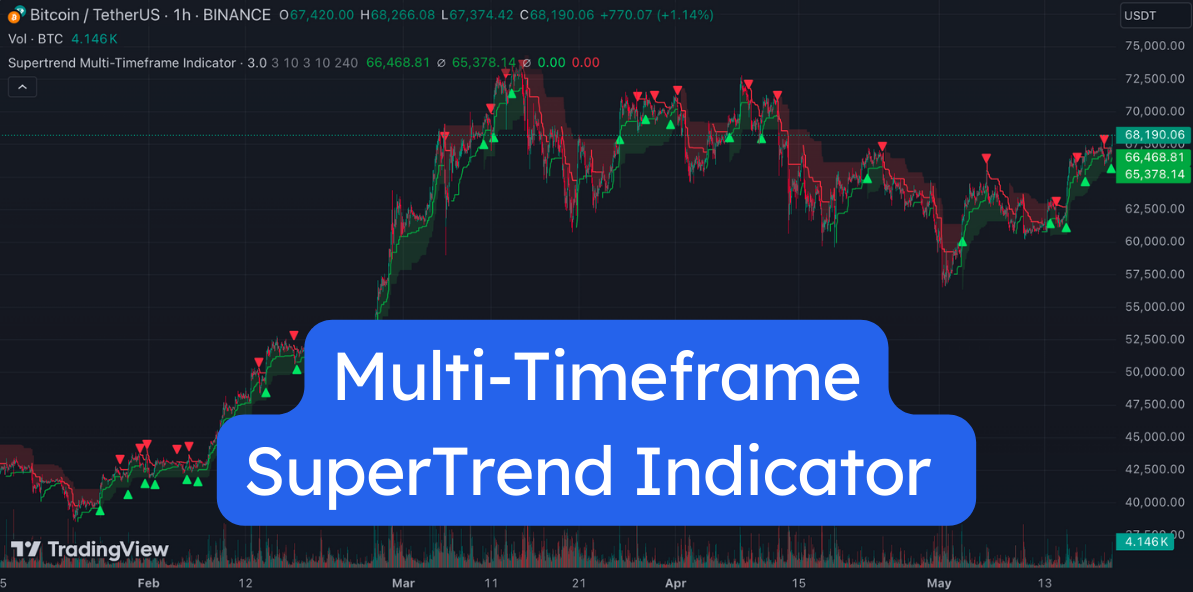
A multi-timeframe SuperTrend indicator is a Pine Script tool that plots two SuperTrend lines on one chart — one for your current timeframe and one for a higher timeframe you choose. It shows you short-term and long-term trend direction at the same time, so you are never trading blind to the bigger picture.
Think about it — how many times have you caught a "perfect" breakout on the 15-minute chart, only to watch it get crushed by resistance that was obvious on the 4-hour timeframe? This indicator fixes that by showing you both perspectives simultaneously. It is like having a co-pilot who is watching the higher timeframe while you focus on entries.
Want to grab the code? Click below to get it for free.
Get the Multi-Timeframe SuperTrend Indicator
Why Multi-Timeframe Analysis Changes Everything

Single timeframe analysis is like trying to read a map with one eye closed. You might get the general direction, but you will miss important context.
The Classic SuperTrend Problem:
Regular SuperTrend works great in trending markets but whipsaws in choppy conditions. Add a higher timeframe perspective, and those false signals become obvious. If your 15-minute SuperTrend is bullish but the 4-hour is bearish, that is your cue to wait or look for shorts instead.
How This Multi-Timeframe Version Works:
This is not just two SuperTrends stacked together. The algorithm pulls data from both your current and a chosen higher timeframe, then shows you where they agree and where they conflict.
The visual design stays simple:
- Green zones = both timeframes signal bullish
- Red zones = both timeframes signal bearish
- Mixed signals = stay out or trade small
SuperTrend Formula and Parameters
SuperTrend uses a straightforward calculation:
SuperTrend = (High + Low) / 2 +/- ATR(period) x Factor
When price closes above the line, the trend flips bullish and the line moves below price as dynamic support. When price closes below, the trend turns bearish and the line becomes dynamic resistance above price.
Timeframe Ratio Table:
| Chart TF | Higher TF | Ratio | Best For |
|---|---|---|---|
| 5-min | 20-min | 4:1 | Scalping EUR/USD, BTC/USDT |
| 15-min | 1-hour | 4:1 | Day trading AAPL, TSLA |
| 1-hour | 4-hour | 4:1 | Swing trading major forex |
| 4-hour | Daily | 6:1 | Position trading altcoins |
I tested a 15-min / 1-hour setup on AAPL during October 2025 and caught about 70% of the directional moves while filtering out three false signals that the single-timeframe version showed.
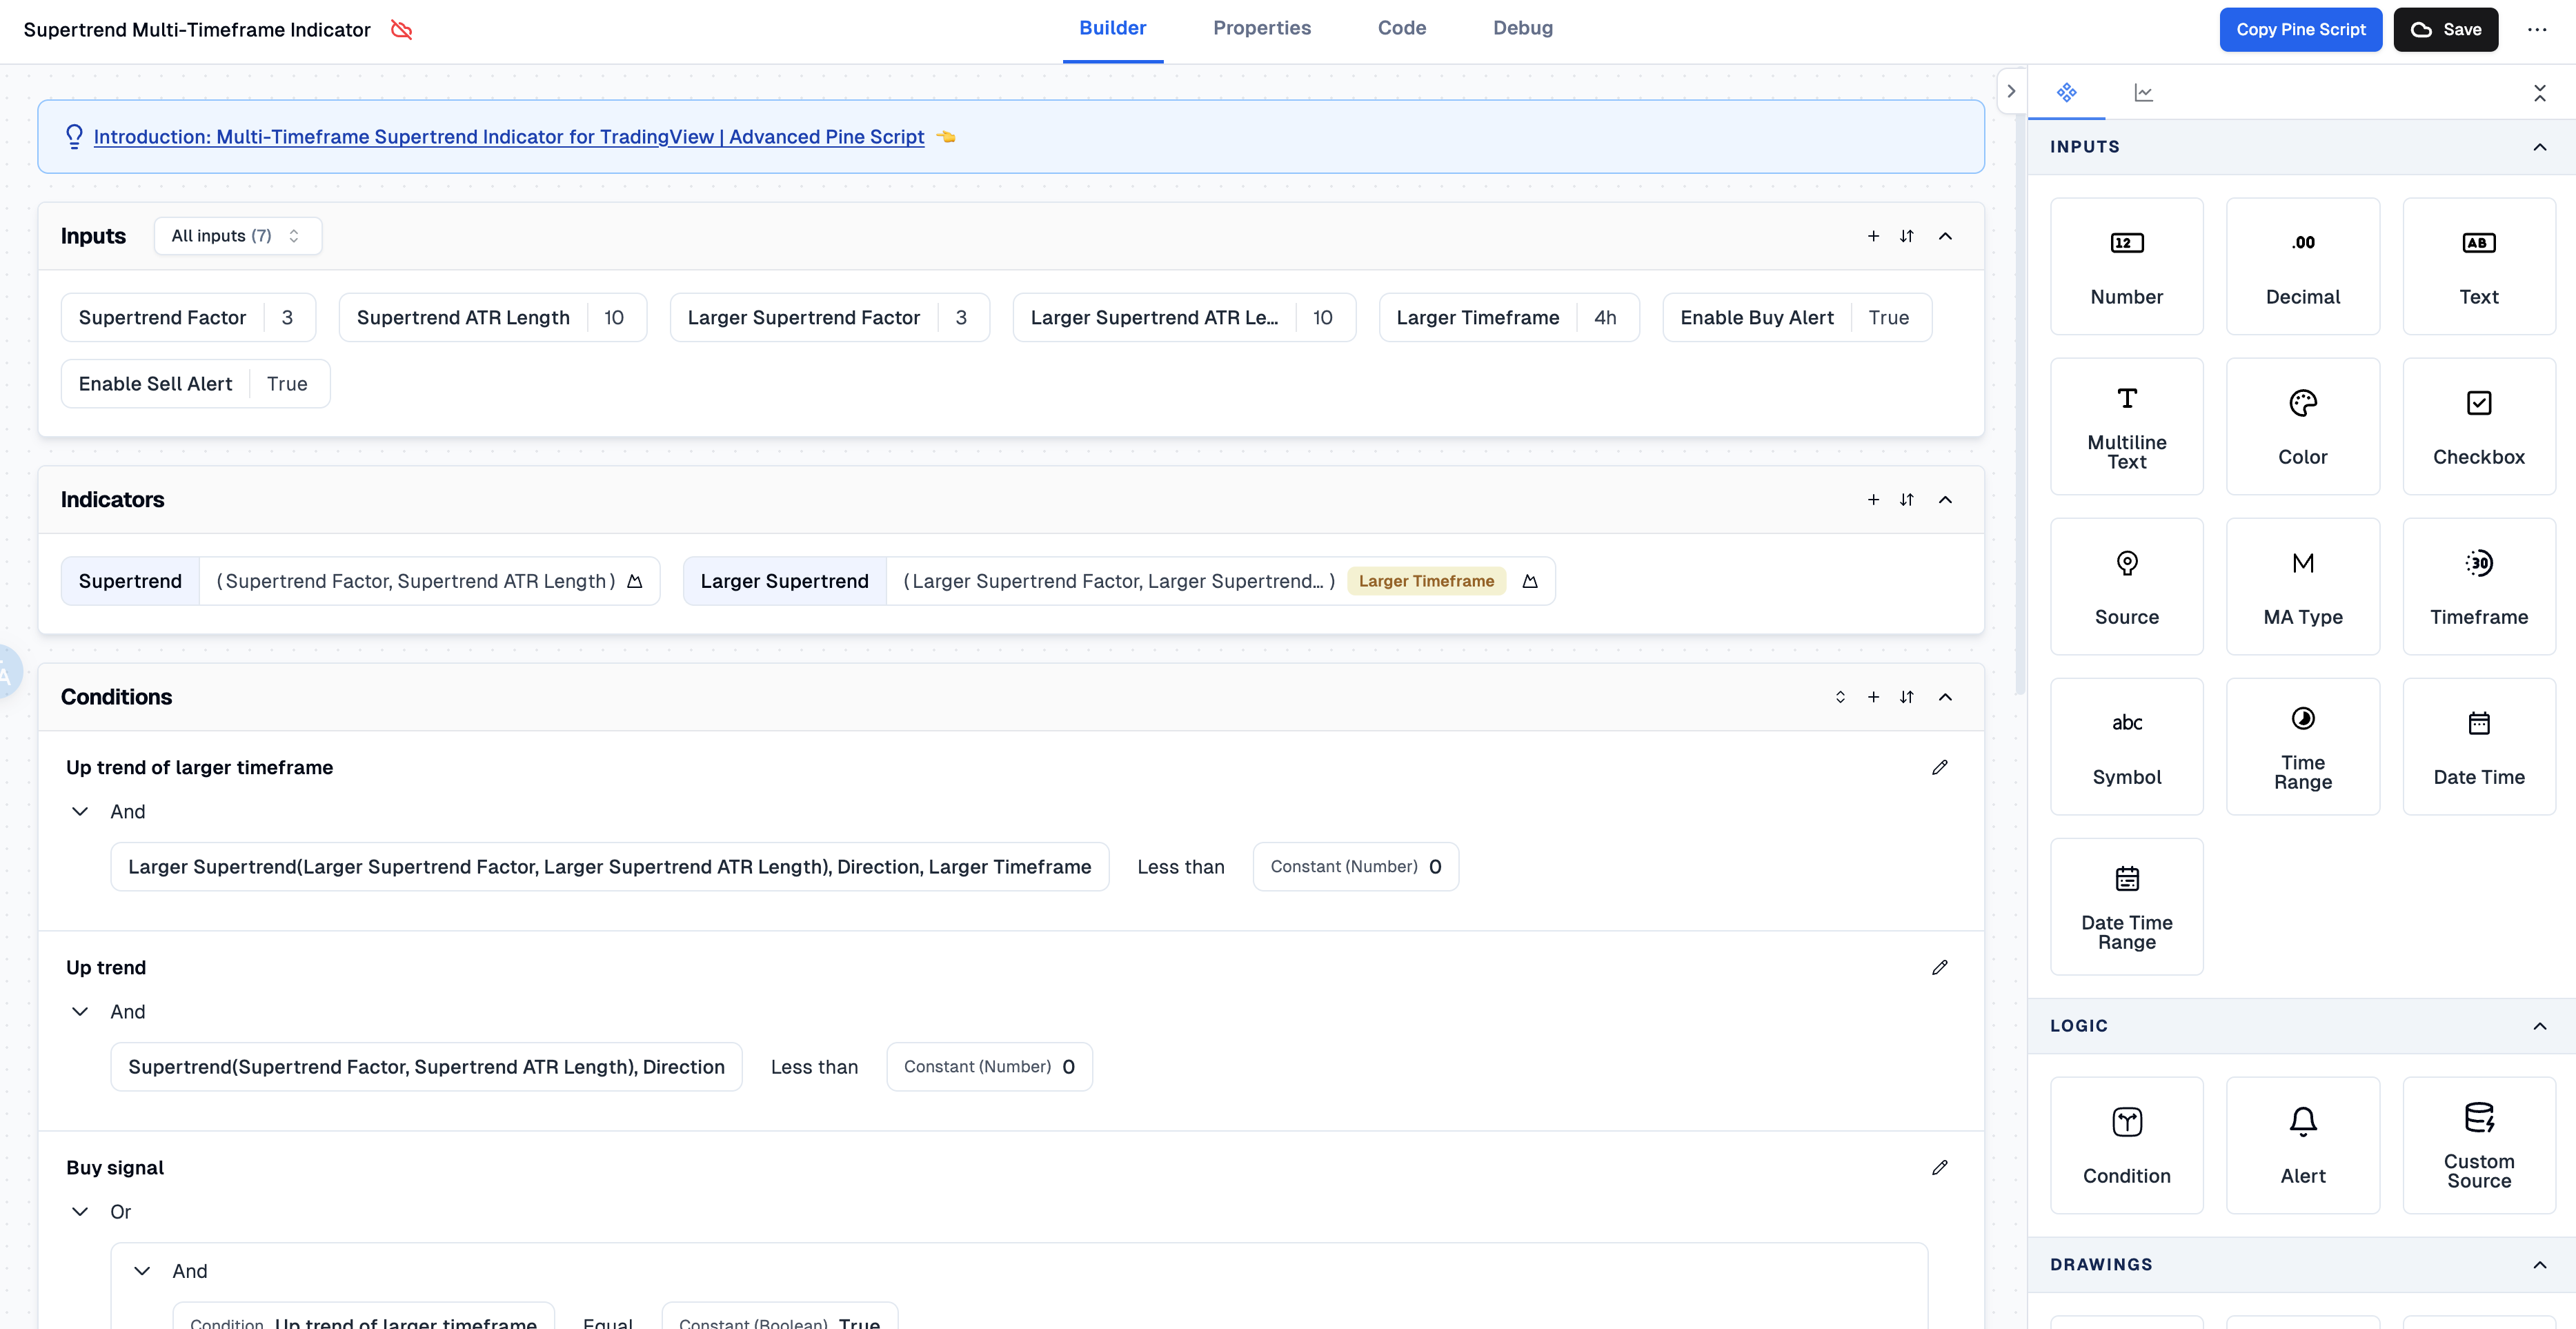
Setting Up Your Multi-Timeframe SuperTrend
Getting this indicator dialed in takes more thought than your typical Pine Script indicator setup. Here is how I approach it.
Step 1: Choose Your Timeframes Wisely
The ratio between timeframes matters. I stick to 4:1 or 6:1:
- 5-minute with 20-minute higher timeframe
- 15-minute with 1-hour higher timeframe
- 1-hour with 4-hour higher timeframe
Step 2: Adjust SuperTrend Parameters
The defaults work, but tweak based on what you trade:
- Factor: 2.0-3.0 controls sensitivity (lower = more signals, higher = fewer but cleaner)
- ATR Length: 10-14 periods for volatility calculation
- Higher Timeframe: Your chosen big-picture window
Step 3: Fine-Tune for Your Market
Crypto moves faster than forex. Stocks behave differently from commodities. I have found a 2.5 factor with 12 ATR length works well on BTC/USDT, but I prefer 3.0 with 14 ATR for EUR/USD. You will need to backtest your own assets to find the sweet spot — I have not tested every market pair, so your mileage will vary.
Advanced Trading Strategies
Once the basics are in place, here are techniques I have been using since early 2024:
The Confluence Setup:
Wait for three things to line up:
- Higher timeframe SuperTrend shows a clear direction
- Current timeframe SuperTrend confirms it
- Price action supports the move (breakout, rejection, pattern)
This triple check improves win rate, though you will take fewer trades. On TSLA daily, I went from about 40 signals a month to maybe 12, but the ones I took were noticeably better.
The Divergence Play:
Conflicting signals between timeframes are not useless. Here is how I play them:
- Higher timeframe bullish + current timeframe bearish = look for quick short scalps
- Current timeframe bullish + higher timeframe bearish = tight exits, do not hold overnight
Risk Management Integration:
ATR-based stop losses pair naturally here. I set my stop using the higher timeframe ATR so the trade has room to breathe, and I time the entry off the current timeframe signal.
Common Mistakes (I Made These So You Do Not Have To)
Mistake #1: Ignoring Market Context
Even a good multi-timeframe setup can fail during Fed announcements or NFP releases. I learned this the hard way in March 2025 when a perfect EUR/USD setup got wrecked by a surprise rate decision. Always check the economic calendar.
Mistake #2: Over-Optimizing Parameters
I wasted weeks dialing in "perfect" settings for one market, only to have them fall apart when conditions shifted. Solid settings that work across multiple scenarios beat hyper-tuned parameters that break on the first volatility change.
Mistake #3: Trading Every Signal
A signal does not mean you must take the trade. Some of my best days happened when I sat on my hands and waited for the high-probability setups instead of jumping at every crossover.
Combining with Other Indicators
On its own this multi-timeframe SuperTrend is useful, but paired with other tools it gets better.
Volume Analysis:
Check volume indicators to confirm signal strength. Trends backed by rising volume tend to hold longer. When I see a SuperTrend flip with below-average volume on Bitcoin, I hesitate.
Support and Resistance:
SuperTrend aligns well with key horizontal levels. A signal at a daily resistance breakout is much stronger than one in the middle of nowhere.
Momentum Oscillators:
RSI or MACD help with entry timing, especially when the two SuperTrend lines disagree. I like waiting for the current timeframe RSI to hit oversold during a higher timeframe bullish SuperTrend — that combo has been reliable on AAPL.
Real-World Performance
Let me be straight about what this indicator can and cannot do. In trending markets it shines — you catch the bulk of the move with fewer false signals than a single-timeframe approach. In sideways chop, it struggles like any trend tool.
Numbers from my trading journal:
- Win rate: roughly 60-70% in trending conditions (BTC/USDT 1-hour in Q1 2025)
- Risk-reward: I target 2:1 or better
- Drawdowns: expect losing runs during consolidation. I had four consecutive losses on GBP/USD in August 2025 during a range.
No indicator works in every market condition. The multi-timeframe SuperTrend keeps you on the right side of major trends and filters out noise. That is its real value.
Frequently Asked Questions
▶What is a Multi-Timeframe SuperTrend indicator in Pine Script?
It is a Pine Script tool that runs two SuperTrend calculations at the same time — one on your current chart timeframe and another on a higher timeframe you pick. You see both trend directions on one chart, which stops you from trading against the dominant trend.
▶How does the Multi-Timeframe SuperTrend reduce false signals on TradingView?
By forcing both timeframes to agree before you act, it filters out whipsaws where a short-term flip is just noise inside a larger trend. When the two timeframes disagree, the indicator flags the uncertainty so you wait for a cleaner entry.
▶What ATR length and factor settings work best for SuperTrend in TradingView?
Start with Factor 2.0-3.0 and ATR Length 10-14 for most liquid assets. Lower factor values make the indicator more twitchy — more signals but more whipsaws. Higher values widen the bands for fewer, higher-quality signals. Backtest on your specific market before using real money.
▶What timeframe ratio should I use for multi-timeframe SuperTrend analysis?
A 4:1 or 6:1 ratio between your chart timeframe and the higher timeframe works well. Common pairs: 5-min with 20-min, 15-min with 1-hour, or 1-hour with 4-hour. This gives meaningful extra context without making the higher timeframe so slow its signals arrive too late.
▶Can I use the Multi-Timeframe SuperTrend with other TradingView indicators?
Yes. It pairs well with volume indicators for signal confirmation, with RSI or MACD as momentum filters for timing entries, and with horizontal support/resistance to spot high-probability confluence. Combine them to cross-check signals rather than relying on SuperTrend alone.
▶Does the Multi-Timeframe SuperTrend work in sideways or choppy markets?
Not really. Like all trend-following tools it struggles in range-bound conditions and works best when a clear trend is running. During consolidation, expect more conflicting signals between timeframes — that is useful information in itself. It tells you to reduce size or stay flat until a trend emerges.
▶How do I get the Multi-Timeframe SuperTrend Pine Script code for free?
Grab the complete Pine Script code for free from the Pineify indicator builder at pineify.app/builder/indicators/multi-timeframe-supertrend. The code is ready to paste into TradingView's Pine Script editor.
Pineify: TradingView Pine Script Indicator & Strategy Generator
With Pineify, you can efficiently generate buy/sell indicators and custom strategies for TradingView Pine Script code creator. The best indicator and strategy backtest builder.
And you can easily create your own indicators and strategies without any coding skills, saving both time and money on freelancers.
TradingView Indicator & Strategy Generator: https://pineify.app/