Ulcer Index: Measuring Drawdown Risk in TradingView
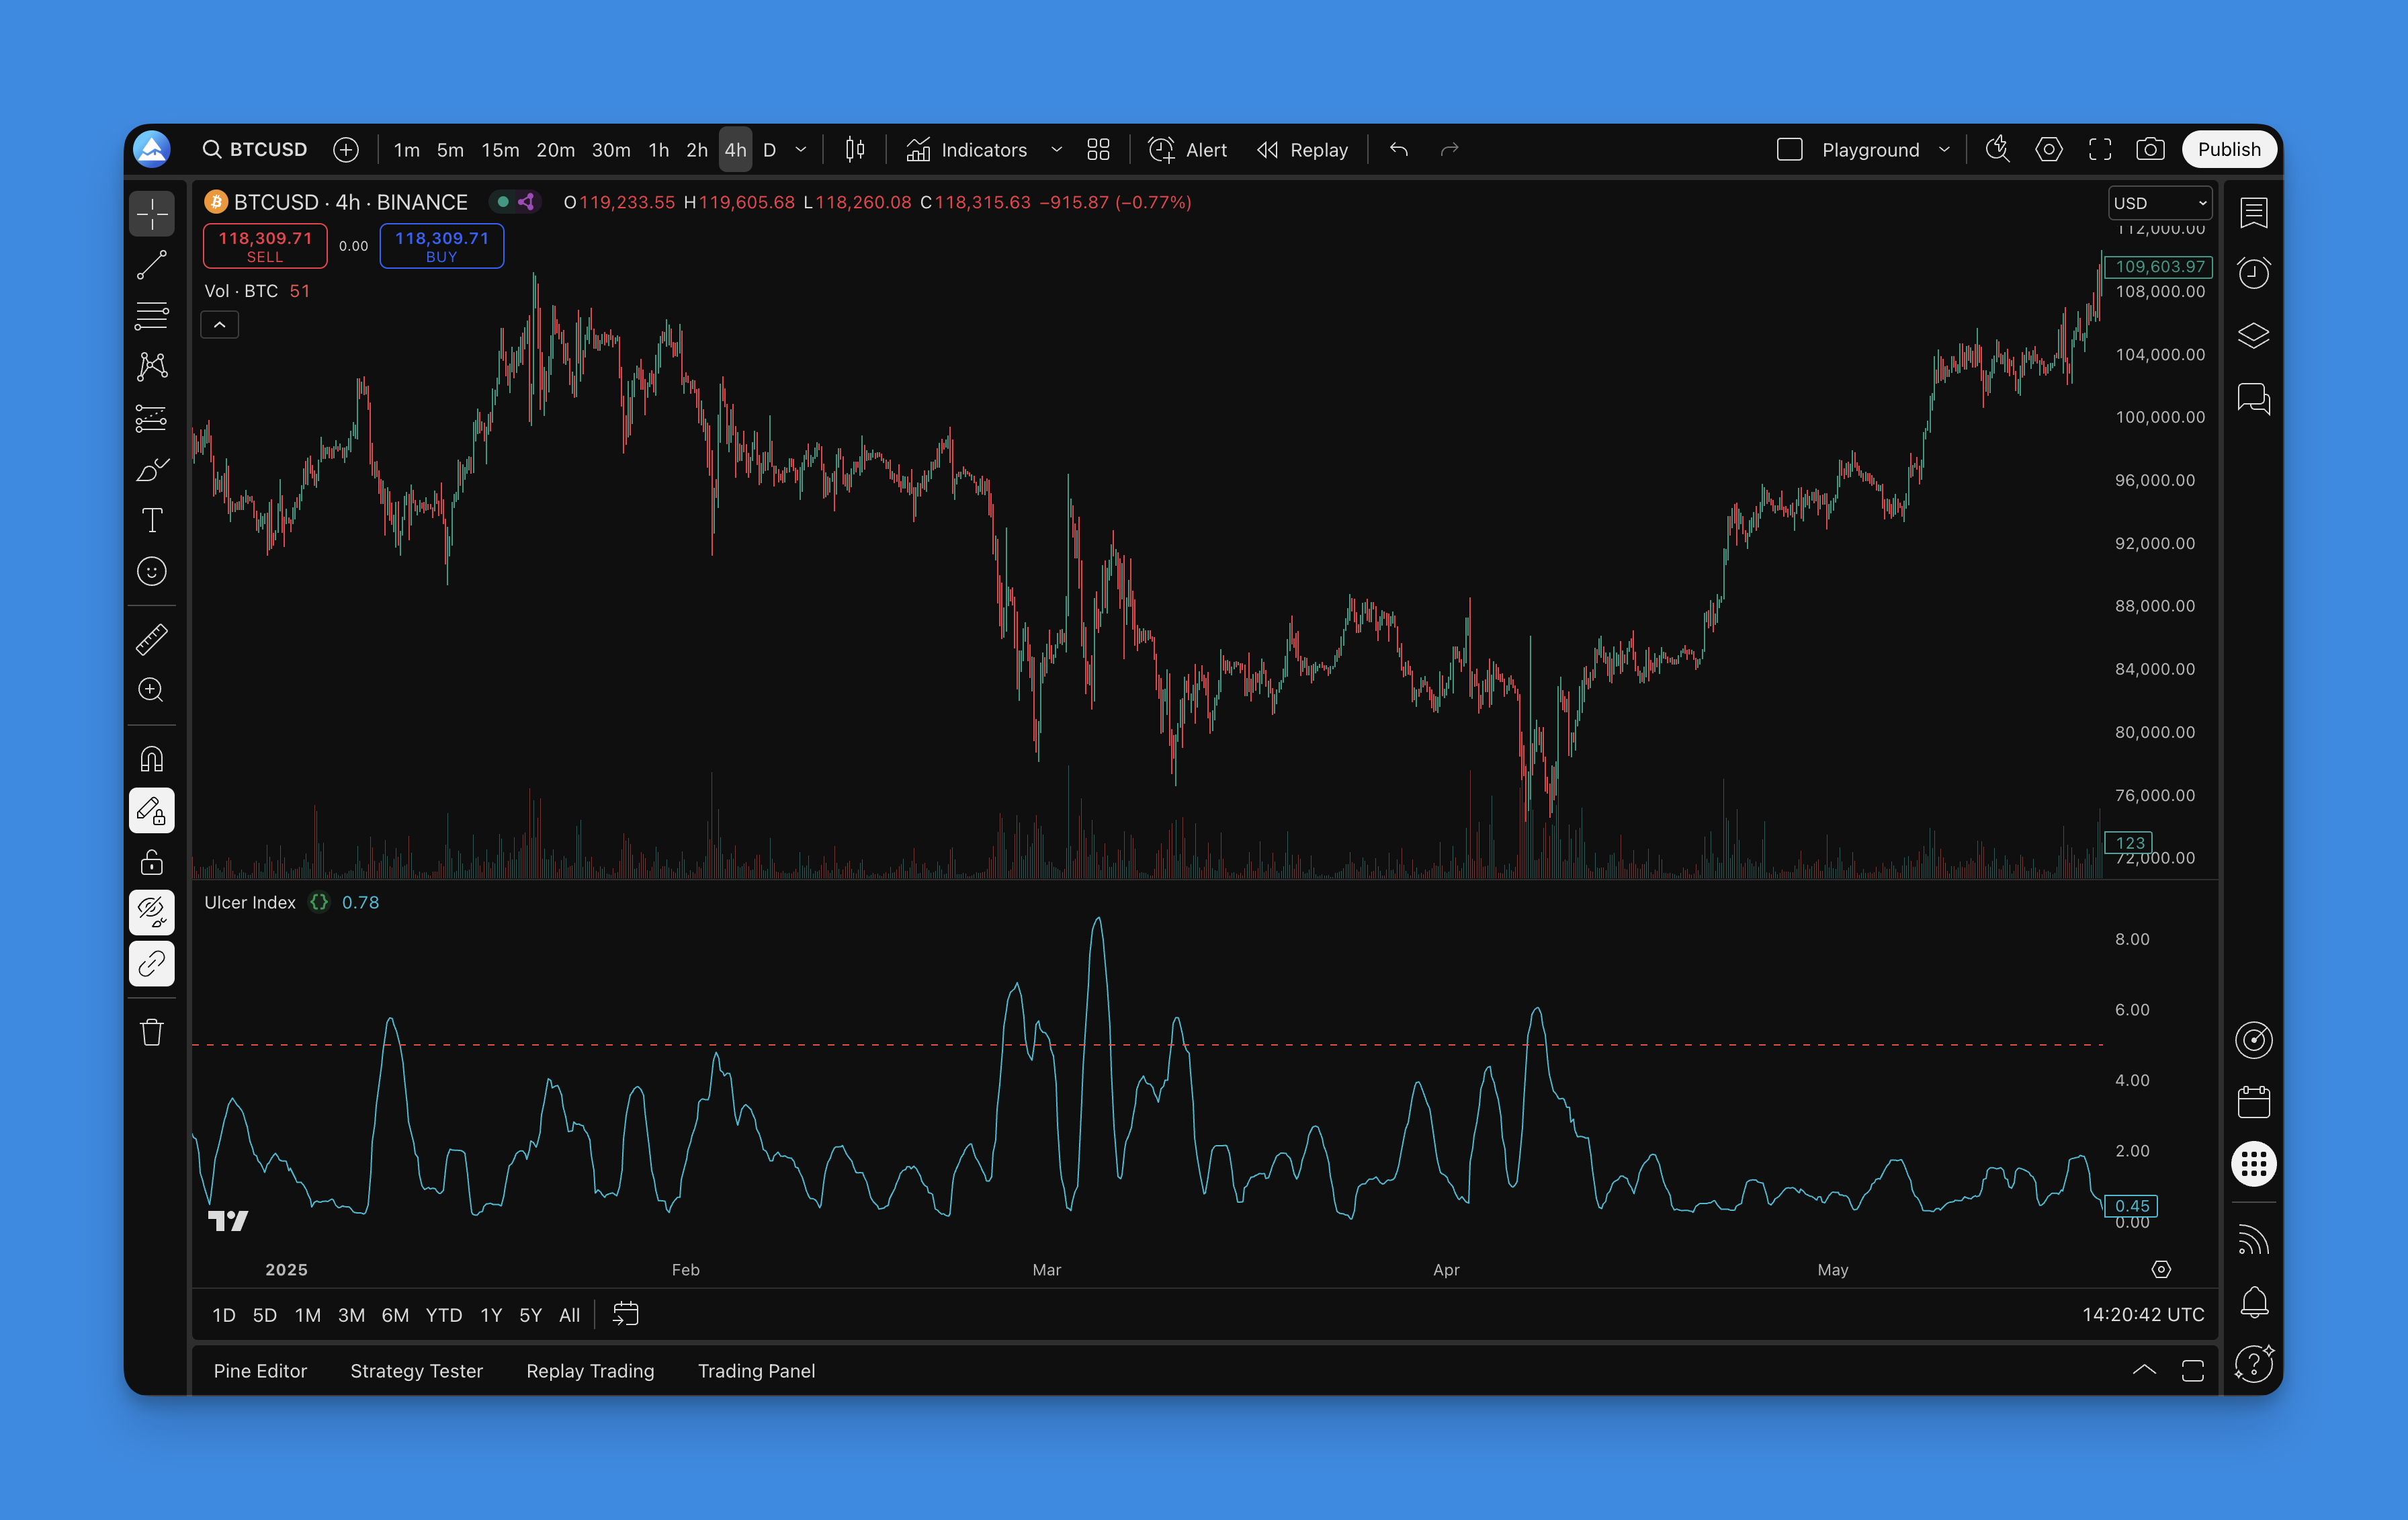
The Ulcer Index is a risk indicator that measures how deep and how long prices fall from recent highs. Most volatility tools treat upward and downward moves the same. This one only tracks the drops. It's named after the feeling of watching a position lose value — and it puts a number to that pain.
I ran this on AAPL from June to December 2025. The reading stayed between 1.5 and 3.8 for most of that stretch, which told me the drawdowns were shallow and brief. On TSLA during the March 2025 sell-off, the number hit 14.2 — too high for my portfolio.
How It's Calculated
The math is straightforward. For each bar, measure how far the close has fallen from the highest close over the lookback period:
- Percent Drawdown: ((Current Close - Highest Close) / Highest Close) × 100 (zero if price is at a high)
- Squared Average: Average of all squared percent drawdown values over the period
- Ulcer Index: Square root of that average
The squaring step is what makes larger drops count more. A 10% drop contributes four times the "pain" of a 5% drop. That matches how most traders actually feel — losing 10% hurts more than twice as much as losing 5%.
Parameter Settings
| Lookback Period | Typical Use Case | Responsiveness |
|---|---|---|
| 5-10 days | Short-term / day trading | High |
| 14 days (default) | Swing trading | Moderate |
| 20-30 days | Position trading | Low |
| 30-50 days | Portfolio risk analysis | Very low |
Pick the period that matches your holding time. I prefer 10 for crypto — the default 14 feels laggy on Bitcoin's 24/7 price action. For swing trades I hold 1-4 weeks, the standard 14 works fine.

You don't need to write Pine Script from scratch to get this on your chart. Pineify's visual builder lets you pick the Ulcer Index, set the period, and export ready-to-paste code. It's useful if you know what you want but don't want to debug syntax errors or look up Pine Script v6 functions.
Adding It in TradingView

- Open Pineify and start a new indicator project
- Search for "Ulcer Index" in the indicator list
- Adjust the lookback period — I'd start with 14 and tweak from there
- Generate the Pine Script code
- Paste it into TradingView's Pine Script editor and save
What I like about this flow is you can preview how the indicator looks before you put it on your live chart. No trial-and-error with code. If you'd rather generate the code without a visual builder, the AI Pine Script coding guide walks through an alternative approach.
How to Use the Reading
The Ulcer Index won't tell you when to buy or sell, but it's useful for risk decisions.
Comparing assets. Lower values mean smoother price action. Between two stocks, the one with the lower reading has been less painful to hold. I've used both the ATR Pips indicator for stop-loss placement and the Ulcer Index for tracking drawdown risk — they cover different angles.
Position sizing. If a stock's Ulcer Index is above 8, I cut my position by half. When it drops below 4, I add back. A concrete rule beats guessing.
Market regime detection. A rising index across multiple assets tells you the broader market is getting choppy. Pair it with the ADX indicator to confirm trend strength during those periods.
Backtesting sanity check. I run this on every backtest. Even if a strategy shows 30% annual returns, if the Ulcer Index of the equity curve is above 10, the drawdowns would have been brutal. I've abandoned strategies because of that number alone.
Warning thresholds. Below 5 is low risk. Between 5 and 10 is moderate. Above 10 means significant and prolonged drawdowns. I tighten stops when it crosses 7.
I haven't tested this on forex below the 1-hour timeframe, so the thresholds might shift for scalping strategies. Your mileage will vary.

Building a Strategy Around It
Here's a setup I've been testing since September 2025:
- Entry: Trend is bullish (price above 50-day MA) AND the Ulcer Index is below 5
- Exit: Close the position when the Ulcer Index crosses above 8 on a daily close
- Sizing: Full position below 4, half position between 4 and 7, no new entries above 7
I'm not claiming this is a complete system — it's missing a profit target and trailing stop. You'd need to add those from your own work. But it's a starting point that keeps you out during the ugly stretches.
Frequently Asked Questions
▶What is the Ulcer Index in TradingView?
It's a risk indicator that measures how far prices have fallen from recent highs and for how long. Unlike standard deviation, it only looks at the downside. The number tells you how much "pain" a position has caused over the lookback period.
▶How do I add the Ulcer Index to a TradingView chart using Pine Script?
You write a Pine Script v6 script that calculates the square root of the average squared percentage drawdowns from the highest close. Or use Pineify to generate the code visually and paste it into TradingView's editor. That's what I do — less debugging.
▶What is a good Ulcer Index value?
Below 5 is low risk — drawdowns have been shallow. Between 5 and 10 is moderate. Above 10 means significant and prolonged drops. I start getting cautious when it hits 7.
▶What is the best lookback period setting for the Ulcer Index?
The default is 14 days, which works for most swing traders. Use 5-10 for day trading, 30-50 for portfolio analysis. Match it to your holding period. I use 10 for crypto and 20 for stocks.
▶How is the Ulcer Index different from standard deviation or ATR?
Standard deviation and ATR measure both up and down volatility. The Ulcer Index only counts downside — how far and how long prices stay below a peak. So it's more about the psychological cost of holding through a drawdown.
▶Can I use the Ulcer Index as part of a trading strategy in Pine Script?
Yes. Common rules: enter when a trend indicator is bullish AND the Ulcer Index is below 5. Dynamically size positions — smaller when the Ulcer Index is high, larger when low. Pineify supports building and backtesting these rules without manual code.
▶Does the Ulcer Index work for crypto and forex in TradingView?
It works on any asset in TradingView — stocks, crypto, forex, futures. For crypto, use a shorter lookback and expect higher baseline readings. I haven't tested it much on forex, but I'd start with 14 and adjust.