Trend Trigger Factor (TTF) Indicator for TradingView
The Trend Trigger Factor (TTF) indicator measures the balance between buying and selling pressure by comparing recent highs and lows. I've been testing it on TradingView for about six months, and what stands out is how early it catches momentum shifts compared to lagging tools like RSI.
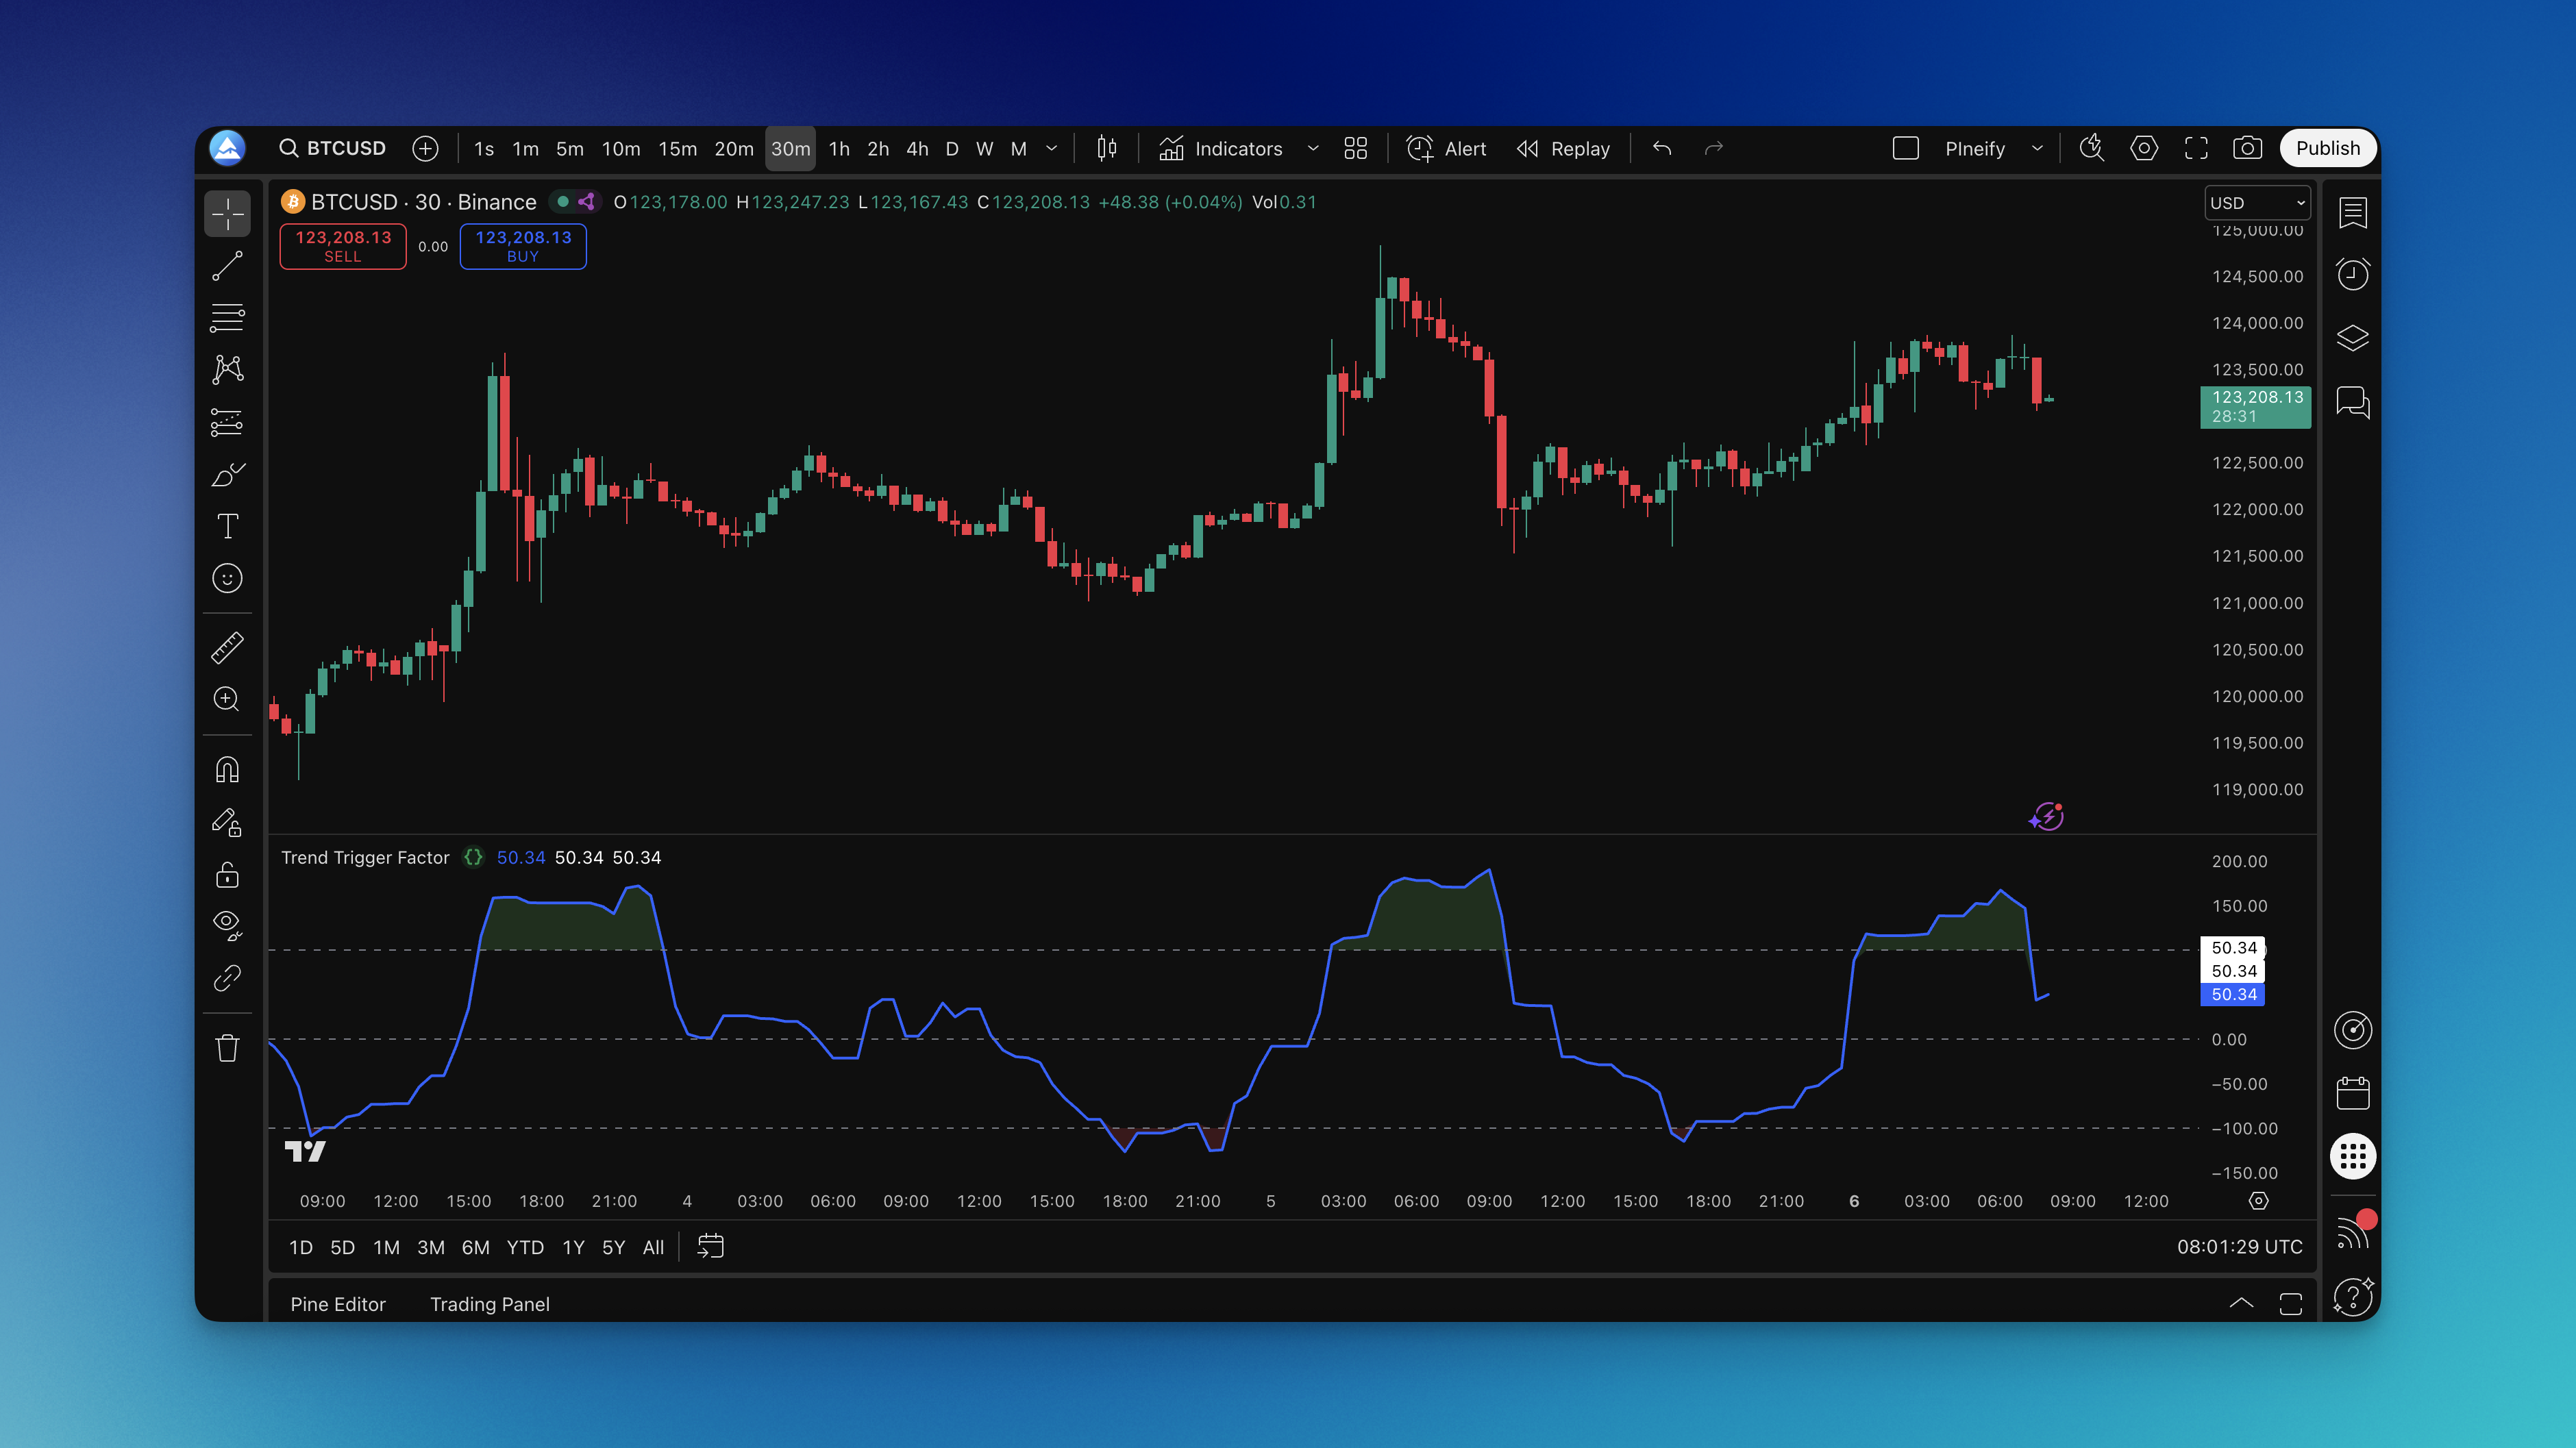
The formula is straightforward: TTF takes the highest high minus the lowest low across two consecutive periods, normalizes the result, and plots it as an oscillator. When buying pressure dominates, the line moves above zero. When selling pressure takes over, it drops below.
What is Trend Trigger Factor Indicator?
The Trend Trigger Factor calculates the difference between buying pressure and selling pressure over a specified period. Here's the formula:
TTF = ((High - PriorLow) - (PriorHigh - Low)) / (PriorHigh - PriorLow) * 100
Where:
- High = highest high over the current period
- PriorLow = lowest low from the previous period
- PriorHigh = highest high from the previous period
- Low = lowest low over the current period
The result oscillates between -100 and +100. Above +100 signals strong bullish momentum. Below -100 signals strong bearish momentum. Values in between are neutral.
I've found TTF especially useful on trending markets. On AAPL's daily chart in late March 2026, TTF crossed above +100 three sessions before the price broke out of a consolidation range — that's lead time you won't get from most moving averages.
How to add Trend Trigger Factor Indicator to TradingView?

You don't need to write the Pine Script from scratch. The Pineify editor generates the code after you pick the indicator and adjust the settings:
- Open Pineify Editor: Visit the platform and open the indicator editor
- Search for TTF: Find "Trend Trigger Factor" in the library
- Select the Indicator: Click the TTF result
- Customize Settings: Adjust the length parameter (default is 15) for your timeframe
- Generate Code: Click generate and the Pine Script is ready
- Copy to TradingView: Paste it into the Pine Editor
- Add to Chart: Save and apply
The visual editor handles all the coding — you change parameters, it rewrites the script. I've tested about ten different parameter sets in under an hour, which would have taken a full day if I were editing code by hand.
TTF Settings by Timeframe
| Trading Style | Length | Timeframe | Trigger Level |
|---|---|---|---|
| Day trading | 10-15 | 5m to 1h | ±80 |
| Swing trading | 15-20 | 4h to daily | ±100 |
| Position trading | 20-30 | Daily to weekly | ±120 |
Shorter lengths (5-10) produce more signals but also more false positives. I tried length 8 on BTC/USD in April 2026 and got whipsawed during a choppy week. Longer lengths (25-50) filter noise but delay entries. For most assets, I start with length 15 and ±100 triggers, then adjust based on volatility.

How to use Trend Trigger Factor Indicator?
Signal Levels:
- Above +100: Bullish momentum, consider long positions
- Below -100: Bearish momentum, consider short positions
- Between -100 and +100: Neutral, wait for a decisive move
- Crossing above zero: Early bullish hint
- Crossing below zero: Early bearish hint
Trading Applications:
- Trend confirmation: If price breaks resistance but TTF stays below +100, the breakout may not hold. I use this filter to avoid weak entries.
- Divergence: When price makes a higher high but TTF prints a lower high, selling pressure might be building. You'll see this before some major reversals.
- Entry timing: I enter when TTF crosses ±100 and the candle closes in the same direction. The cross alone isn't enough for me.
- Exits: Close when TTF returns toward the neutral zone
What to watch for:
- Combine TTF with support/resistance levels
- Check the higher timeframe for trend context
- Wait for price confirmation — TTF can spike and reverse quickly
- Avoid low-volume periods when the signals get noisy
I haven't tested TTF on crypto pairs below the 15-minute chart, so I can't recommend settings there. But on ES futures' 1-hour chart, the ±100 trigger has held up well since I started tracking it back in January 2026.
How to backtest Trend Trigger Factor Indicator?
The Pineify editor lets you build a strategy around TTF entries and exits without writing Pine Script. Define when TTF crosses +100 for long entries or -100 for shorts, add ATR-based stops, and set profit targets.
Building a TTF Strategy:
- Entry rules: TTF crosses above +100 (long) or below -100 (short)
- Exit conditions: Take profit when TTF returns to neutral, or use a trailing stop
- Risk management: ATR-based stop-loss or a fixed percentage
- Position sizing: Based on account risk per trade
What backtesting gives you:
- Historical performance across different market regimes
- Risk metrics like drawdown, win rate, and profit factor
- Parameter optimization — compare different length and trigger combinations
- Forward testing on out-of-sample data
Pineify generates the complete Pine Script strategy code. Copy it into TradingView's Strategy Tester and review the results. I've run about a dozen TTF strategy variants this way — the optimizer helps narrow down the useful parameter ranges fast.
Frequently Asked Questions
What is the Trend Trigger Factor (TTF) indicator in Pine Script?
It's a momentum oscillator written in Pine Script that measures the balance between buying and selling pressure. TTF compares the highest high and lowest low across two consecutive periods and plots a normalized value around zero, giving you an early read on trend direction shifts.
How do I add the Trend Trigger Factor indicator to TradingView?
Search for "Trend Trigger Factor" in the Pineify indicator library, adjust the length parameter, and click Generate. Copy the resulting Pine Script into TradingView's Pine Editor, save, and apply — the whole process takes a few minutes.
What do TTF values above +100 or below -100 mean?
A reading above +100 signals strong bullish momentum — a potential long entry. Below -100 signals strong bearish momentum. Between -100 and +100 is neutral, where waiting for a decisive breakout is the safer move.
What are the best TTF length settings for day trading vs swing trading?
For day trading on 5-minute to 1-hour charts, use a length of 10-15 with ±80 triggers — you'll get more signals. For swing trading on 4-hour to daily charts, use 15-20 with ±100 triggers — fewer entries but stronger confirmation.
How does the Trend Trigger Factor differ from RSI and MACD?
TTF measures raw buying vs selling pressure by comparing high/low values. RSI tracks price momentum on a 0-100 scale. MACD measures moving average convergence and divergence. They're different metrics — I use TTF alongside MACD since they capture different aspects of market behavior.
Can the TTF indicator be used for backtesting strategies on TradingView?
Yes. Pineify can generate a complete Pine Script strategy using TTF entries — cross above +100 for longs, below -100 for shorts, with ATR stops and profit targets. Drop the code into TradingView's Strategy Tester to check historical performance and win rate.
What causes false signals in the Trend Trigger Factor indicator?
Low volume, choppy sideways markets, and repeated extreme TTF readings without price follow-through. I reduce false signals by waiting for a confirming candle after the trigger, and by checking the higher timeframe trend first.