
2026 Best Pine Script Generator - Pineify

· 13 min read
Pineify Team
Pine Script and AI trading workflow research team

Ever sat down to create a custom trading indicator on TradingView, only to hit a wall when you realize you need to learn Pine Script? You're definitely not alone here. Pine Script is TradingView's native programming language for building custom technical indicators and automated trading strategies. Whether you're a complete beginner or someone who knows their way around code but doesn't want to spend weekends debugging syntax errors, there's gotta be a better way, right?

Here's the thing about Pine Script - it's TradingView's programming language for building those custom indicators and automated trading strategies you see everywhere. Sure, it's not rocket science, but between learning the syntax, understanding the functions, and actually getting your ideas to work on charts... well, that's time you could be spending on what actually matters: trading and analyzing the markets.

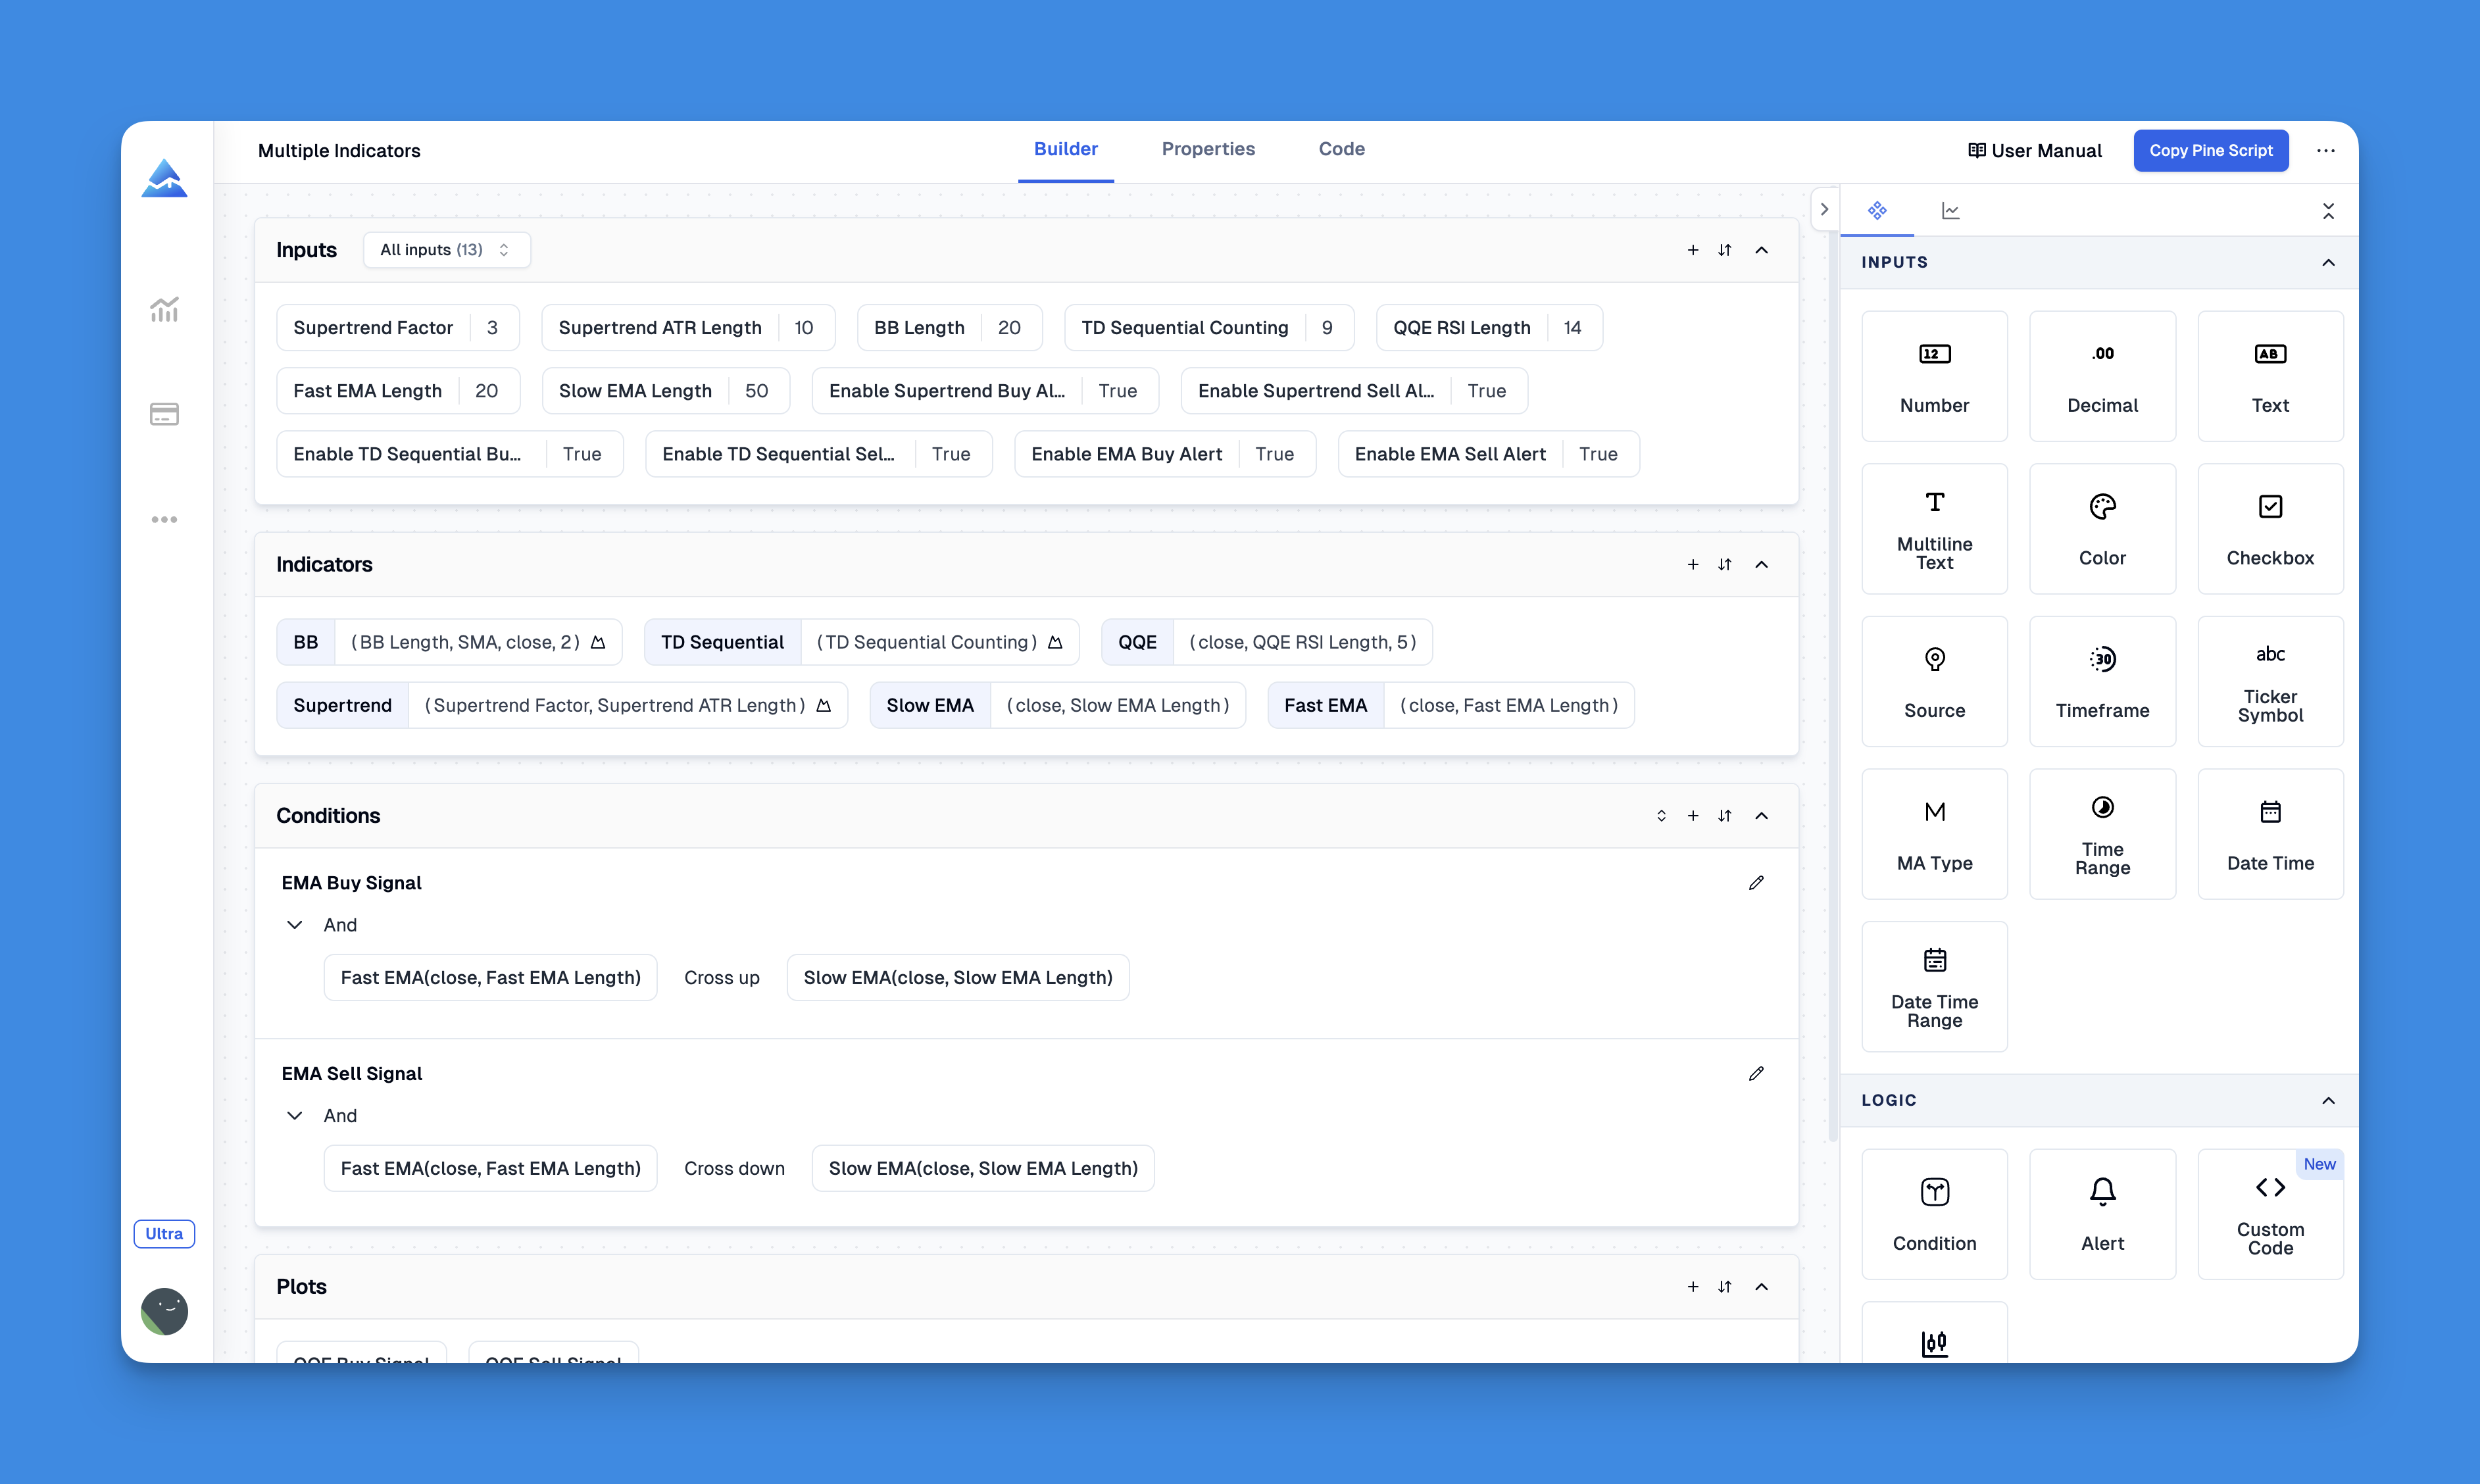
Enter Pineify - think of it as your personal Pine Script translator. You know how you have those brilliant trading ideas but struggle to turn them into actual code? That's exactly what this tool solves. Instead of wrestling with programming syntax, you describe what you want, and it handles all the technical heavy lifting.

Pineify | Best Pine Script Generator

Is TradingView a Broker? Platform vs. Broker Explained

· 10 min read
Pineify Team
Pine Script and AI trading workflow research team

TradingView is a charting and analysis platform, not a broker. If you've been confused about the difference, you're not alone. Many new traders assume TradingView handles their money and executes their trades directly. It doesn't. TradingView gives you charts, indicators, screeners, and backtesting tools, then connects you with regulated brokers who actually place your orders. The platform handles analysis and discovery; the broker handles custody and execution.

Is TradingView a Broker? Understanding TradingView's Role in Your Trading Strategy

Is TradingView Down? How to Check Status and Troubleshoot

· 8 min read
Pineify Team
Pine Script and AI trading workflow research team

TradingView is a web-based charting platform that millions of traders depend on for real-time market data, chart analysis, and strategy development. When it's down, you cannot check positions or execute trades. I lost access to my TSLA charts during a 3-minute outage in March 2025, and the first thing I did was check status.tradingview.com. That page tells you exactly what's broken and whether the team is already fixing it.

Is TradingView Down? How to Check Status and Troubleshoot [Keyword: is tradingview down]

Is TradingView Worth It in 2026? An Honest Review

· 13 min read
Pineify Team
Pine Script and AI trading workflow research team

Look, I get it. You're staring at TradingView's pricing page wondering if it's actually worth dropping $200+ a year on another trading platform. I've been there—coffee in hand, calculator out, trying to justify yet another subscription to my already-stretched trading budget.

TradingView is a cloud-based charting platform used by over 50 million traders for technical analysis across stocks, crypto, forex, and futures. I've tracked AAPL's price action on it for two years now, and the alert system caught the January 2025 breakout before most news outlets reported it. After three years of daily use across multiple markets, here's my honest take: for most active traders, it's worth paying for. But there are important exceptions, and I'll tell you exactly who should skip it.

Is TradingView Worth It in 2025?

Kavout vs Pineify AI Finance Agent: Which Better Serves Traders?

· 9 min read
Pineify Team
Pine Script and AI trading workflow research team

I've spent the last year testing AI finance tools, and the gap between Kavout and Pineify AI Finance Agent surprised me. Kavout is an AI stock research platform that rates 8,000+ U.S. equities with its Kai Score. Pineify AI Finance Agent is a live-data chat assistant covering 11,000+ global stocks, SEC filings, options chains, and earnings calls. For the way I trade — heavy on options and international exposure — Pineify wins by a wide margin.


Kavout vs Pineify AI Finance Agent: Which AI Tool Wins for Traders?

Klinger Oscillator Strategy: Volume-Based Trading Signals

· 17 min read
Pineify Team
Pine Script and AI trading workflow research team

Trying to figure out if a stock's price move has real backing or is just noise? The Klinger Oscillator strategy looks at volume data to tell you whether money is actually flowing into or out of a position. It's not a perfect tool, but I've found it gives me a much clearer read on market conviction than price alone.

The Klinger Oscillator is a volume-based momentum indicator that measures the force behind price moves. It separates buying volume from selling volume and tracks how those forces shift over time. This helps you see hidden strength or weakness before it shows up on the price chart.

Klinger Oscillator Strategy: Master Volume-Based Trading Signals and Techniques

Pine Script for Beginners: Build Your First TradingView Indicator

· 16 min read
Pineify Team
Pine Script and AI trading workflow research team

Pine Script is TradingView's own programming language, and it's like having a custom workshop for your trading charts. You can build your own indicators, set up automated strategies, and create alerts that fit your specific style. Learning it means you're no longer stuck with the default tools -- you can create exactly what you need. I've been writing Pine Script for about three years, and I still discover new tricks every quarter.

Learn Pine Script TradingView: A Beginner's Guide to Custom Trading Tools

Linear Regression Candles: Smoothed Price Action for Clearer Trends

· 16 min read
Pineify Team
Pine Script and AI trading workflow research team

Ever looked at a candlestick chart during choppy market conditions and felt like you were trying to find a trend in pure chaos? I've spent hours squinting at noise-filled charts on the SPY 5-minute, missing good setups because the price action was too erratic to read clearly.

Linear Regression Candles is a statistical trend-smoothing technique that applies linear regression to each OHLC component over a set lookback period. It solved a real problem for me in January 2025 when I was trading BTC/USD and getting chopped up by intraday noise. Instead of plotting raw data, the indicator calculates a regression line for open, high, low, and close values separately, then displays them as smoothed candles that filter noise while preserving trend structure.

What I found most valuable is how these smoothed candles make trend changes visible earlier. When raw candles are still fighting back and forth on the 15-minute chart, the LinReg candles often show a clearer directional bias. Combined with a signal line (SMA or EMA of the close), you get a clean framework for identifying trend direction and potential reversals.

Linear Regression Candles Indicator Chart

Linear Regression Slope: Track Trend Momentum on TradingView

· 18 min read
Pineify Team
Pine Script and AI trading workflow research team

Have you ever watched a trend on your chart and wondered whether it's actually gaining steam or quietly running out of gas? The Linear Regression Slope indicator is a trend momentum tool that calculates the rate of change of a best-fit line fitted to recent closing prices. I've been in that situation more times than I can count — price keeps moving in one direction, but something feels off. The candles get smaller, the momentum fades, and by the time I realize the trend is dying, it's already reversed. The regression slope would have told me earlier.

Instead of guessing whether a trend is strong or weak, this indicator gives you the actual rate of change. When the slope is positive and rising, the uptrend accelerates. When it's positive but declining, the trend loses momentum even though price is still going up. That early warning has saved me from holding positions too long more than once — EURUSD on daily charts in March 2025 comes to mind, when the slope started dropping two weeks before the reversal.

How to search for and add indicator pages in the Pineify editor