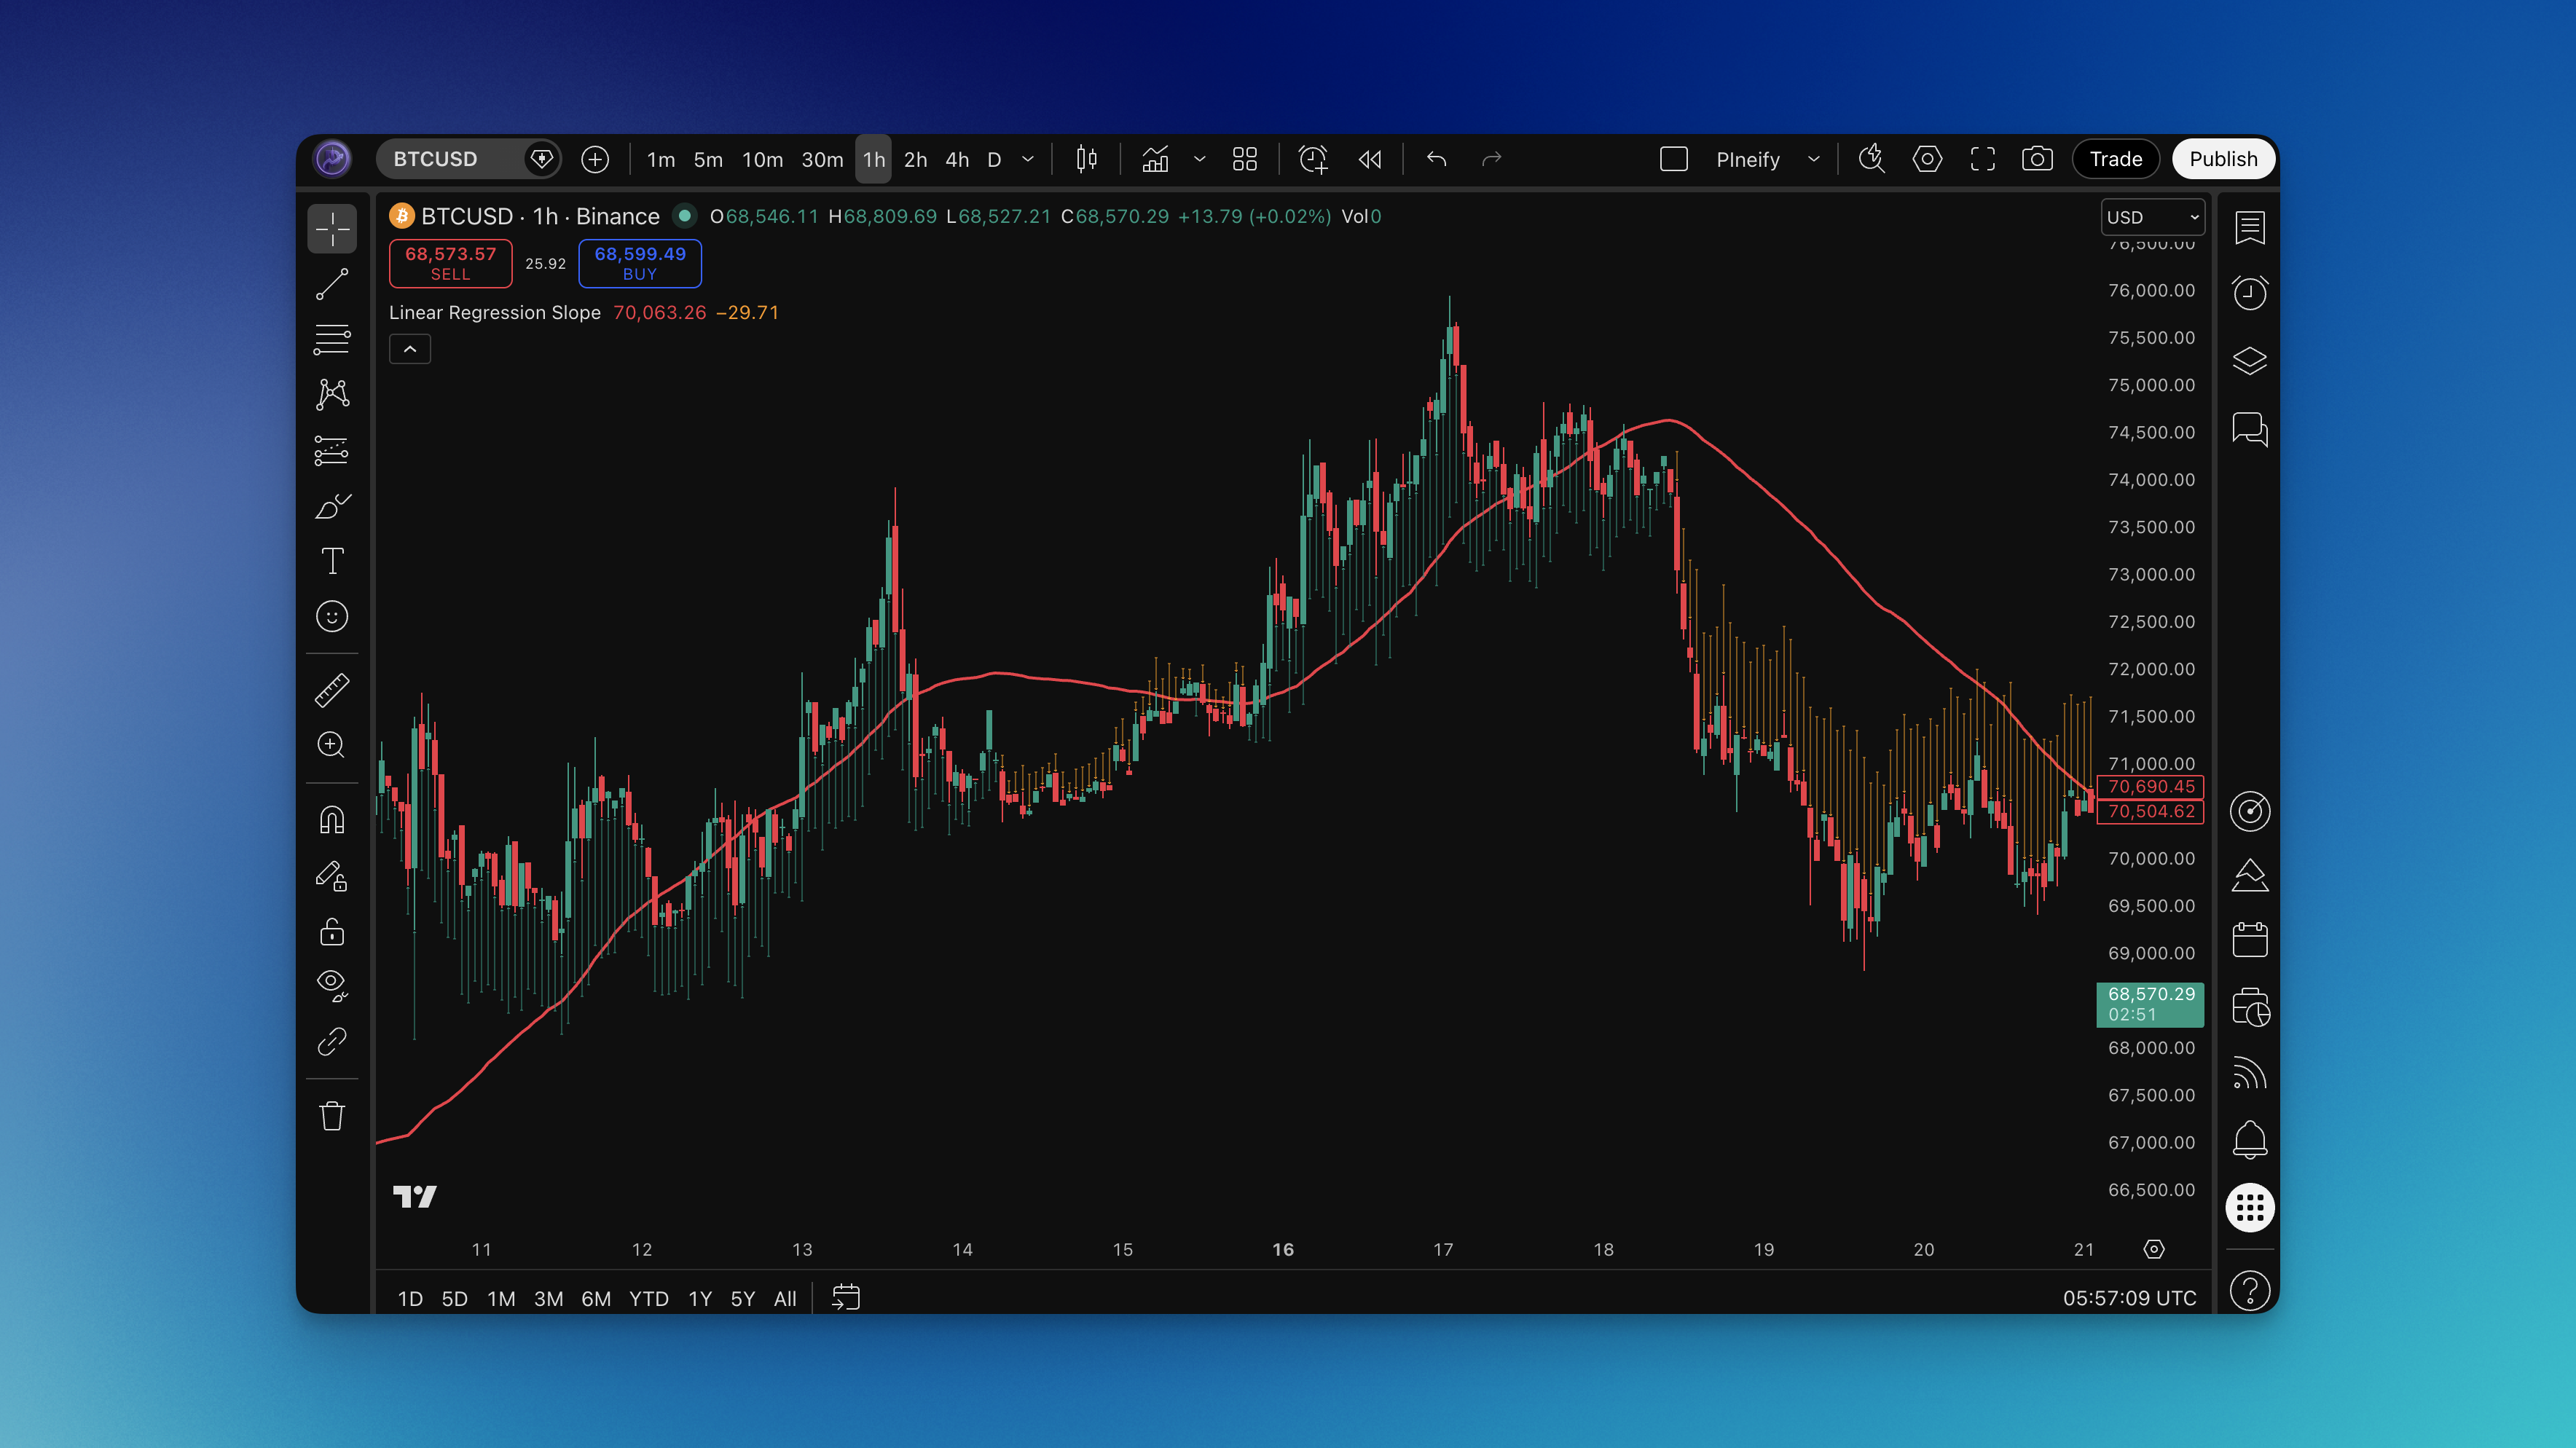
Linear Regression Trading Strategy for Predictive Analytics

· 19 min read
Pineify Team
Pine Script and AI trading workflow research team

Linear regression is a way to find the simple, straight-line trend hidden within noisy price data. It draws the single best straight line through a scatterplot of points, showing direction and momentum. I've been applying this to AAPL daily charts since 2021, and it consistently identifies trend direction faster than a 50-period SMA. It's a core tool for spotting trends, making forecasts, or understanding relationships between variables.

Linear Regression Trading Strategy: Predictive Analytics Guide

Linear Weighted Moving Average LWMA: Settings and Signals

· 16 min read
Pineify Team
Pine Script and AI trading workflow research team

You know what drives me crazy about most moving averages? They treat every price point the same, whether it's from yesterday or last month. It's like asking your best friend for advice and giving equal weight to what they said three weeks ago versus what they're telling you right now.

That's why I rely on the Linear Weighted Moving Average (LWMA). This indicator puts more weight on recent prices and less on older data. The Linear Weighted Moving Average is a trend-following indicator that multiplies each price point by a linear coefficient, giving the highest weight to the most recent bar. While simple moving averages assume every data point matters equally, LWMA focuses on what the market is doing right now.

Think of LWMA as the moving average that actually keeps up. It responds faster to price changes while still smoothing out random noise. Whether you're scalping five-minute charts or swing trading daily timeframes, this indicator gives clearer signals and better timing.

Lux Algo Premium Review: Honest Take After 6 Months

· 12 min read
Pineify Team
Pine Script and AI trading workflow research team

Look, I've been trading for over three years now, and I kept seeing Lux Algo Premium everywhere - YouTube ads, Discord chats, you name it. After months of curiosity (and frankly, some FOMO), I finally pulled the trigger and tried it.

Six months later, I'm still using it daily. But here's the thing - it's not what I expected, and there's definitely stuff their marketing doesn't tell you. You're about to find out exactly what.

Moving Average Crossover Strategy: MA Cross Signals & Rules

· 23 min read
Pineify Team
Pine Script and AI trading workflow research team

The moving average crossover strategy is a classic way traders spot potential trend changes in the market. It's simple to grasp and can be applied to almost anything you trade — stocks, forex, crypto, or commodities. At its heart, it's about watching the relationship between two moving average lines on your chart.

When a faster-moving average (which closely follows recent prices) crosses over a slower one (which reflects the longer-term trend), it often signals that the market's momentum is shifting. Think of it like an early warning system built right into your price chart. I've been using this approach since 2019, and on SPY daily charts the 50/200 SMA cross has flagged every major trend shift in that period — though not always at the ideal entry point.

MA Cross Strategy: Complete Guide to Moving Average Crossover Trading

MACD 4C Indicator: Read Momentum Direction with Color-Coded Bars

· 9 min read
Pineify Team
Pine Script and AI trading workflow research team

Ever stared at a MACD histogram wondering if those bars mean buy, sell, or just wait? The MACD 4C indicator is a modified MACD histogram that uses four colors to show momentum strength and direction. It replaces the standard two-color system with bright green, dark green, red, and dark red bars — so you can see not just which side is winning, but how hard they're pushing.

MACD Leader Indicator: Catch Momentum Shifts 2-3 Bars Earlier

· 11 min read
Pineify Team
Pine Script and AI trading workflow research team

Ever feel like you're always one step behind the market? You see a perfect setup forming, but by the time you enter, the best part of the move is already over. The MACD Leader indicator is a momentum oscillator that uses double-smoothing to detect trend shifts 2-3 bars before standard MACD registers them. It works by calculating an initial MACD, then applying a second smoothing layer that acts as an impulse predictor — showing you where momentum is headed, not just where it's been.

While most traders watch regular MACD signals, this variant gives you earlier positioning. It's not magic — the formula is simple:

MACD = EMA(close, 12) - EMA(close, 26)
MACD Leader = EMA(MACD, impulse_period)

Where impulse_period defaults to 3. That second EMA pass pulls the leader line ahead of the main MACD.

MACD Leader Indicator showing early momentum signals on TradingView

Magnifi vs Pineify AI Finance Agent: Which AI Investing Tool Wins?

· 14 min read
Pineify Team
Pine Script and AI trading workflow research team

The first thing you need to know: Pineify's Finance AI Agent beats Magnifi for active traders, plain and simple. An AI finance agent is a tool that takes your plain-English questions and pulls live market data to give you tradeable answers. I've tested both platforms for over four months on real portfolios, running the same queries on NVDA, TSLA, and QQQ options chains. Magnifi works fine if you're a casual investor who just wants a dashboard. But I wouldn't use it for options analysis or insider trade tracking — Pineify handles both far better.

Magnifi vs Pineify AI Finance Agent: Which AI Investing Tool Delivers Better Results?

Mansfield Relative Strength: Spot Stocks Outperforming the Market

· 14 min read
Pineify Team
Pine Script and AI trading workflow research team

Mansfield Relative Strength is a comparative momentum indicator that measures a stock's return against the S&P 500, showing you whether it's genuinely outperforming or just riding the market's coattails. I've been burned too many times by stocks that looked strong on their own chart but were actually lagging the broader market — this indicator fixed that blind spot for me.

Most traders obsess over whether a stock is going up or down. The better question is whether it's going up faster than everything else. MRS answers that with a single line normalized around zero. Above zero means outperformance. Below zero means the stock is underperforming. No guesswork.

When AAPL was up 2% in a day last November but the S&P 500 gained 3.1%, MRS showed a negative reading. I'd have missed that warning if I only stared at AAPL's green candle. That's the whole value of this tool — it forces you to compare, not just observe.

Mansfield Relative Strength Indicator on Chart

Marc Chaikin AI Stock Picks: Power Gauge Analysis

· 11 min read
Pineify Team
Pine Script and AI trading workflow research team

The Marc Chaikin AI stock pick system, known as the Power Gauge, is a data-driven tool that scores stocks by analyzing over 20 fundamental and technical factors. It launched in 2011 and uses machine learning to predict which stocks will outperform or underperform the market over one to six months. I've been following Chaikin's work since 2011, and the Power Gauge has consistently been one of the most interesting AI-driven rating systems I've come across.

Marc Chaikin AI Stock Picks: The Complete Guide to Power Gauge Analysis

Market Cipher Free: Best Free Alternatives for Traders in 2026

· 9 min read
Pineify Team
Pine Script and AI trading workflow research team

Market Cipher costs up to $1,500 for lifetime access. I don't think most retail traders need to spend that. The free VuManChu Cipher B + Divergences on TradingView delivers the same core signal structure — green and red dots based on WaveTrend, RSI, and Money Flow convergence. Here's what I've found testing both on real crypto charts since early 2025. On BTCUSD, I've compared hundreds of signal bars — the dot timing on VuManChu is usually within one bar of the paid version.

Market Cipher on Chart