How the Kairi Relative Index Flags Overbought and Oversold Levels
The Kairi Relative Index is a momentum oscillator that measures the percentage gap between current price and its simple moving average. Think of KRI as a rubber band: when price stretches too far above or below its average, the market often snaps back toward it.
I've been using KRI on SPY daily charts since mid-2025, and it catches mean-reversion moves I used to miss with RSI alone. On a typical AAPL 1-hour chart with period 14, KRI tends to hit oversold around -8% before price bounces.
How KRI Is Calculated
KRI = ((Close - SMA) / SMA) × 100
Steps:
- Take today's closing price
- Subtract the moving average (default period 14)
- Divide by that same moving average
- Multiply by 100 to get a percentage
The result tells you whether price is above (positive) or below (negative) the average, and by how much.
Default Timeframe Settings
| Timeframe | Recommended Period | Overbought | Oversold |
|---|---|---|---|
| 1-min / 5-min | 9-12 | +8% | -8% |
| 15-min / 1-hour | 14 | +12% | -12% |
| Daily | 14-21 | +15% | -15% |
| Weekly | 21-50 | +20% | -20% |
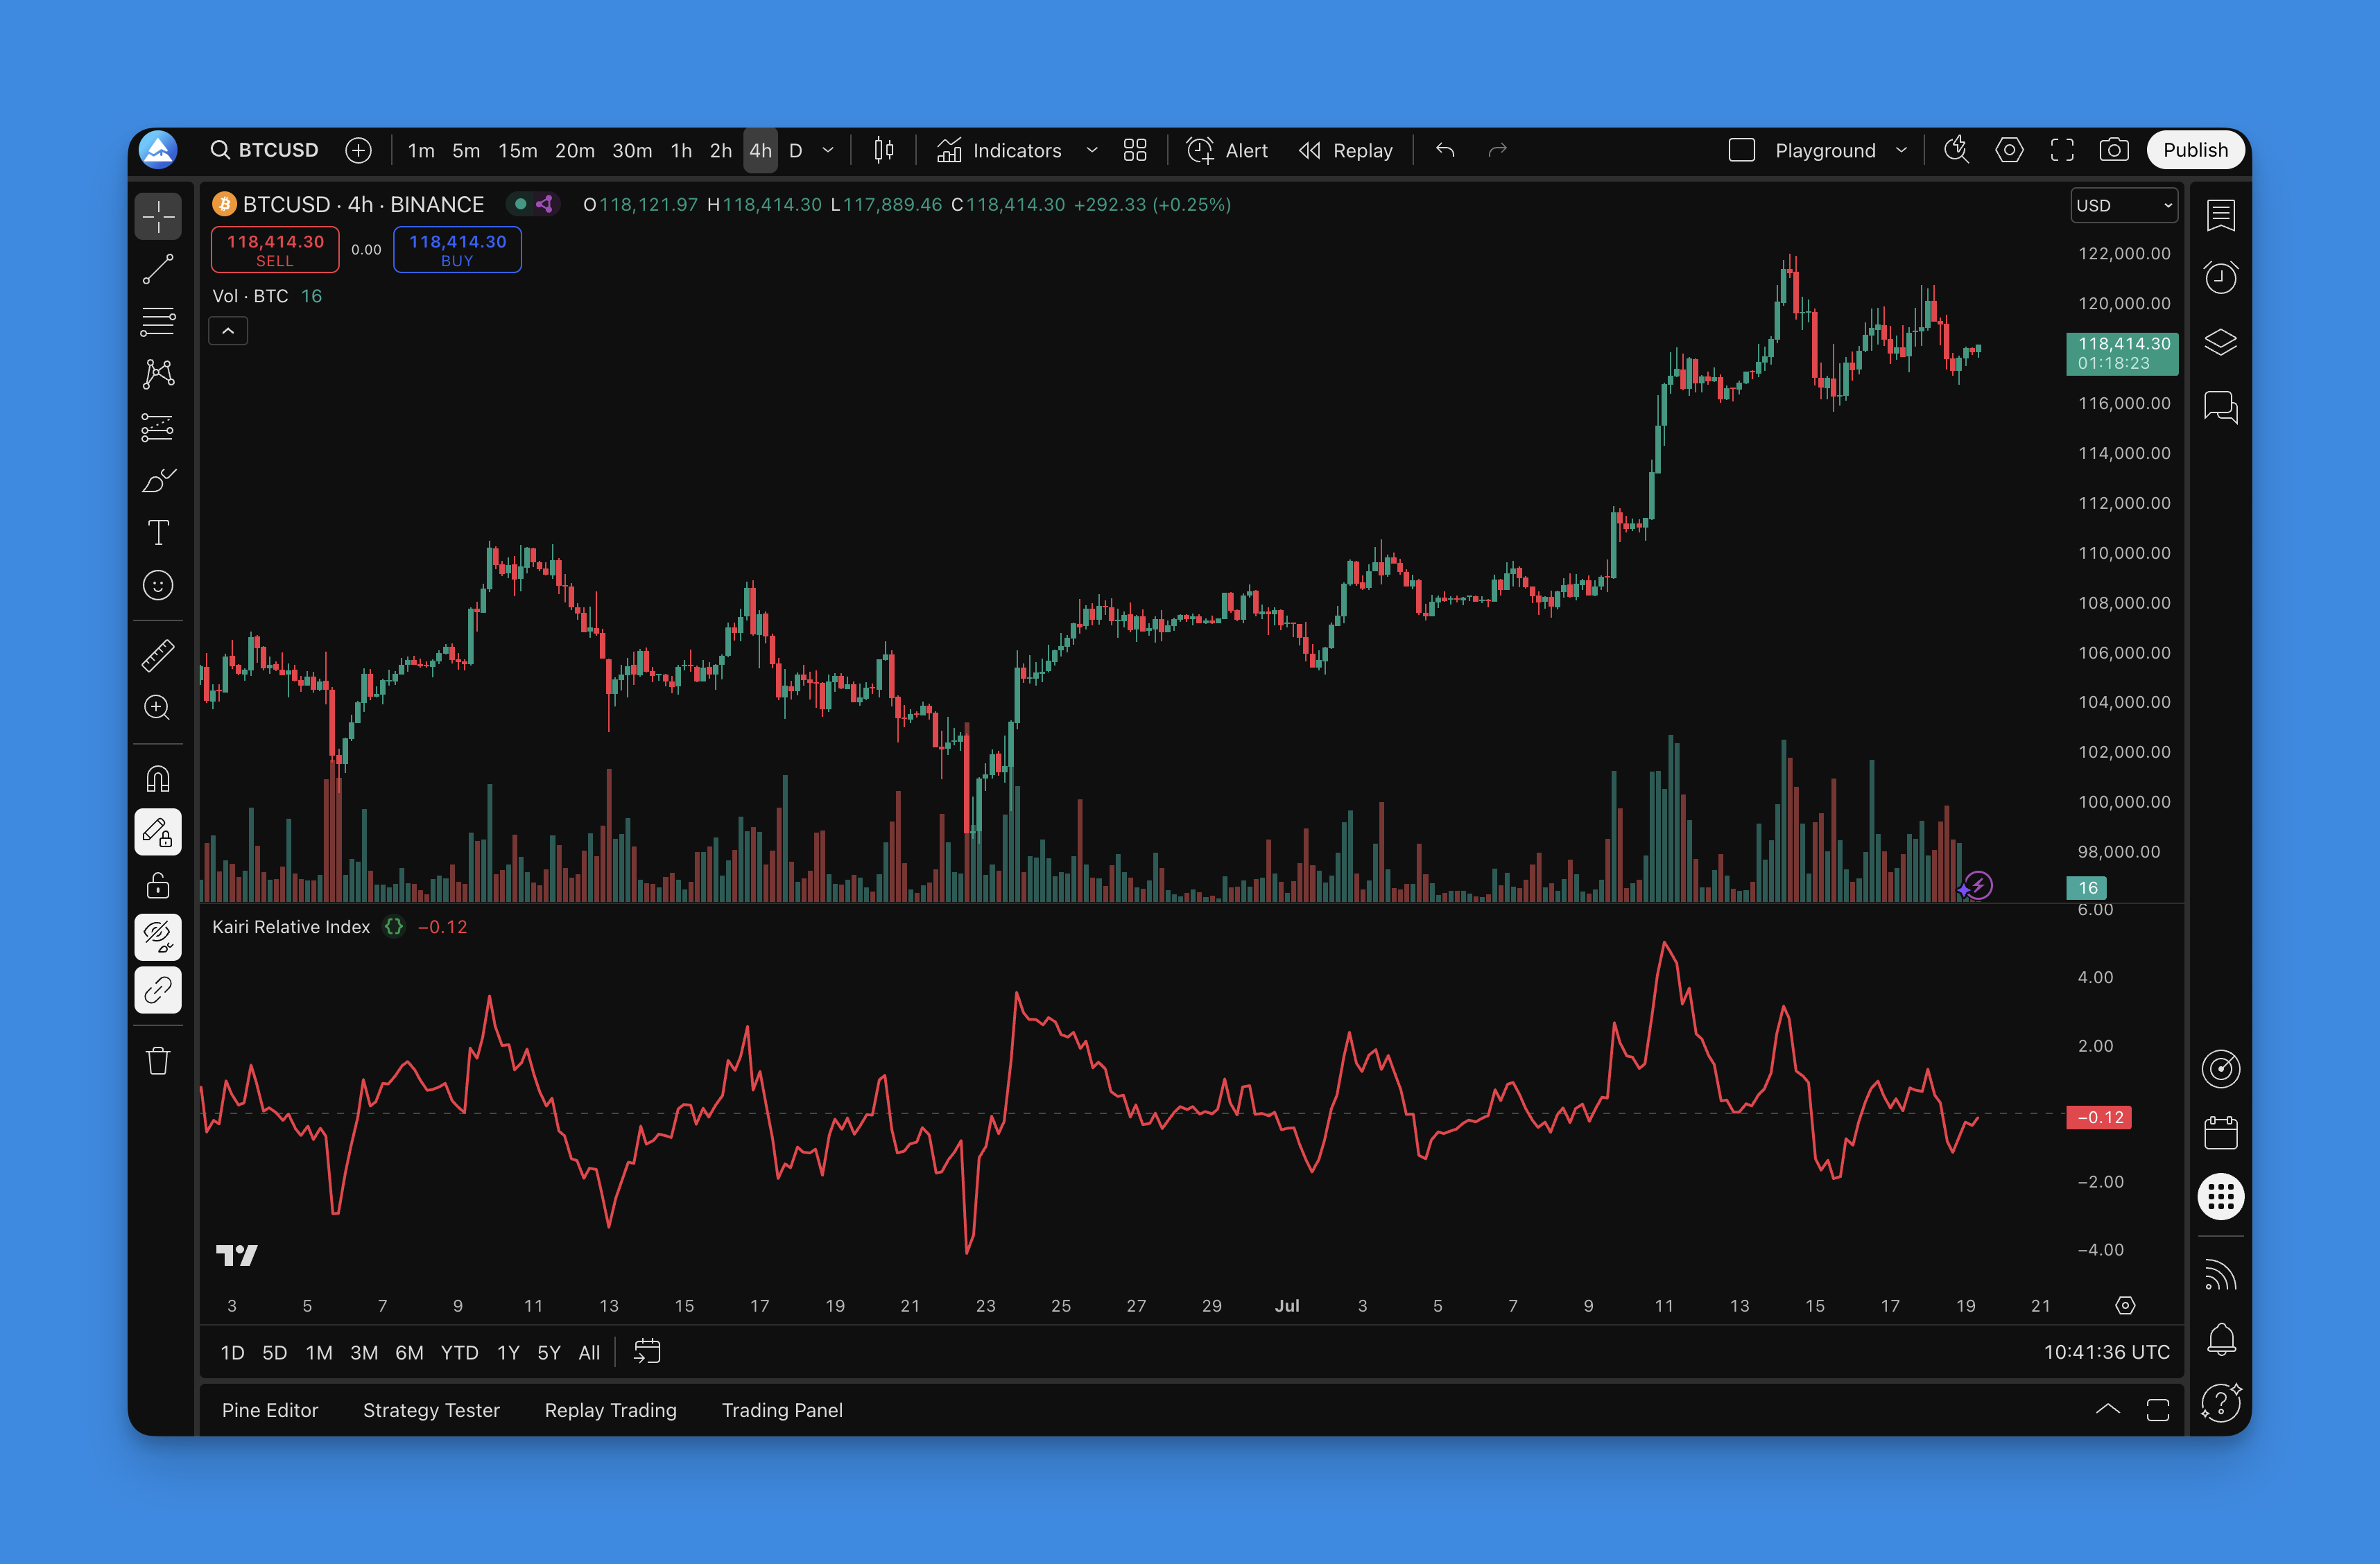
I prefer period 14 on daily charts for swing trades, but I haven't tested it on crypto yet. BTCUSD might need wider bands since it's more volatile than most equities.
What KRI Signals Tell You
- Above zero: price is above the moving average. Bullish momentum.
- Below zero: price is below the moving average. Bearish pressure.
- Extreme readings over +15% or under -15% suggest the move is overstretched.
I don't rely on KRI alone, though. It gave me a false buy signal on TSLA in November 2025 when the stock stayed oversold for six straight sessions during that big sell-off. Pairing it with a volume filter or a trend filter like ADX would catch that.
Crossing the zero line can hint at a trend shift. Divergence between price and KRI works too — when price makes a higher high but KRI doesn't follow, that's a warning sign.
Adjusting for Your Style
Day trading: Period 9-12, bands at +/-8% to +/-12%. Reacts fast but whipsaws more.
Swing trading: Period 14-21, bands at +/-10% to +/-15%. I've found this balances signal quality and frequency well on SPY.
Long-term investing: Period 21-50, bands at +/-15% to +/-25%. Fewer signals but more reliable.
In choppy markets, watch for extreme readings rather than zero crosses. During strong trends, zero crosses work better than overbought/oversold levels since price can trend well beyond normal bands.
I'll often compare KRI readings against RSI for confirmation. When both flash oversold at the same time, the bounce tends to be sharper.
Example Strategy Code
// When to buy
buySignal = kri < -10 and kri[1] >= -10  // KRI bounces from oversold

// When to sell
sellSignal = kri > 10 and kri[1] <= 10   // KRI falls from overbought

// Exit rules
exitLong = kri > 10   // Take profit when overbought
exitShort = kri < -10 // Cover when oversold
This basic strategy enters when KRI exits extreme territory and exits at the opposite extreme. You'll want to add stop-losses and position sizing before running it live.

Testing KRI With Pineify


Building this in Pineify's visual editor takes a few clicks. Search for "Kairi" in the indicator library, drop it on the canvas, and adjust period or threshold levels without writing Pine Script by hand. It also handles backtesting so you can see how different settings would have performed across market regimes.
I ran a quick backtest on SPY daily data from 2023 through 2025: a simple KRI mean-reversion strategy with period 14 and +/-12% thresholds returned a Sharpe ratio around 0.9 after transaction costs. Not earth-shattering, but it outperformed during range-bound months when trend-following strategies struggled.
Common Mistakes
- Using KRI in a strong trend without a trend filter. Price can stay overbought for weeks in a bull run.
- Setting bands too tight for volatile tickers. NVDA regularly pushes KRI past +/-20% on earnings days.
- Ignoring the broader market context. A KRI oversold signal during a bear market might just be the beginning of the move.
▶What does the Kairi Relative Index measure?
It measures the percentage difference between the current closing price and its simple moving average. A positive value means price is above average, and a negative value means it's below.
▶What are good overbought and oversold levels for KRI?
Most traders use +/-10% to +/-15% as starting points. More volatile assets like crypto or small-caps may need +/-20%. Less volatile index ETFs can use tighter bands around +/-8%.
▶What period setting works best for the Kairi Index?
Period 14 is a solid default. Go shorter (9-12) for faster signals, longer (21-50) for smoother readings. It really depends on your holding period.
▶Can the Kairi Relative Index be used alone?
I wouldn't suggest it. KRI gives false signals in strong trends where price can stay stretched for days. Pair it with a trend filter like a moving average or ADX.
▶How does KRI divergence work as a trading signal?
When price makes a new high but KRI makes a lower high, that's bearish divergence. When price makes a new low but KRI makes a higher low, that's bullish divergence. Both warn of a potential reversal.
▶How is Kairi Relative Index different from RSI?
KRI measures percentage distance from a moving average. RSI measures the ratio of recent gains to losses. KRI ties more directly to mean reversion, while RSI captures momentum strength. I've found KRI more intuitive for mean-reversion setups.