Intraday Intensity Index: Read Volume Pressure on TradingView
Ever wondered why some price movements feel "real" while others seem fake? The Intraday Intensity Index (III) might be the missing piece in your trading puzzle. This volume-based indicator doesn't just look at how much trading happened—it reveals whether that volume actually supports the price movement or fights against it.
What is the Intraday Intensity Index?
The Intraday Intensity Index is a volume-based indicator created by Dave Bostian. It measures whether trading volume supports or contradicts price movements by looking at where prices close within their daily range, then multiplying that position by volume. Think of it as your volume detective. While most traders just glance at volume bars, the III digs deeper—it tells you whether that volume is actually pushing prices up or dragging them down.
Here's how to read it:
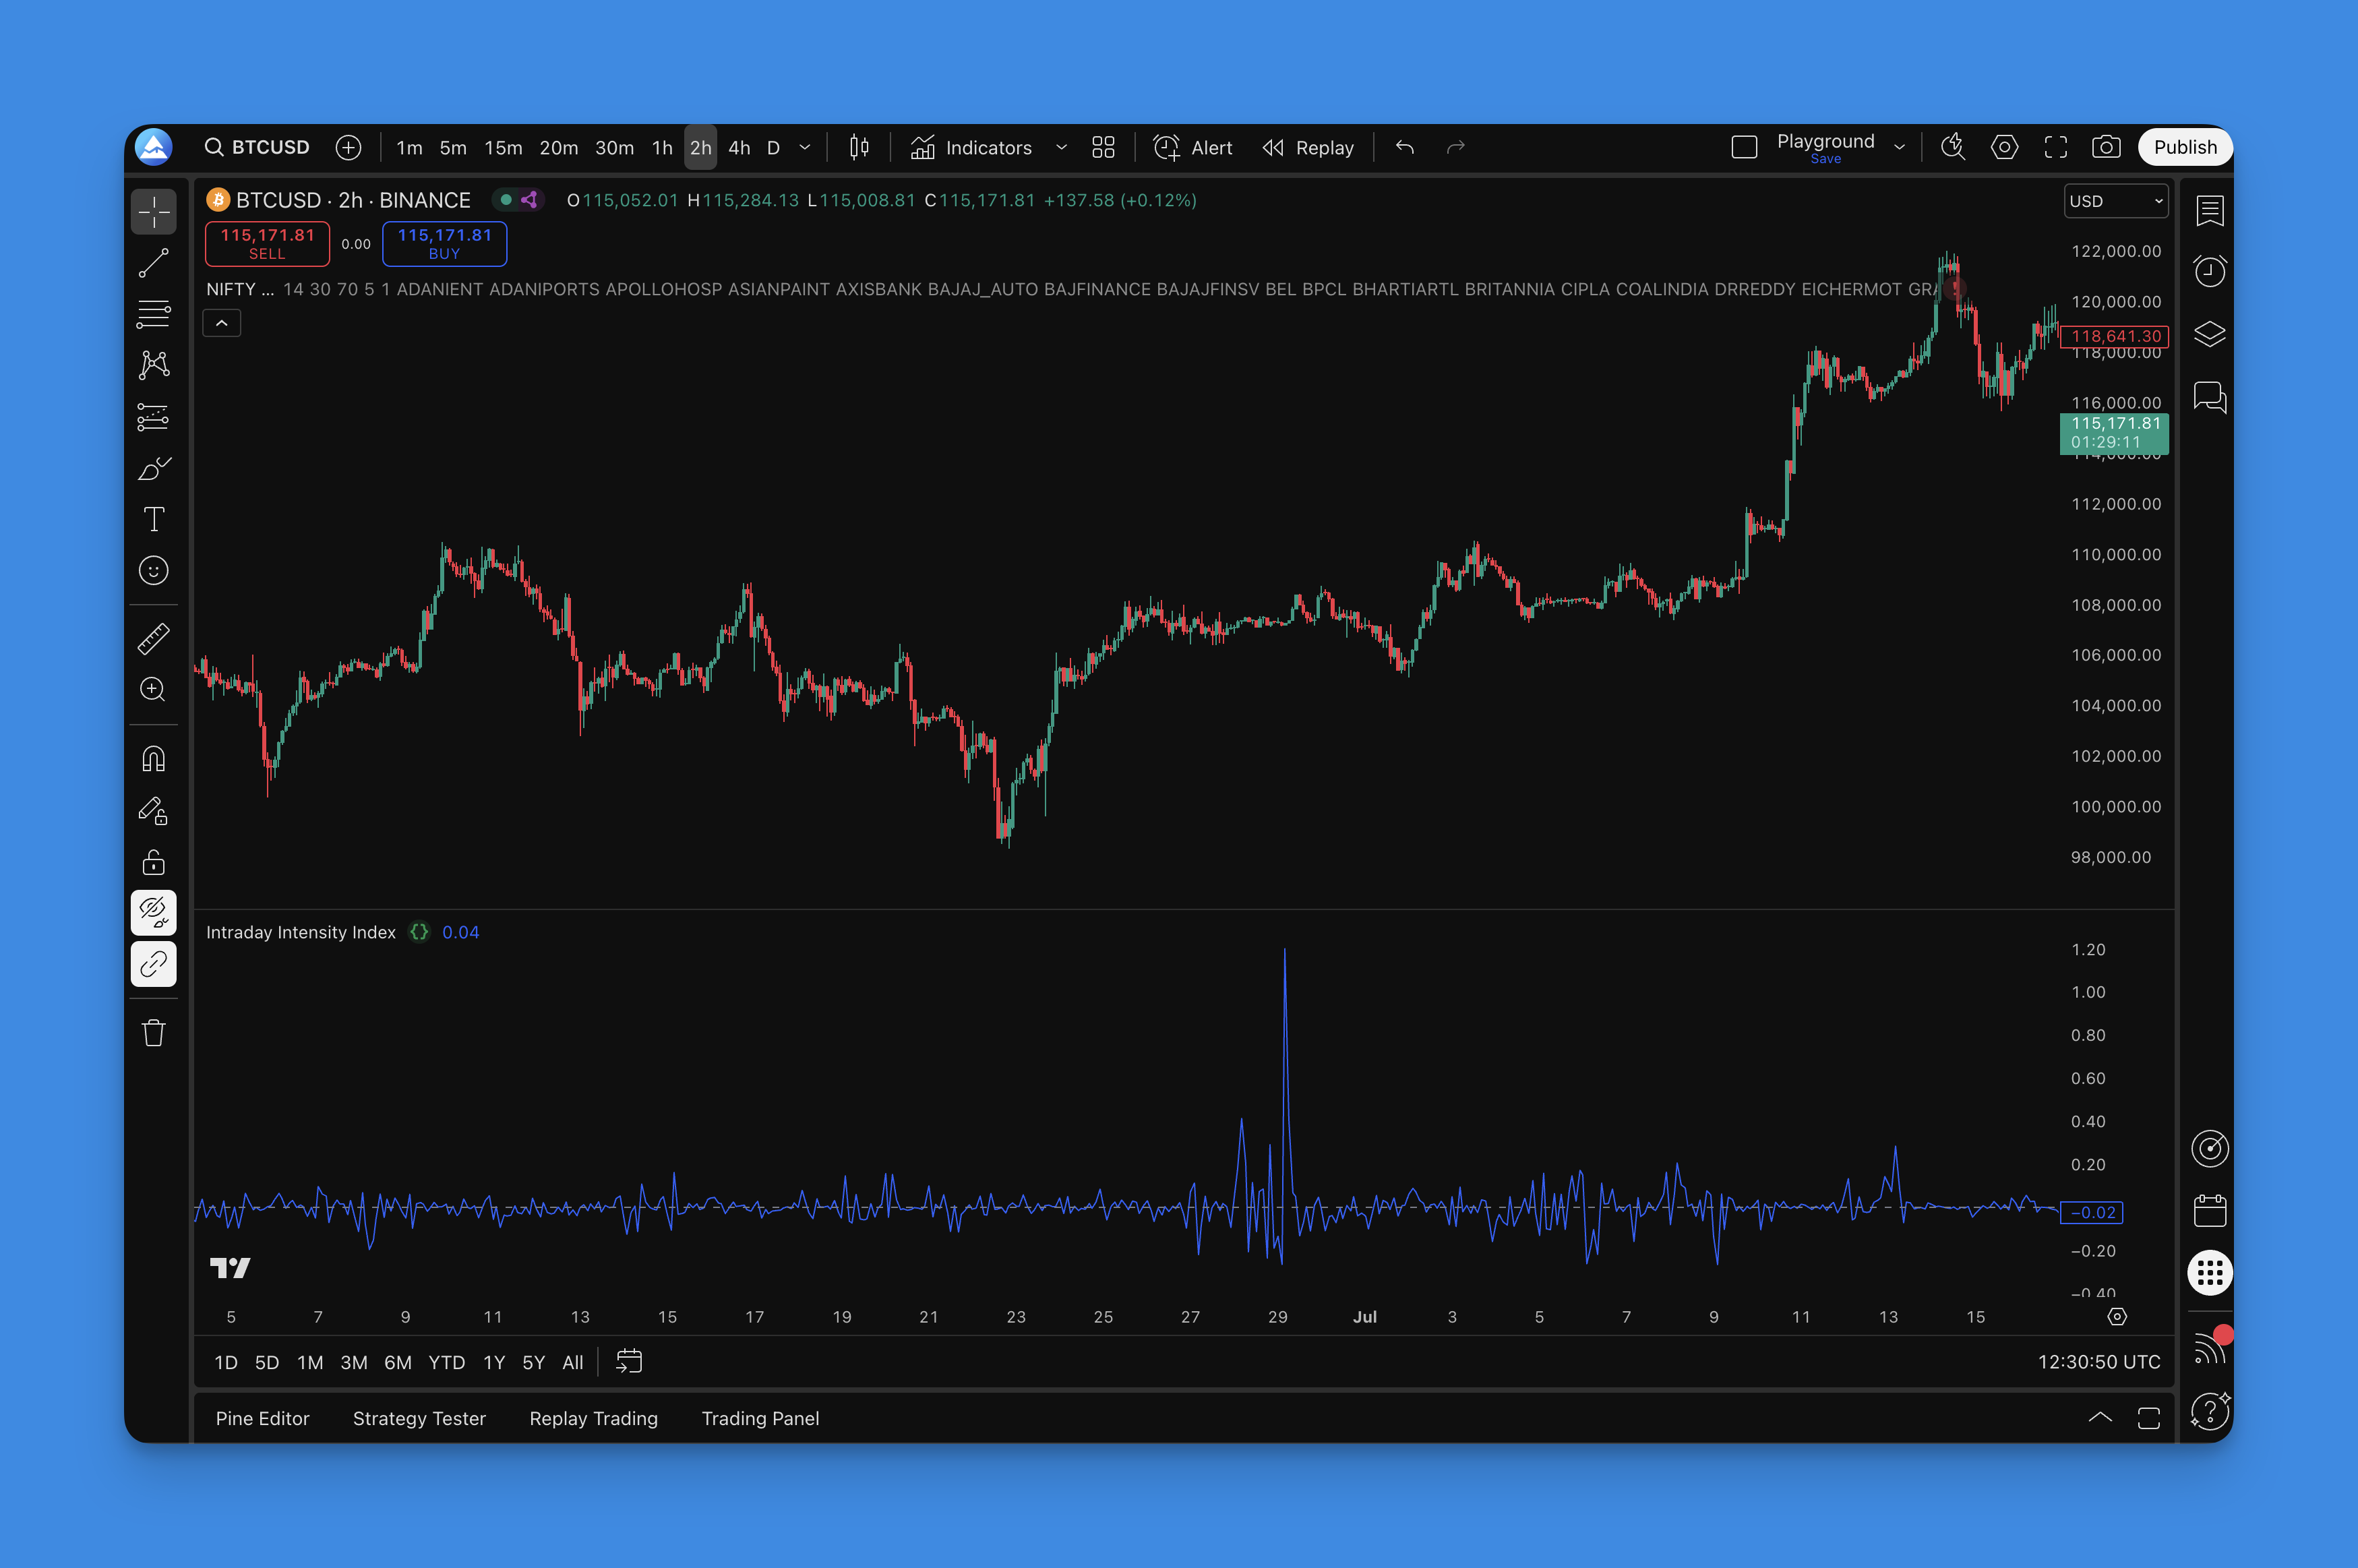
- Positive values: Prices closed in the upper half of the day's range with heavy volume—buyers were in control
- Negative values: Prices closed in the lower half with heavy volume—sellers dominated
- Near zero: Either low volume or prices closed right in the middle—nobody really cared
The math behind it is straightforward: III = (2 × Close - High - Low) / (High - Low) × Volume
What makes this special? Unlike simple volume indicators, the III shows you the quality of volume, not just quantity. This helps you spot when a breakout has real conviction behind it versus when it's just noise.
How to Add the Intraday Intensity Index to Your TradingView Charts

Getting the III indicator on your charts is straightforward:
Using Pineify:
- Head to the Pineify platform and open the Pine Script editor
- Search for "Intraday Intensity Index" in the indicator library
- Select the indicator and tweak any settings to match your style
- Let Pineify generate clean, optimized Pine Script code
- Copy the code and paste it into TradingView's Pine Editor
- Save and apply it to your chart
Manual Pine Script Route: If you're comfortable with coding, you can write the indicator yourself using Pine Script's built-in functions. The formula is simple enough that even beginners can tackle it with some practice.
Pineify handles error checking, optimization, and proper formatting so you can focus on trading instead of debugging code.

How to Actually Use the Intraday Intensity Index
Here's where the rubber meets the road. The III isn't just another line on your chart—it's a window into market psychology. Let me break down the practical ways to use it:
Trend Confirmation (Your New Best Friend) When you see a nice uptrend forming, check if the III is consistently positive. This tells you that buyers aren't just pushing prices up—they're doing it with conviction. I tested this on AAPL during its 2023 rally and watched the III stay positive for months. That's the kind of confirmation you can trust.
Spotting Divergences (The Early Warning System) This is where things get interesting. Say prices are hitting new highs, but your III is actually declining. That's the market whispering, "Hey, this rally is running out of steam." When TSLA hit $400 in late 2024, I noticed the III had already turned down a week before the pullback. Smart traders pay attention to these whispers before they become screams.
Volume Flow Detective Work The III shows you the direction of volume flow, not just the amount. Think of it like watching traffic—you don't just want to know how many cars are on the road, but which direction they're heading.
Zero Line Magic When the III crosses above zero, it's like the market switching from neutral to drive. Below zero? We're in reverse. These crossovers can give you early signals before price action becomes obvious to everyone else.
Extreme Readings (When Markets Get Emotional) When the III hits extreme positive or negative values, markets are getting emotional. These moments often precede reversals—kind of like when your friend gets too excited about a stock tip. Time to be cautious.
For more advanced techniques, you might want to combine the III with other volume-based indicators for a complete picture of market sentiment.
Fine-Tuning Your Intraday Intensity Index Settings
Here's the thing about the III—it's pretty much plug-and-play since it uses standard price and volume data. But that doesn't mean you can't optimize it for your trading style.
Timeframe Sweet Spots The III works across all timeframes, but here's what I've noticed:
| Timeframe | Best For | Signal Quality |
|---|---|---|
| 1-15 minutes | Day trading quick signals | Fast but noisy |
| 1-4 hours | Swing trading | Balanced |
| Daily | Position trading | Higher quality |
Shorter timeframes give you more signals (but also more noise), while longer timeframes give you fewer but higher-quality signals.
Smoothing the Noise Raw III can be a bit jumpy, especially on lower timeframes. Try adding a 5-10 period simple moving average to smooth things out. I prefer using a 5-period SMA for my SPY trades, though I haven't tested it on crypto pairs yet. It's like putting on reading glasses—suddenly everything becomes clearer.
Volume Matters (Obviously) The III works best on actively traded stocks or crypto with consistent volume. If you're looking at some penny stock that trades 100 shares a day, the III will be about as useful as a chocolate teapot.
Market Conditions Reality Check During crazy volatile periods (think March 2020 or crypto winter), the III might show extreme readings that would normally signal reversals. Context is everything—don't trade the indicator in isolation.
Power Combinations The III plays well with other indicators. Try pairing it with momentum oscillators or moving average systems for confirmation signals.
Backtesting the Intraday Intensity Index (The Smart Way)
Backtesting isn't about throwing some rules at historical data and hoping for the best. With the III, you need a systematic approach that actually tells you something useful.
Start With Clear Rules Before you even touch the backtest button, define exactly what you're testing:
- Entry: Maybe III crosses above zero with volume confirmation
- Exit: III diverges from price or drops below zero
- Risk Management: Stop-loss at recent support/resistance levels
Vague rules = useless backtest results.
Data Quality Matters Garbage in, garbage out. Make sure your historical data includes accurate high, low, close, and volume data. Missing or incorrect volume data will make your III backtest about as reliable as a weather forecast.
Test Multiple Timeframes What works on a 5-minute chart might be terrible on a 4-hour chart. Test your III strategy across different timeframes to see where it actually performs. Don't just assume it'll work everywhere.
Market Conditions Reality Check Your strategy might look amazing during trending markets but fall apart during sideways action. Test during:
- Bull markets
- Bear markets
- Choppy, range-bound periods
- High and low volatility environments
Track What Actually Matters Forget vanity metrics. Focus on:
- Win rate (but don't obsess over it)
- Average risk-reward ratio
- Maximum drawdown (this is crucial)
- Profit factor
- How it compares to just buying and holding
Sample Size Sanity You need at least 100+ trades across different market cycles. Testing on 20 trades from last month tells you nothing.
Walk-Forward Testing This is where you separate the pros from the amateurs. Proper backtesting techniques include walk-forward analysis to make sure you're not just curve-fitting to old data.
The III isn't going to make you rich overnight, but it's a solid tool for understanding what's really happening beneath the surface of price movements. While everyone else is staring at candlesticks, you'll be seeing the actual buying and selling pressure that drives those moves. The best traders don't rely on one indicator. They build a complete picture using multiple tools, proper risk management, and a healthy dose of common sense.
Ready to dive deeper into volume analysis? Check out other Pine Script indicators that can complement your III strategy.
Frequently Asked Questions
▶What is the Intraday Intensity Index and who created it?
The Intraday Intensity Index (III) is a volume-based indicator created by Dave Bostian. It measures whether trading volume supports or contradicts price movements by looking at where prices close within their daily range, then multiplying that position by volume. Positive values mean buyers are in control; negative values point to seller dominance.
▶How is the Intraday Intensity Index formula calculated?
The III formula is: (2 × Close - High - Low) / (High - Low) × Volume. This measures the quality of volume, not just the quantity. It tells you whether that volume is actually driving prices up or pulling them down based on where the close lands inside the high-low range.
▶What does a divergence between the III and price action signal?
When price hits new highs but the III is falling, buying conviction is weakening. That's a potential reversal signal. I've seen this play out on TSLA more than once. Conversely, if price makes new lows while the III rises, sellers might be running out of gas. These divergences tend to show up before most traders notice anything wrong.
▶What timeframes work best for the Intraday Intensity Index?
That depends on your style. Day traders get quick signals from 1–15 minute charts. Swing traders like me prefer 1–4 hour charts for cleaner reads. Position traders can use daily charts for the big picture. Longer timeframes mean fewer signals but higher reliability.
▶How can I reduce noise in the Intraday Intensity Index readings?
I add a 5-period simple moving average to the raw III values. That smooths out the jitter on lower timeframes. You can go up to 10 periods if you want even smoother readings, but don't overdo it or you'll miss the signals.
▶Does the Intraday Intensity Index work on all markets?
The III needs consistent volume to work. I've had good results on major stocks, indices, and liquid crypto pairs. It falls apart on thinly traded assets like penny stocks, where a single trade can throw off the readings completely.
▶How do I add the Intraday Intensity Index to TradingView?
The easiest way is through Pineify: search for the indicator in the library, customize the settings, generate the code, then paste it into TradingView's Pine Editor. You can also code it manually using the III formula if you prefer writing Pine Script by hand.