How to Build a MACD Crossover Strategy in Pine Script
Ever feel like you're guessing when to buy or sell? Yeah, me too. After a string of bad trades on BTCUSD in early 2023 — I lost about 12% in two weeks chasing breakouts — I decided to learn Pine Script and automate my signal detection. MACD turned out to be the first indicator I coded, and it's still one I use daily.
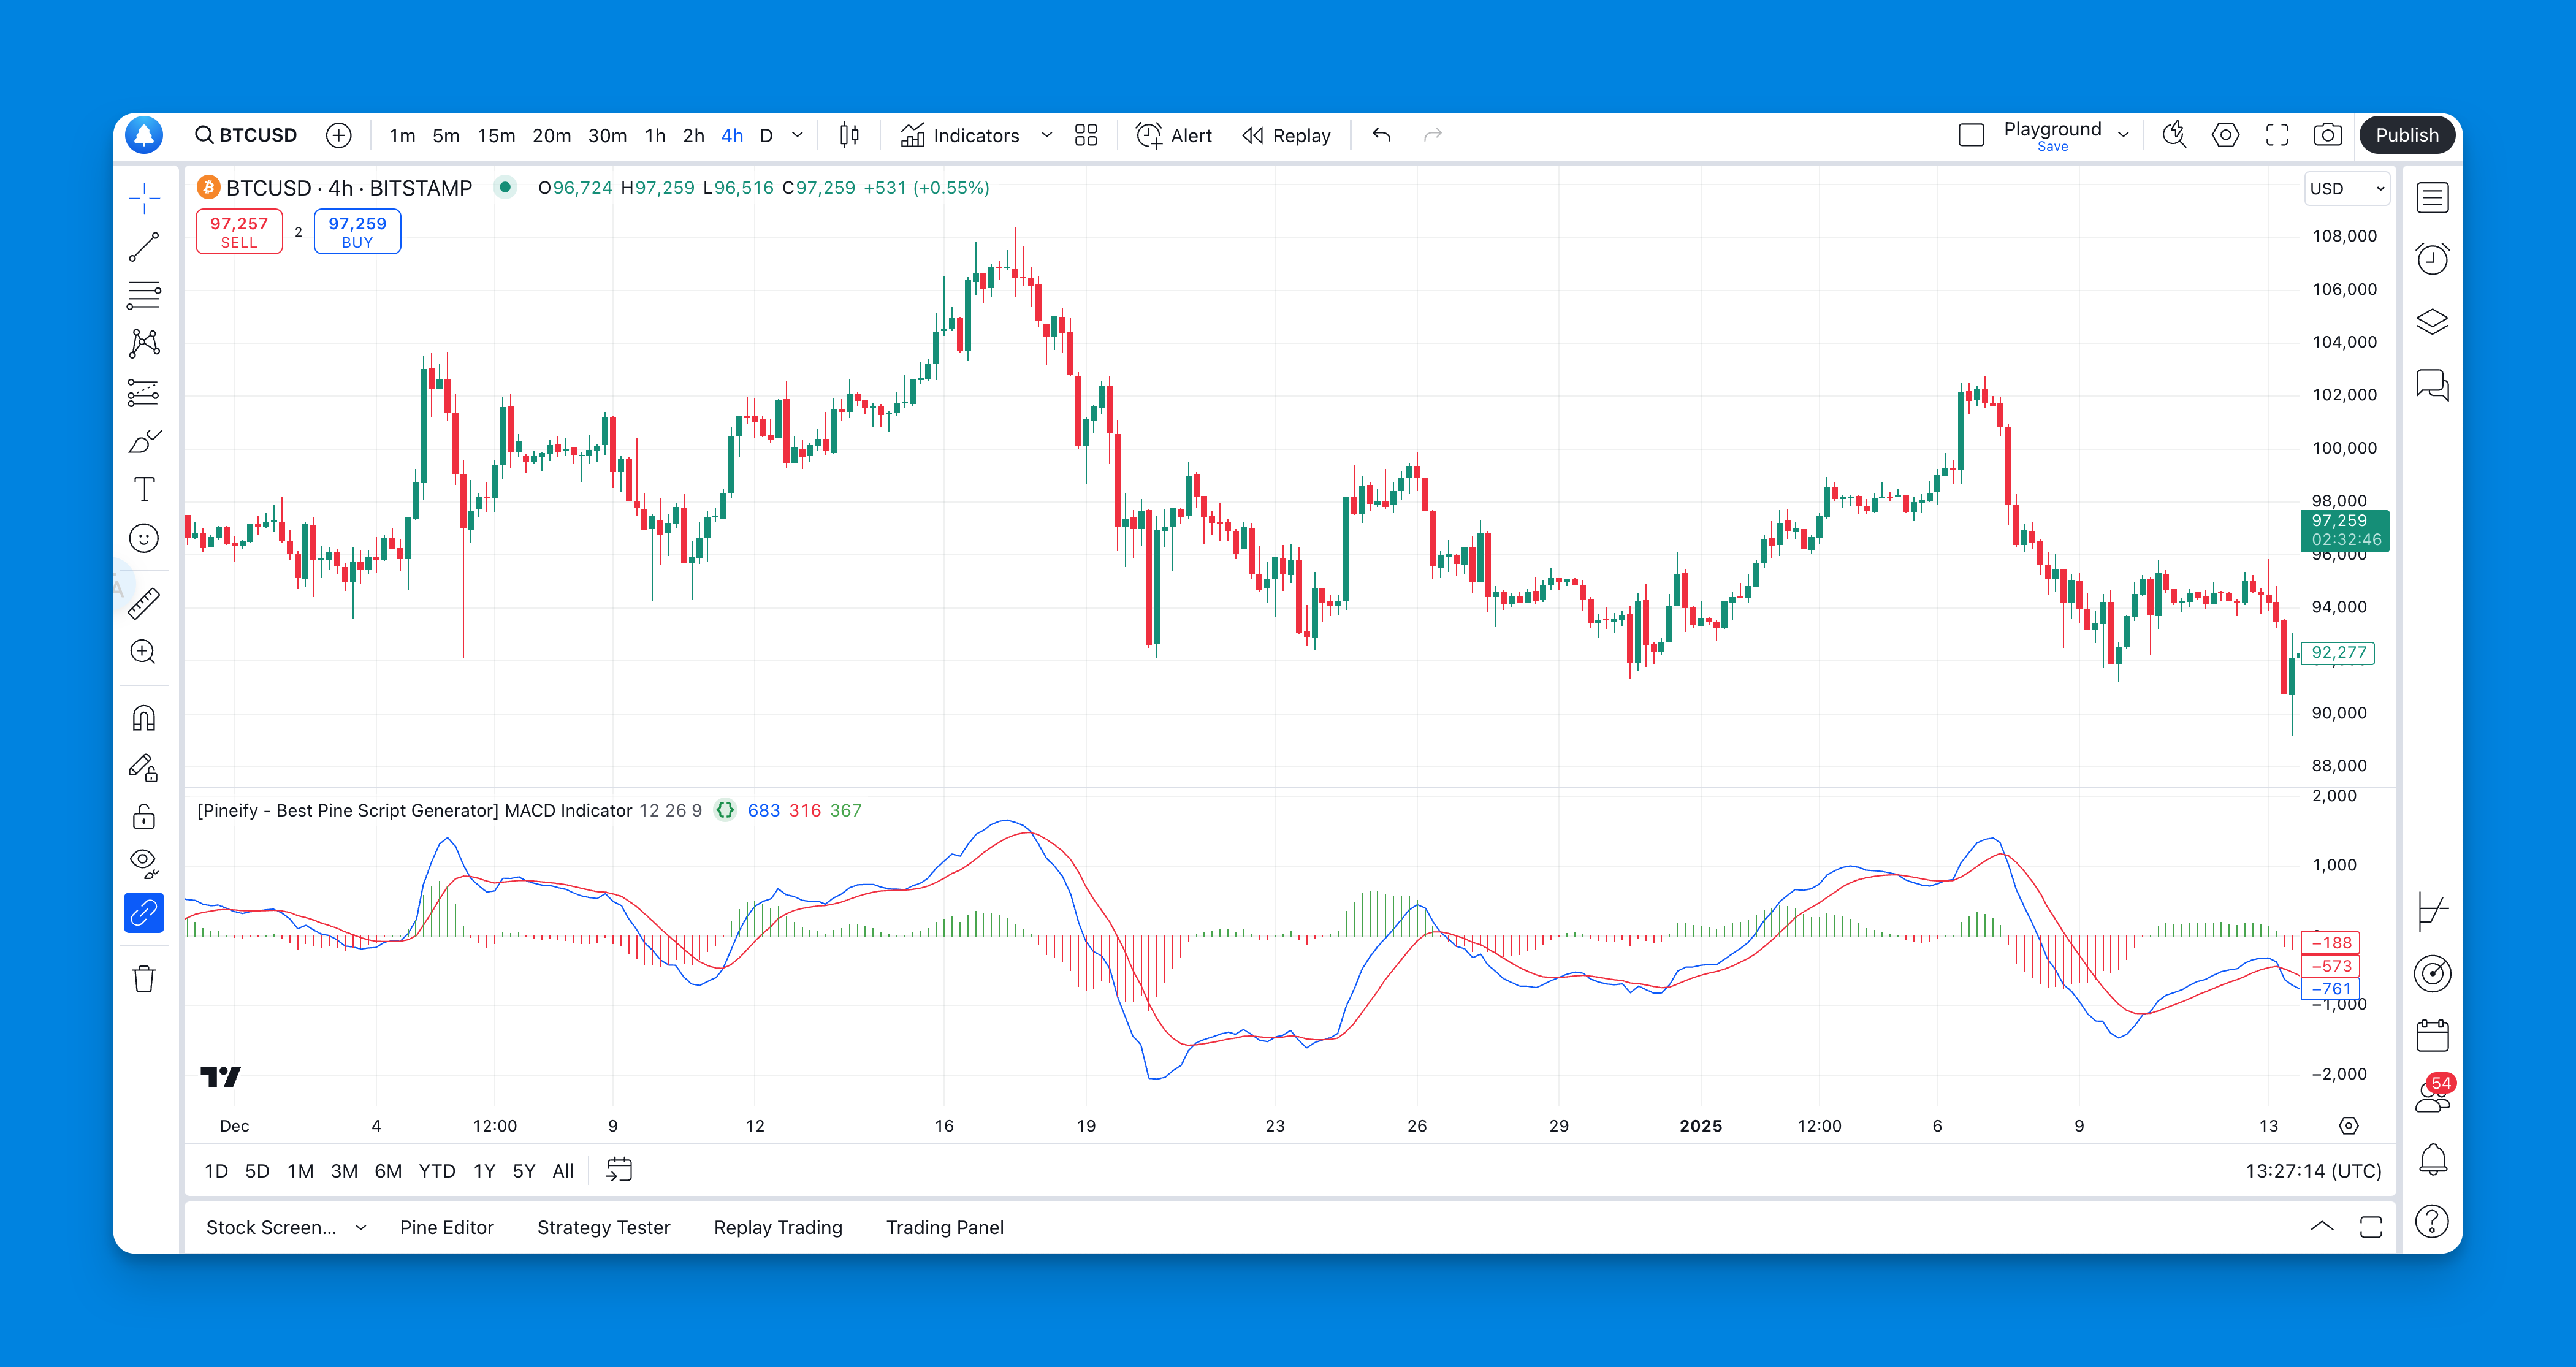
MACD, short for Moving Average Convergence Divergence, is a trend-following momentum indicator that tracks the relationship between two moving averages of price. Whether you're trading crypto, stocks, or forex, this indicator gives you a concrete signal instead of a gut feeling.
If you're brand new to Pine Script, don't worry — I'll walk you through everything step by step. You might want to bookmark this Pine Script tutorial for beginners too, since it covers the basics really well.