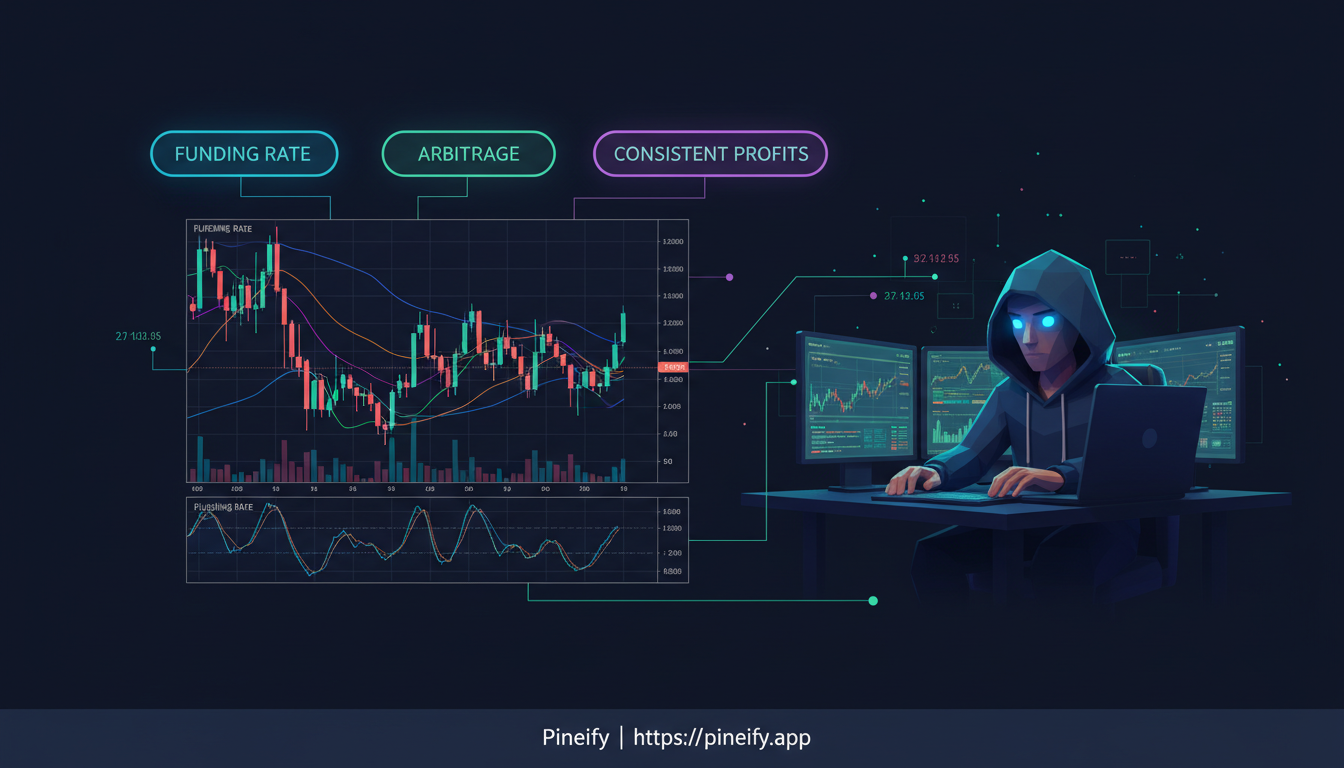
564 posts tagged with "TradingView"

Blog posts related to the TradingView

View All Tags

FX Replay Backtesting Guide: 500+ Forex Trades Tested

· 12 min read
Pineify Team
Pine Script and AI trading workflow research team

FX Replay is a forex backtesting platform that replays historical market data at adjustable speeds. I stumbled across it after burning through demo accounts for months, convinced my strategy "just needed time." Sound familiar?

I ran my first proper backtest the same week. The results were brutal. My "foolproof" EUR/USD scalping strategy would've lost me $3,200 over three months. But I learned more in those 30 minutes of backtesting than in six months of forward demo trading.

Multi Time Frame Candle TradingView: Read Higher Timeframes Instantly

· 15 min read
Pineify Team
Pine Script and AI trading workflow research team

Multi-timeframe candle analysis is a TradingView technique that overlays higher timeframe candles directly onto your current chart. I've been running this setup for about three years on ES futures and BTC/USD, and it filters out lower-timeframe noise better than anything else I've tried. You can watch a 5-minute chart while still seeing where the 1-hour candle is forming — no tab switching required.

Multi Time Frame Candle TradingView: Complete Analysis Guide

ATR Strategy Guide: Using Average True Range for Better Trading

· 16 min read
Pineify Team
Pine Script and AI trading workflow research team

You can study every chart pattern and indicator out there, but if you don't account for volatility, your stop-loss will get taken out before the trade even develops. Average True Range (ATR) is a volatility indicator created by J. Welles Wilder. It measures how much an asset's price moves over a set period — no direction, just the raw range. I use it to place stops and size positions based on what the market actually does. It's saved me from getting stopped out of good trades more times than I can count.

Master the ATR Strategy: Complete Guide to Trading with Average True Range

Donchian Channel Breakout Strategy: Rules That Actually Work

· 16 min read
Pineify Team
Pine Script and AI trading workflow research team

Struggling to spot trends early or catch those big market moves? Donchian Channels are a trend-following indicator built from three lines: the highest high over N periods, the lowest low over N periods, and the midpoint between them. They're designed to identify breakouts and ride momentum. Developed by Richard Donchian, this tool was used by the Turtle Traders to find success across stocks, futures, and forex markets.

Master the Donchian Channel Strategy: Complete Guide to Breakout Trading Success

Ichimoku Cloud Trading Strategy: Signals, Timeframes, and Pitfalls

· 14 min read
Pineify Team
Pine Script and AI trading workflow research team

The Ichimoku Cloud is a Japanese technical analysis system that bundles trend direction, momentum, and support-resistance levels into a single chart overlay. Five calculated lines work together - the most distinctive being a shaded "cloud" (Kumo) that projects support and resistance 26 periods into the future. I've been running Ichimoku on AAPL and BTC daily charts since late 2023, and it's the only indicator I keep on every chart I open. If you're tired of a cluttered chart with overlapping tools, this one's worth your time.

Developed in Japan in the 1960s, the Ichimoku Cloud (formally Ichimoku Kinko Hyo, meaning "a glance at a balanced chart") gives you a quick read on where the market has been, where it is now, and where it might head next.

Master the Ichimoku Cloud Trading Strategy: Your Complete Guide to This Powerful Indicator

KAMA Strategy: Kaufman's Adaptive Moving Average for Trend Trading

· 16 min read
Pineify Team
Pine Script and AI trading workflow research team

KAMA is an adaptive trend-following indicator created by analyst Perry Kaufman. Unlike standard moving averages that drag along at a fixed speed, KAMA adjusts its sensitivity based on current market volatility. It accelerates during strong trends and decelerates when price drifts sideways. I first tested KAMA on Apple's daily chart in early 2024 and was impressed with how it handled that range-bound January session, while a standard 50-day SMA kept whipsawing me. If you're comparing adaptive tools, the Uptrick indicator shows how responsiveness varies across different strategies.

Master the KAMA Strategy: Kaufman's Adaptive Moving Average for Enhanced Trading Performance

Moving Average Ribbon Strategy: Spot Trends and Time Entries

· 15 min read
Pineify Team
Pine Script and AI trading workflow research team

I used to trade with a single 20-period EMA and kept getting faked out on false breakouts. Then I stacked eight EMAs on my chart and the picture got a lot clearer. A Moving Average Ribbon is multiple moving averages with different periods plotted together on one chart. When they spread apart, momentum is strong. When they squeeze, it's fading. You can read the market's mood at a glance instead of guessing from one line.

Moving Average Ribbon Trading Strategy: Using Multiple Moving Averages to Read Trend Strength

Pineify EMA Strategy: TradingView Guide for Automated Signals

· 17 min read
Pineify Team
Pine Script and AI trading workflow research team

I've been trading with the Pineify EMA Strategy for months, and it's the closest thing to an automated edge I've found on TradingView. The Pineify EMA Strategy is a multi-timeframe system built on three Exponential Moving Averages — short, medium, and long. It waits until all three align before generating a signal. No coding required.

Master the Pineify EMA Strategy: Ultimate TradingView Guide for Automated Signals

Supertrend Strategy: Trend-Following Trading with ATR Signals

· 15 min read
Pineify Team
Pine Script and AI trading workflow research team

You're watching a stock drift sideways for hours. Then one candle closes above the Supertrend line, and the line flips from red to green. That's your signal. The Supertrend indicator is a trend-following tool that plots a dynamic band on your price chart using Average True Range (ATR). When price closes above the line, the trend is up. Below it, the trend is down. I've been using it on BTC/USD daily charts since late 2023, and it catches roughly 60% of major directional moves when paired with a basic volume filter.

Master the Supertrend Strategy: Your Complete Guide to Trend-Following Trading Success

Premium Pine Script Indicators for TradingView: What to Know

· 16 min read
Pineify Team
Pine Script and AI trading workflow research team

I built my first Pine Script indicator for Tesla (TSLA) back in early 2024. Ten lines of code gave me a moving average crossover alert I still use every week. Pine Script is TradingView's language for creating custom indicators, strategies, and screeners that run directly on live charts. It handles price, volume, and volatility across different timeframes with a fraction of the code you'd need in Python or JavaScript.


Master TradingView with Premium Pine Script Indicators | Complete Guide