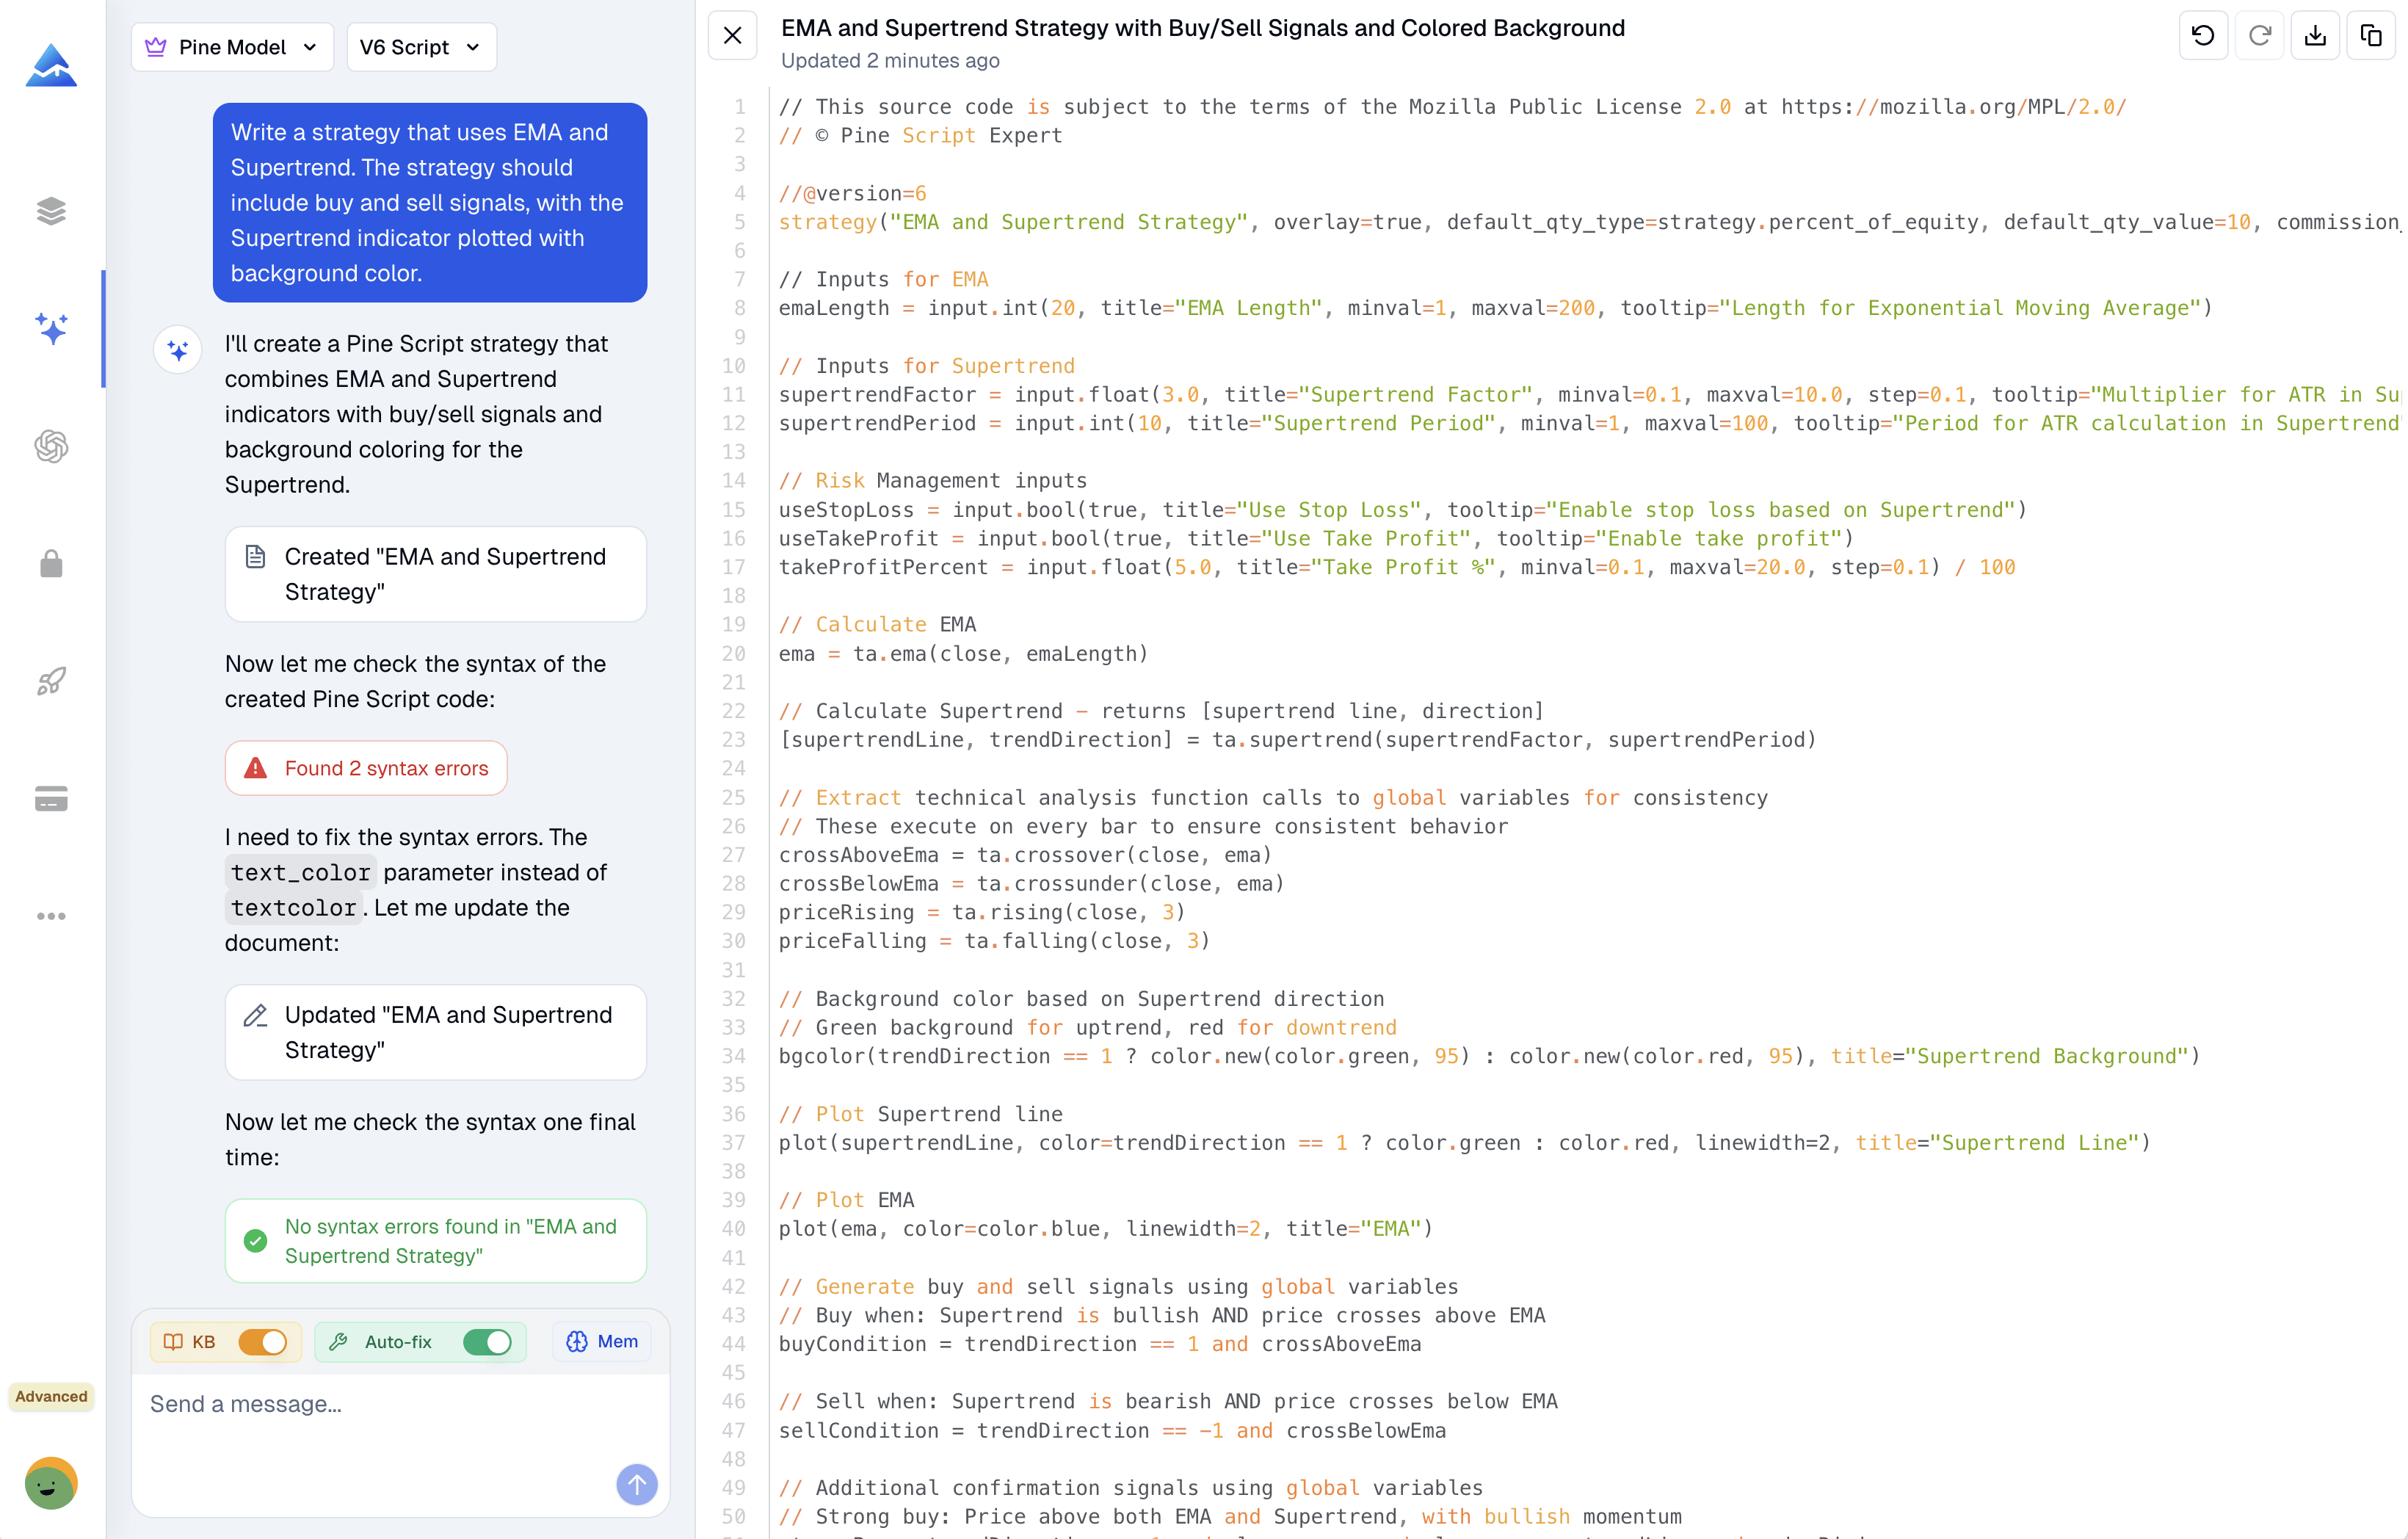
I've spent way too many hours staring at Pine Script errors in TradingView — a missing bracket, a runtime bug that only shows up on certain bars, or code that compiles but gives wrong signals on a live chart. A Pine Script AI coding agent is an AI tool built specifically to write, debug, and optimize Pine Script code for TradingView. It takes plain-English trading descriptions and turns them into working indicators and strategies. I've found this approach cuts my coding time by more than half. Tools like the one in Pineify's platform are making this the new normal for traders.
Most people who trade options end up losing money, often because they're going on a hunch instead of checking the facts. Free options backtesting changes that — it lets you test your trading idea against years of actual market history so you can see how it might play out before you risk real money. Whether you trade covered calls, iron condors, or 0DTE spreads, backtesting tells you if your strategy actually holds up.
Options backtesting is a method where you take a specific set of trading rules and run them through historical market data to measure performance. It's more involved than testing stocks because you have to factor in strike price and expiration selection, implied volatility (IV), time decay (theta), and the bid-ask spread that can eat into multi-leg trades.
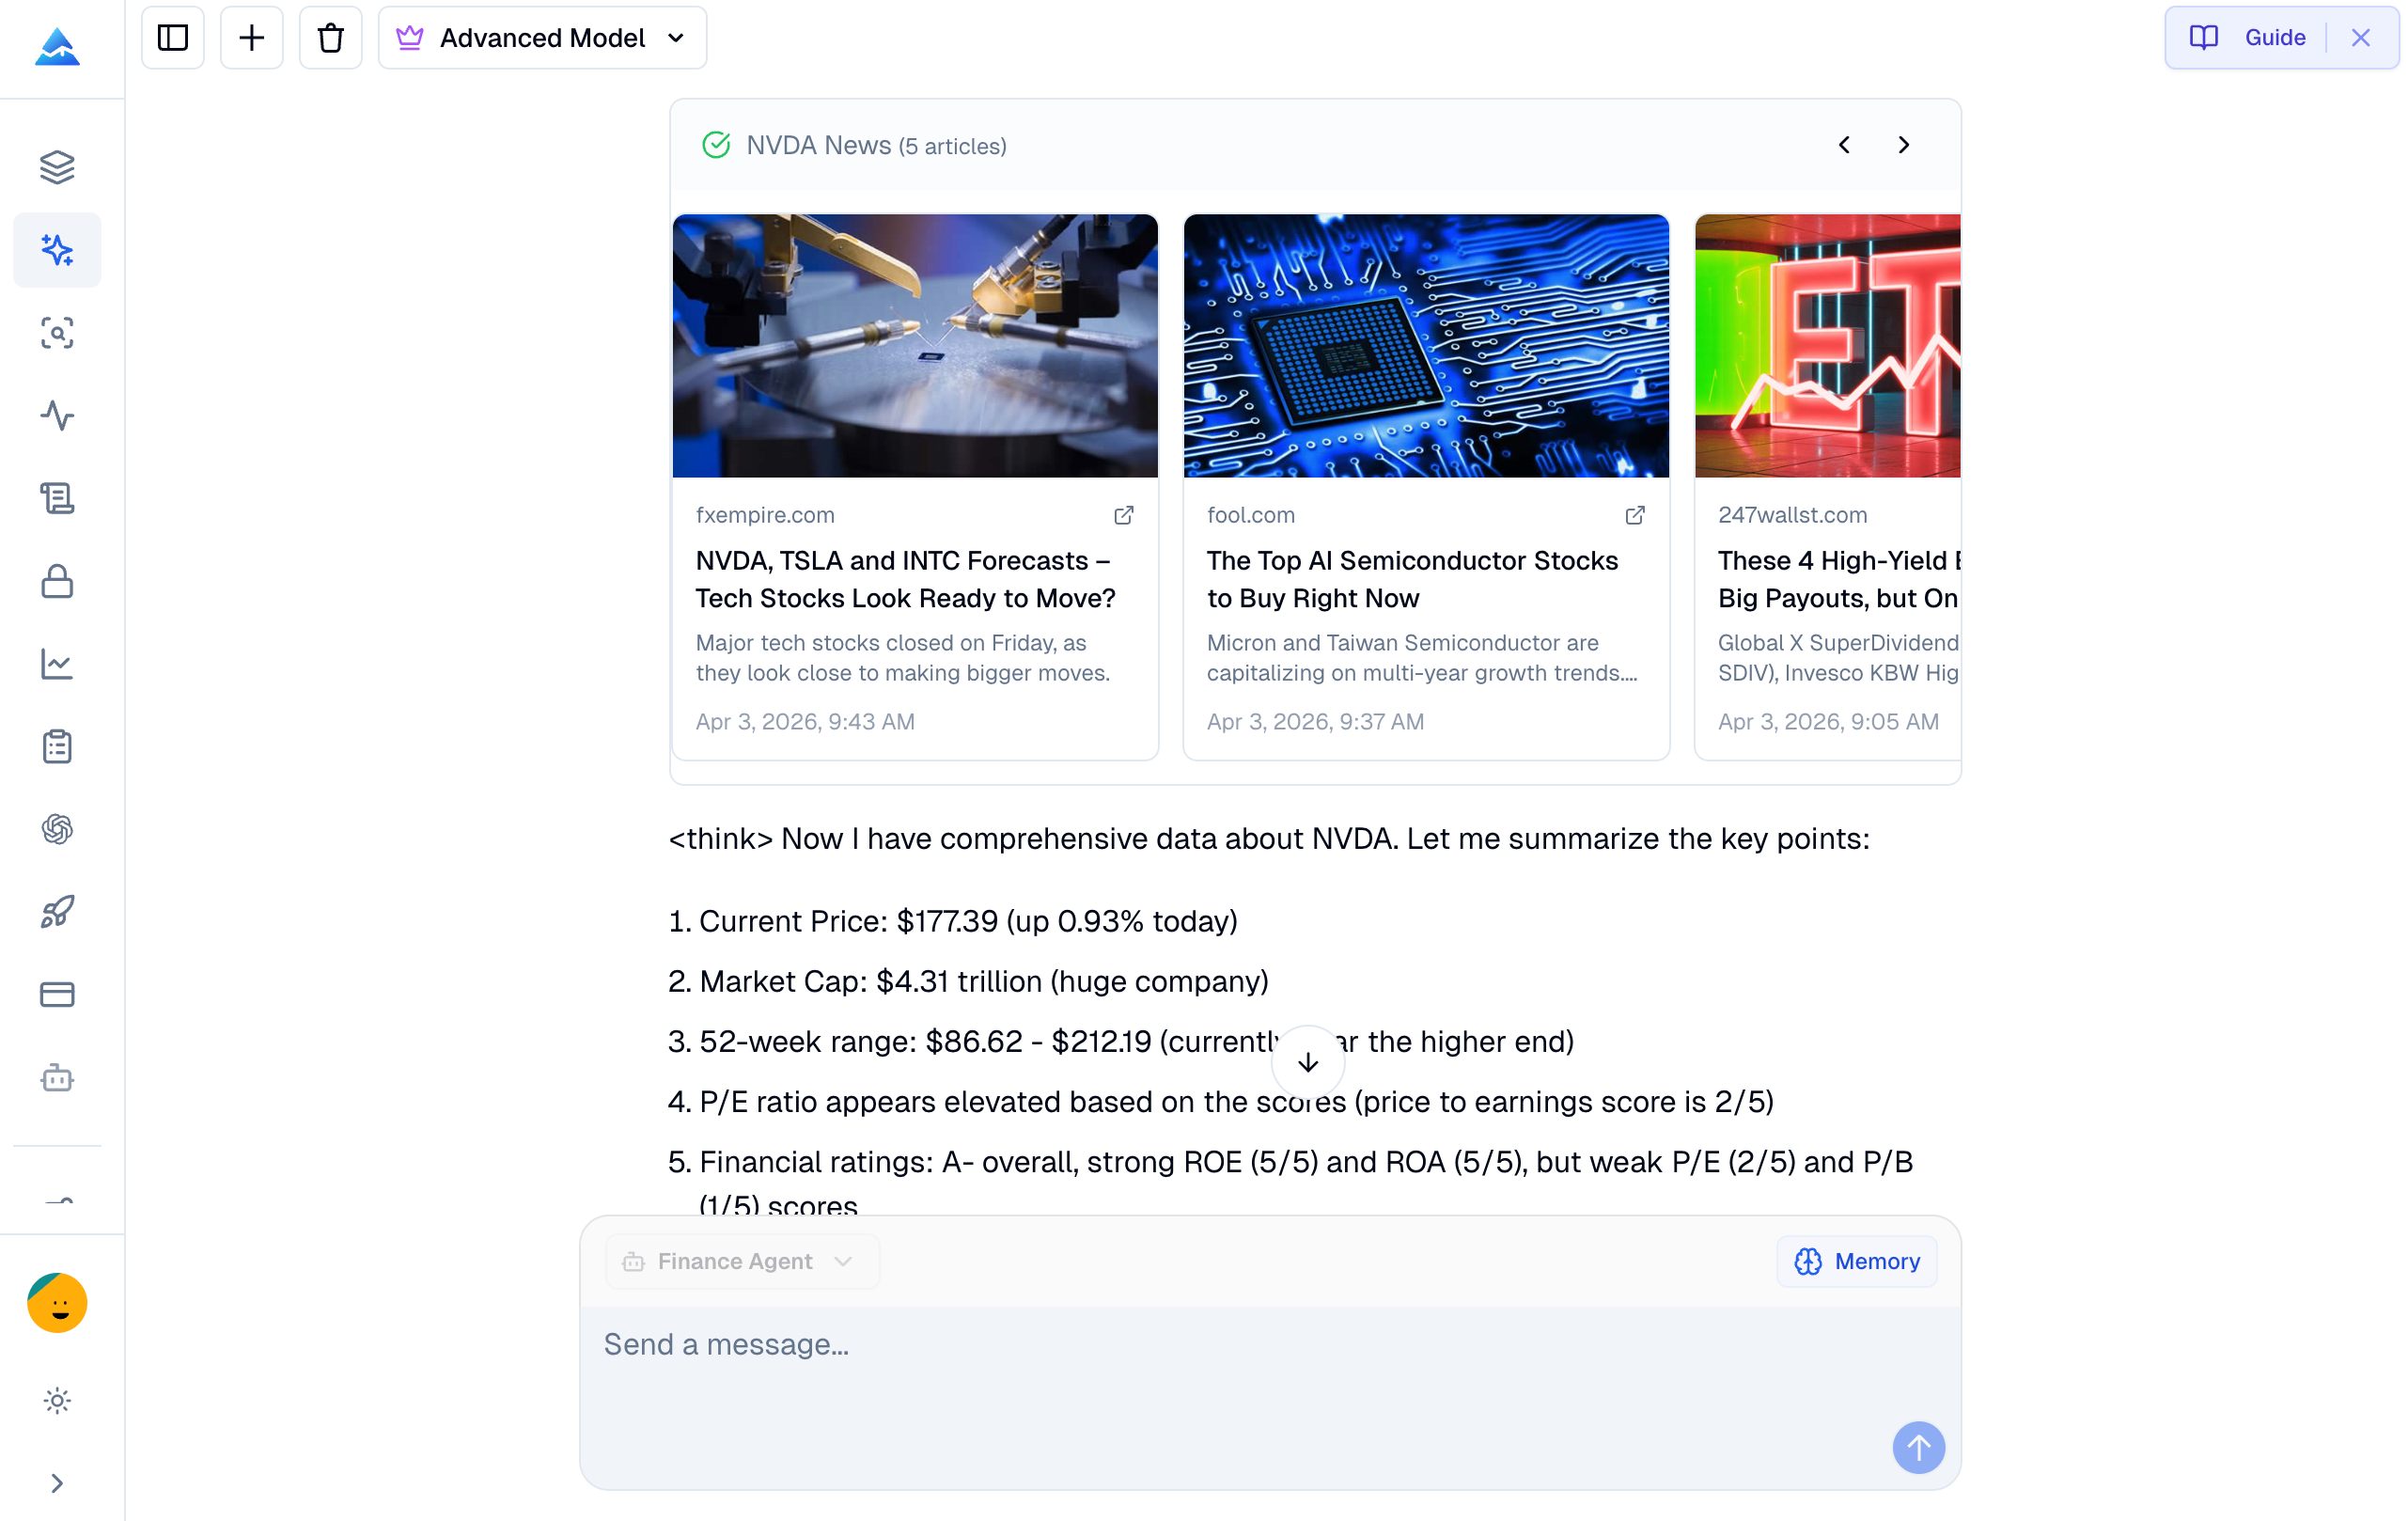
Pineify's AI Finance Agent is a financial research tool that pulls live market data instead of relying on stale training data. Ask a question in plain English — "What's Apple's current P/E ratio?" or "Show me NVDA revenue for the last 4 quarters" — and it fetches the numbers from professional data feeds in real time. No terminal, no Bloomberg subscription, no dropdown menus.
I've been using it to track TSLA options flow and compare QQQ sector allocations. It's not perfect — the sentiment analysis from social media can be noisy, and I've noticed it sometimes struggles with very niche OTC tickers. But for the $15,000+/year that Bloomberg costs, it's a solid alternative for individual traders.
If you've ever asked a general AI coding assistant for help with Pine Script, you know the drill. It gives you code that seems right. It might even pass a basic syntax check. But the moment you paste it into TradingView, it falls apart. That's because tools built for Python or JavaScript weren't made for Pine Script's unique world. The difference between code that looks correct and code that actually works in a live chart can mean hours of tweaking and debugging.
A congressional trading viewer is a tool that tracks stock trades made by U.S. lawmakers and their families, sourced from mandatory STOCK Act filings. Members of Congress sit on committees that shape policy in the same industries where they invest. I've seen this play out with specific names—like when multiple defense committee members filed NVDA buys in Q3 2024, just before a major military AI contract was announced. The law requires disclosure within 45 days, but raw filings from the House and Senate are scattered and hard to parse. That's the gap Pineify Market Insights fills—it pulls that data together with options flow, dark pool trades, and sector sentiment in a single view. For traders building automated systems around these signals, our TradingView algorithms guide covers the setup.
Pineify's AI Finance Agent delivers real-time market data, SEC filings, options chains, and social sentiment tracking through natural language chat. At $259 lifetime access versus Bloomberg Terminal's $24,000+ per year, it's the practical choice for independent investors who want professional-grade research without the institutional price tag.
An AI trading strategy is any rule-based system that uses machine learning, natural language processing, or algorithmic logic to make buy and sell decisions. I've been testing these approaches since early 2025, and the gap between traders who use AI tools and those who don't is wider than most people realize. You don't need a CS degree to get started — just a clear idea of what you're trying to achieve and the right tool.
Knowing when the trend has actually flipped—instead of chasing noise—is one of the hardest parts of trend trading. I've found the HalfTrend (HT) indicator useful for that. It draws a single trend line that switches between support and resistance, plus an ATR-based channel around it, and it marks Buy and Sell only when the internal trend state changes. That keeps signals clear and avoids the clutter of many overlapping lines.
HalfTrend uses the Average True Range (ATR) and a short lookback (amplitude) to decide when price has broken the current structure. When the trend flips from down to up, you get a Buy signal and the line turns into support (often shown in blue); when it flips from up to down, you get a Sell signal and the line acts as resistance (often shown in red). The ATR High and ATR Low bands form a ribbon that shows the channel around the trend line. After testing it on BTCUSD daily and 4H timeframes for about four months, I prefer Amplitude 3 over the default 2 — it produced fewer false flips on that pair. I use HalfTrend mainly as a trend filter and for reversal entries when the arrow and Buy/Sell label appear.
TradeStation is a full-service brokerage and trading platform with built-in backtesting through its EasyLanguage scripting environment. Pineify's Backtest Deep Report is a browser-based analytics tool that imports CSV trade data from TradingView and runs risk metrics like Monte Carlo simulation, Sharpe ratio, and value-at-risk analysis. I've tested over 200 strategies on AAPL and SPY alone, and the difference between a basic backtest and a proper risk analysis is the difference between confidence and gambling.
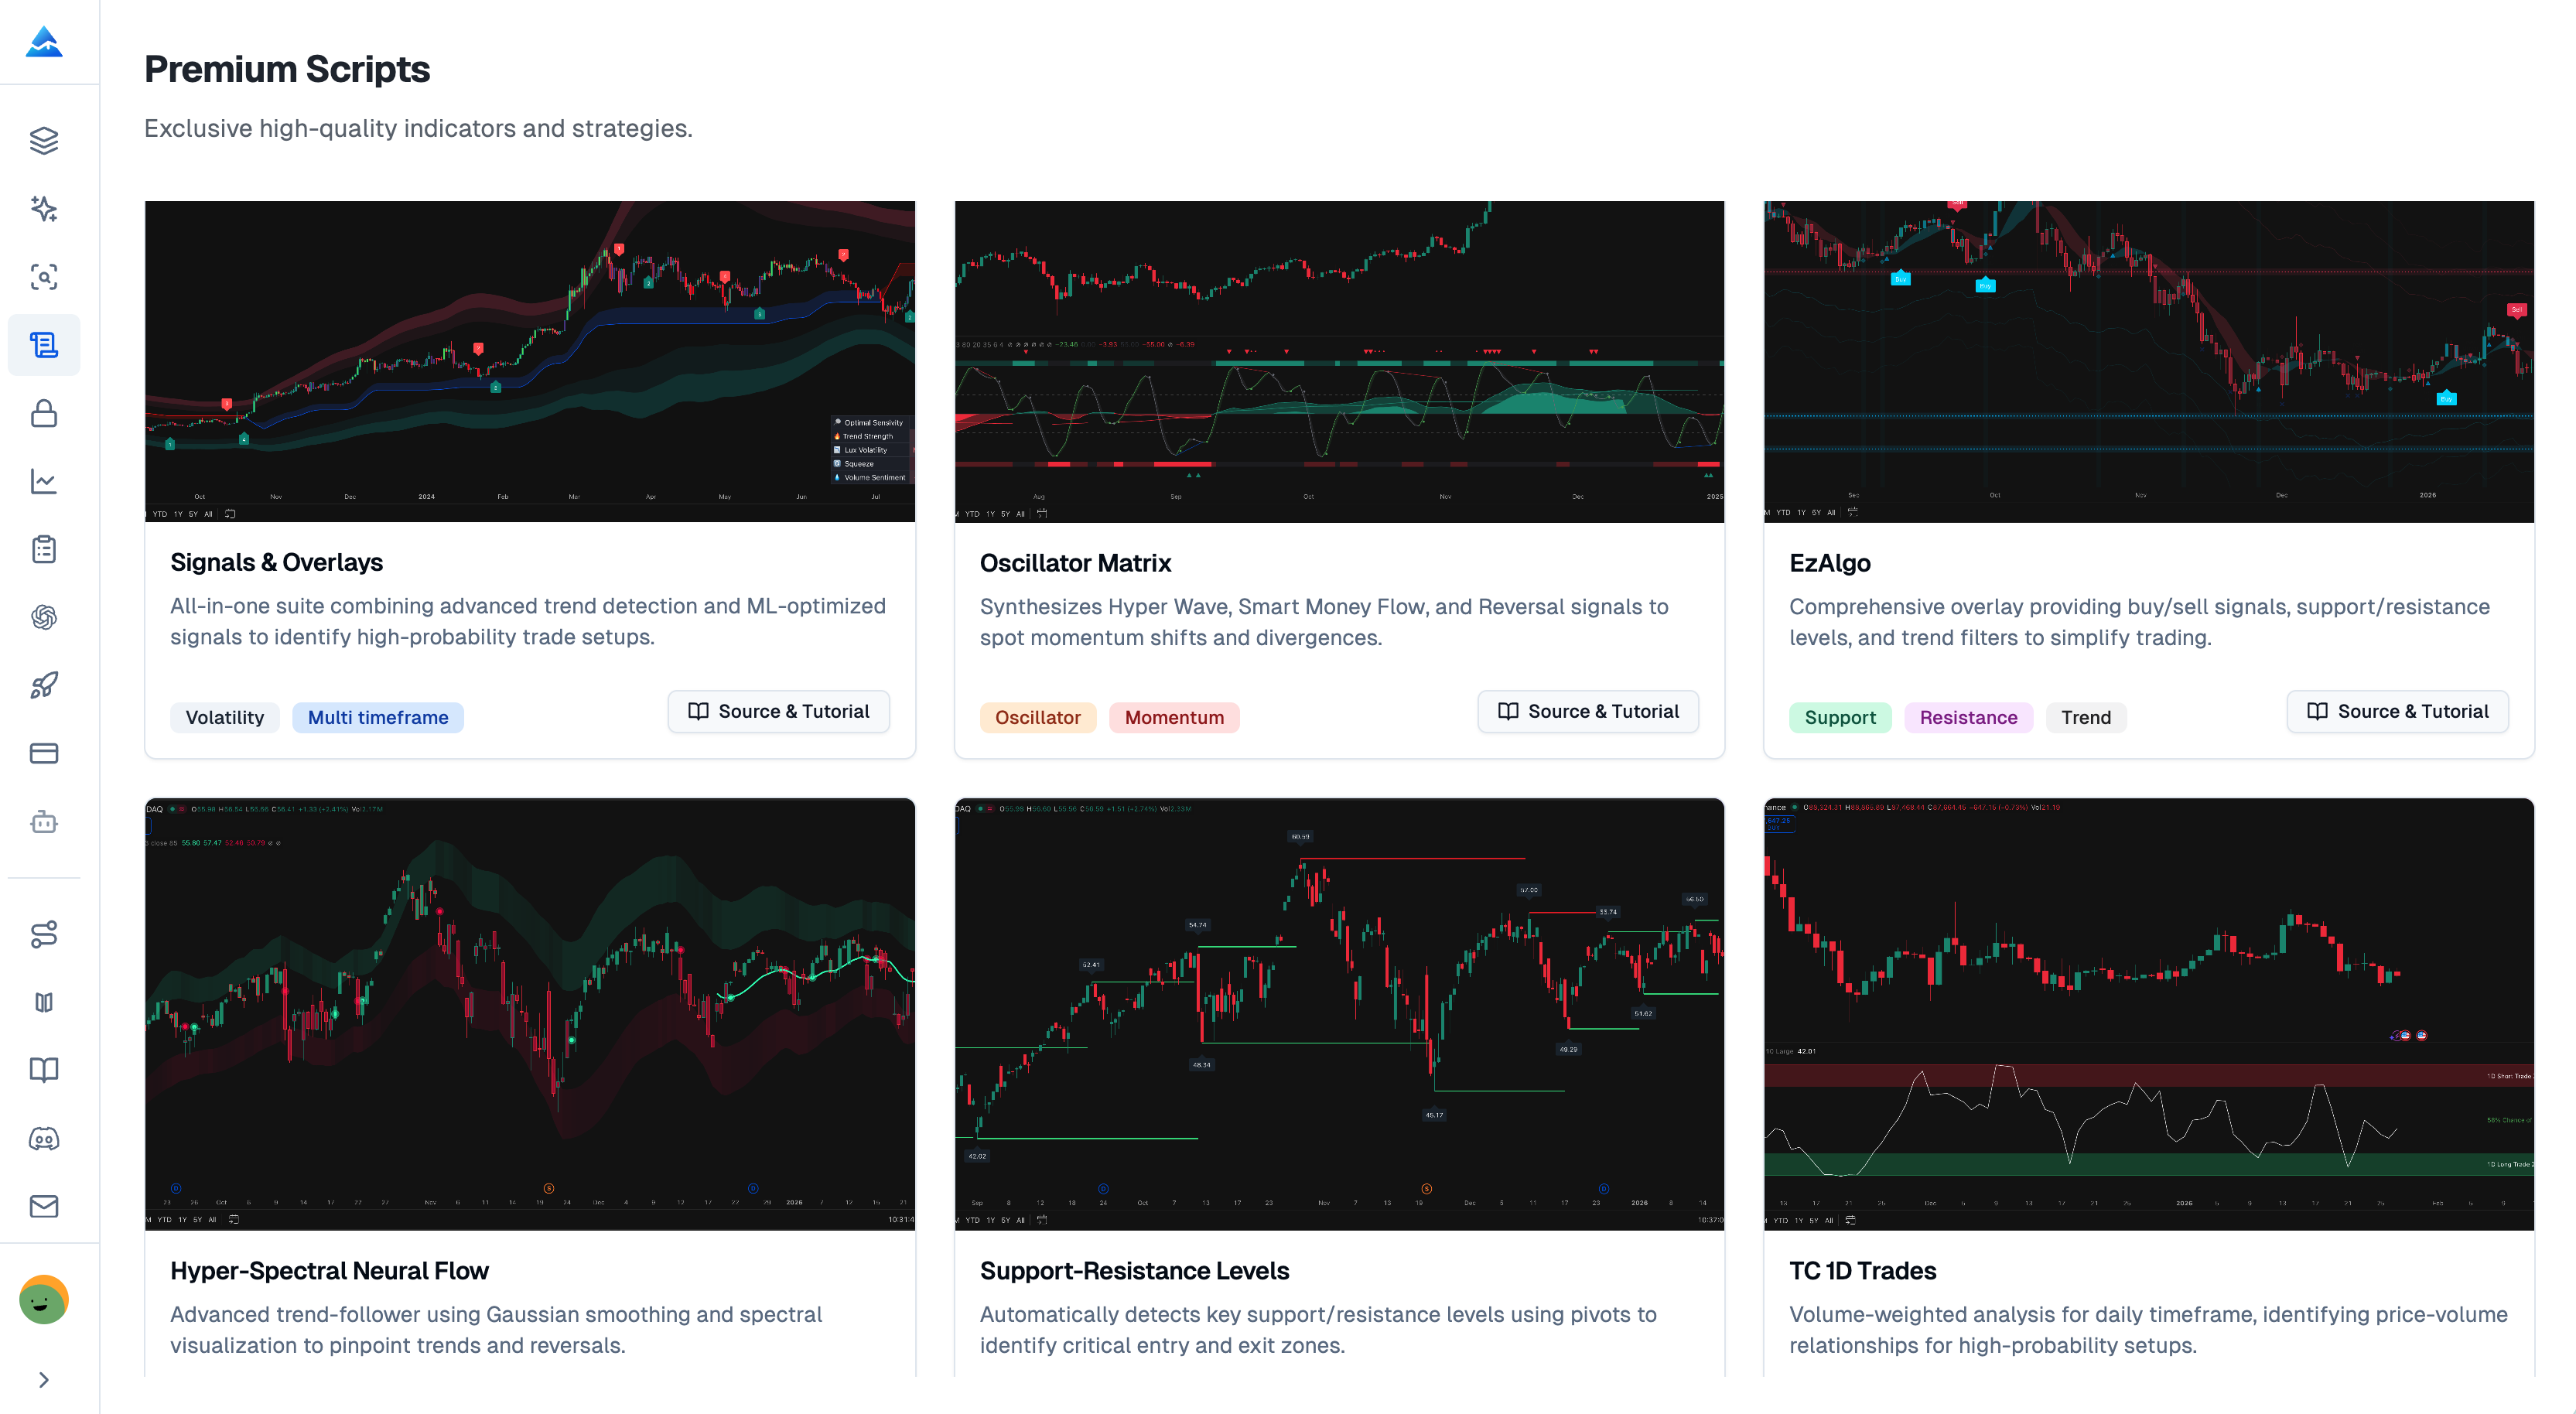
TradingView indicator marketplace alternatives are curated platforms that offer premium Pine Script tools outside the public library. Pineify Premium Scripts is the strongest option for traders who want full source code access and one-time pricing. LuxAlgo, Zeiierman, BigBeluga, and Flux Charts each serve different trading styles, but none match Pineify's combination of transparency and lifetime value.