MT5 Fibonacci Indicator: Setup Guide & Trading Strategies
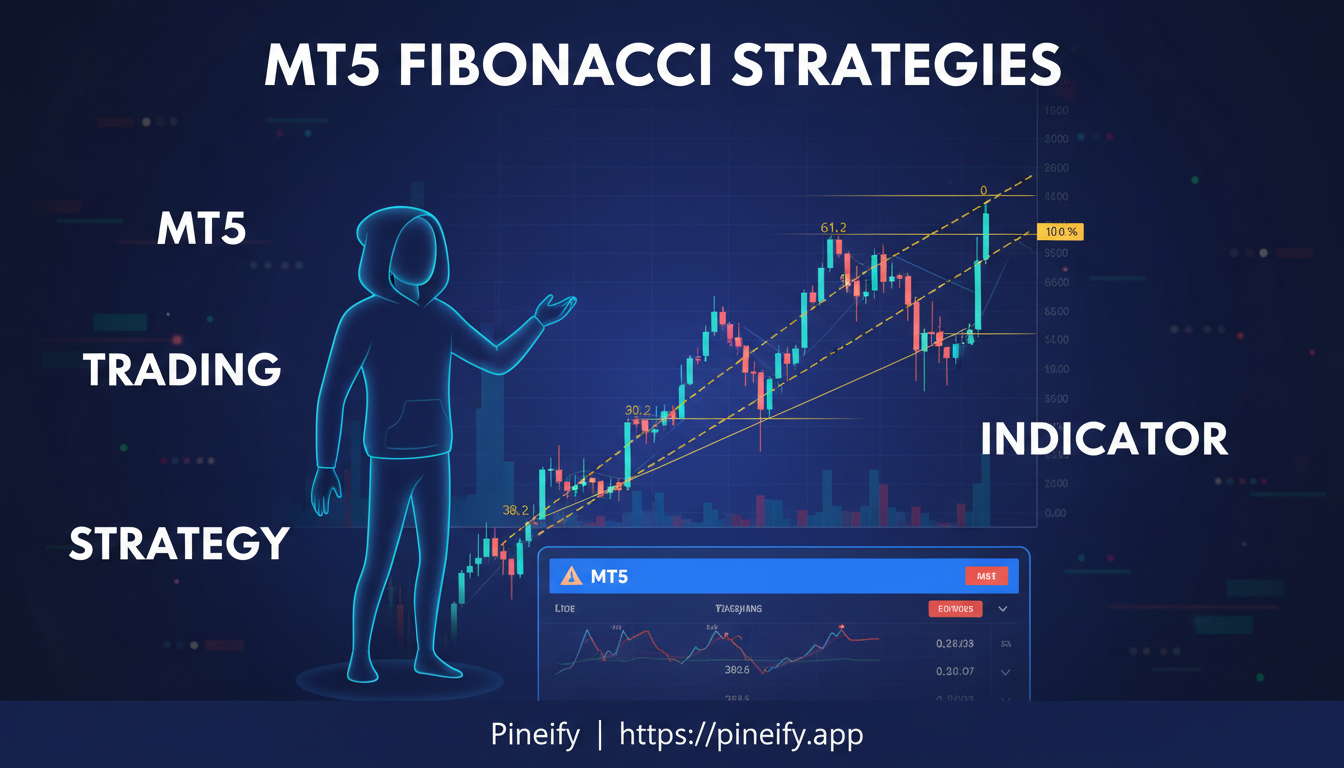
The MT5 Fibonacci indicator is a built-in MetaTrader 5 charting tool that uses Fibonacci sequence ratios to mark out potential support and resistance levels where price tends to reverse or pause. It draws horizontal lines at key percentages like 23.6%, 38.2%, and 61.8% between two selected swing points. Whether you're new to chart analysis or you've been trading for a while, knowing how to set this tool up properly can tighten up your entries and exits.
What Is the MT5 Fibonacci Indicator?
MetaTrader 5 comes with a full set of Fibonacci-based drawing tools already installed. You don't need to add anything extra. These include Fibonacci Retracement, Expansion, Fan, Arcs, Time Zones, and Channel. You'll find them all under Insert → Objects → Fibonacci in the menu.
The concept goes back to a 13th-century mathematician named Leonardo Fibonacci. When you draw a Fibonacci Retracement line between two extreme price points — like a swing low to a swing high — MT5 automatically adds horizontal lines at nine key levels: 0.0%, 23.6%, 38.2%, 50%, 61.8%, 100%, 161.8%, 261.8%, and 423.6%. These aren't random numbers. They come from the Fibonacci sequence. And here's the thing: many traders watch these levels closely because price often reacts around them, almost like invisible magnets where buyers and sellers tend to show up.
The Six Core Fibonacci Tools in MT5
MT5 doesn't limit you to just one Fibonacci tool — there are six, each with a different job. Here's what each one does:
| Tool | Primary Use |
|---|---|
| Fibonacci Retracement | Measure pullbacks within a trend; find support/resistance |
| Fibonacci Expansion | Project price targets beyond the original move |
| Fibonacci Fan | Draw diagonal support/resistance lines from a trend pivot |
| Fibonacci Arcs | Combine price and time zones in arced levels |
| Fibonacci Time Zones | Identify potential turning points in time, not just price |
| Fibonacci Channel | Apply Fibonacci ratios to channel-based price structure |
Every tool has its own purpose. Experienced traders often layer two or three together to get a stronger signal before entering a trade.
How to Draw Fibonacci Retracement in MT5
The Fibonacci Retracement is one of the most popular tools for spotting potential support and resistance levels. Here's how to draw it correctly in MetaTrader 5 — step by step.
For an Uptrend
- Go to Insert → Objects → Fibonacci → Retracement.
- Click on the swing low — the lowest point where the uptrend began.
- Hold your mouse button and drag the cursor to the swing high — the highest point of the move.
- Let go — MT5 draws all the Fibonacci levels for you automatically.
For a Downtrend
- Click on the swing high — where the downtrend started.
- Drag down to the swing low — the most recent bottom.
- Release your mouse button, and the levels appear.
Quick tip: the Fibonacci retracement tool works best when the market is clearly trending in one direction. Avoid using it when prices are moving sideways or choppy — those signals tend to be unreliable and can lead to bad trades. I've seen this happen on EUR/USD daily charts more than a few times — drawing Fibonacci in a range just gave false signals.
Understanding the Key Fibonacci Levels
Not all Fibonacci levels are created equal. Some matter a lot more than others when you're trying to make a decision. Here's the breakdown:
- 23.6% – A very shallow pullback. It tells you the trend is strong and not slowing down.
- 38.2% – A moderate dip. This is a common spot to hop in when the trend is solid.
- 50.0% – Not actually a true Fibonacci number, but traders watch it closely because it's a psychological round number. I've watched XAU/USD bounce off this level on the H1 chart at least a dozen times in the past month alone.
- 61.8% – The Golden Ratio. This is the big one — the most reliable level for reversals.
- 78.6% – A deep retracement. It's basically the last stop before the trend breaks down completely.
- 100% – A full retracement back to where the move started.
The 61.8% level is the star of the show. It comes from dividing a Fibonacci number by the next one in the sequence (like 34 divided by 55). When price bounces off this level during a trend, it's one of the highest-probability setups you'll find in technical analysis. If you're exploring other oscillator-based strategies, check out this guide on the Price Momentum Oscillator strategy for additional momentum confirmation.
Auto Fibonacci Indicator for MT5: Work Smarter
Manually drawing Fibonacci levels on every chart takes time. The Auto Fibonacci Indicator for MT5 finds swing highs and lows automatically and plots all the key levels in real time.
Take the Free Automatic Fibonacci indicator from MQL5.com. It draws retracement levels based on a setting called BarsToScan (you can adjust how many bars it looks at), updates instantly when new highs or lows appear, and lets you change colors and which levels to show. Some auto-draw versions — like the ZigZag-based one — can even draw Fibonacci Retracement, Expansion, and Fan all at once, without you needing to pick a starting or ending point.
How to install a custom Auto Fibonacci indicator:
- Download the
.ex5or.mq5file from a trusted source like MQL5.com - Open MT5 → File → Open Data Folder
- Navigate to MQL5 → Indicators and paste the file
- Restart MT5
- In the Navigator panel, right-click Indicators → Refresh
- Drag the indicator from the Navigator onto your chart
Build Smarter Strategies — No Coding Required
If you love automating your trading workflow, you'll love Pineify — the 10-in-1 AI trading workspace trusted by 100K+ traders worldwide. While MT5 indicators handle Fibonacci levels, Pineify lets you go a step further: generate custom Pine Script indicators and strategies with AI, analyze stocks with predictive scores, track options flow and dark pool activity, and keep a trading journal — all from one dashboard. No coding needed. Pay once, use forever.

Build your edge today at Pineify.app
Customizing Fibonacci Levels in MT5
One of the handiest features in MT5 that a lot of folks don't realize is hiding in plain sight — you can tweak exactly which Fibonacci levels show up on your chart. It's easy once you know where to look. Here's how:
- Draw the Fibonacci tool on your chart like you normally would.
- Right-click right on that Fibonacci line.
- From the menu, choose Properties (it might say "Properties of Fibonacci Retracement").
- A window opens — click the Levels tab.
- Now you can add new levels, remove ones you don't need, or edit existing ones. Just type in any ratio value and give it a custom label.
- While you're at it, you can change the color, line thickness, and whether it's solid, dashed, or dotted.
A lot of traders add the 78.6% level because MT5 doesn't include it by default. That level is actually the square root of 61.8%, and it often acts as a final support or resistance before the full trend flips around. You can also throw in extension levels like 127.2%, 161.8%, and 261.8% — those can help project where price might go beyond the 100% swing.
Fibonacci Extension Levels: Projecting Price Targets
Fibonacci retracement levels help you figure out where to get in on a trade. But once you're in, you need to know where to take profit. That's where Fibonacci extension levels come in. They project possible price targets beyond the current move, giving you clear zones to aim for.
The most commonly watched extension levels are 123.6%, 138.2%, 161.8%, and 261.8%. Among them, the 161.8% extension is considered the "golden extension" by many traders — it's often the first major target after a strong move. I've used the 161.8% as my take-profit on NAS100 4-hour setups for the last six months, and it catches the bulk of the move more often than not.
Here's how to draw a proper Fibonacci Expansion (a three-point extension) in MT5:
- Point A – Swing Low (where the move started)
- Point B – Swing High (where the initial impulse ended)
- Point C – Retracement Low (where price pulled back to after the impulse)
Once you connect those three points, MT5 automatically calculates the projected price based on the ratio between the initial move and the retracement. The tool then plots those extension levels as possible future price targets.
A quick tip: Extensions work best when the initial move is clean and the retracement doesn't go too deep. If price pulls back more than 61.8%, the extension targets become less reliable. Stick with trends that show strong momentum for the most accurate projections.
Proven MT5 Fibonacci Trading Strategies
Strategy 1: Fibonacci Bounce with Candlestick Confirmation
Here's a common setup: you see the market in an uptrend, price pulls back, and you want to catch it before it continues higher. Wait for price to drop into the 38.2%–61.8% retracement zone. Don't jump in right away — look for a bullish reversal candlestick pattern, like a hammer, engulfing, or pin bar. That's your green light. Place your stop-loss just below the 78.6% level, and aim for the previous swing high or a Fibonacci extension level as your target.
I tested this exact bounce strategy on GBP/USD across 30 trades on the 1-hour chart, and the setups that lined up with a hammer candlestick at 61.8% won nearly 70% of the time.
Strategy 2: Golden Zone Confluence
Traders often call the area between 50% and 61.8% the "Golden Zone." When price bounces there, it tends to hold well. But the real edge comes when that zone lines up with something else — a trendline, a moving average, or a former support/resistance level. The more confluences you have at a single Fibonacci level, the better your odds. For additional confluence ideas, learn how to use the KAMA strategy — Kaufman's Adaptive Moving Average can help confirm trend direction alongside Fibonacci levels.
Strategy 3: Fibonacci + Extension Targets
Once you've taken a trade off a retracement, you need a target. This strategy uses the 161.8% Fibonacci extension as your take-profit level. It works best on daily and 4-hour charts, especially for swing trading in Forex, indices, and commodities. Simple, clean, and backed by plenty of market examples.
Best Practices for Using the MT5 Fibonacci Indicator
- Start by drawing your Fibonacci from a clear, important swing — if you pick a minor price fluctuation, the levels you get won't be reliable. Look for a swing that really stands out on the chart.
- Check multiple timeframes — when Fibonacci levels line up on both the H4 and Daily chart, those levels carry a lot more weight. It's like getting a double confirmation.
- Pair it with volume or RSI — imagine price pulls back to the 61.8% level and RSI shows an oversold condition at the same time. That combo creates a high-probability setup worth paying attention to.
- Don't lean on Fibonacci by itself — treat it as a tool to add confidence alongside other signals, not as a magic indicator that predicts everything on its own.
- Adjust based on what the market is doing — in a strong trend, price often bounces off shallower levels like 23.6% or 38.2%. In a weaker trend, you'll see deeper retracements to 61.8% or even 78.6%. Always consider the bigger picture.
Q&A: MT5 Fibonacci Indicator
Q: Does MT5 come with an automatic Fibonacci indicator built in?
MT5 has manual drawing tools for Fibonacci right out of the box. If you want an indicator that automatically spots the swings and draws the levels for you, you'll need to grab a free or paid third-party Auto Fibonacci indicator from MQL5.com or another marketplace.
Q: Which Fibonacci level matters most in MT5?
The 61.8% retracement — often called the Golden Ratio — is the big one. Price tends to reverse or find strong support or resistance here more often than at any other level. That's why most traders keep a close eye on it.
Q: Can I add the 78.6% Fibonacci level in MT5?
Sure. Just right-click your Fibonacci line, go to Properties → Levels, then add 0.786 as a new level. You can also pick its color and label exactly how you like.
Q: Which Fibonacci tool should I use to set price targets?
Use the Fibonacci Expansion tool (the one that needs three points) to project where price might go after a retracement. The most common target levels are 127.2%, 138.2%, and 161.8% beyond the initial move.
Q: Does the Fibonacci indicator work on all timeframes?
Absolutely — Fibonacci retracement levels work on any timeframe, from 1-minute charts for scalpers all the way to monthly charts for long-term investors. Levels drawn on higher timeframes like daily or weekly tend to be more respected by the market.
Q: Should I trade every Fibonacci level I see?
No, that's a quick way to lose money. Only trade a Fibonacci level when it lines up with something else — like a moving average, a prior support or resistance zone, a trendline, or a momentum signal. Without that extra confirmation, Fibonacci levels are just lines on a chart.
Next Steps: Take Your Fibonacci Trading Further
Alright, so now that you know how to set up and use the MT5 Fibonacci indicator, let's put it to work with some real practice:
-
Open MT5 and find three recent strong trends in a market you like — forex, gold, or indices. Draw Fibonacci retracements on each one, then watch how price behaves when it hits those levels. You'll start seeing patterns pretty quickly.
-
Download a free Auto Fibonacci indicator from MQL5.com. Once you have it, compare the levels it draws automatically with the ones you drew by hand. It's a great way to check if you're doing it right and save time later.
-
Add the 78.6% level to your default Fibonacci settings — just open the Properties panel and add it. You might be surprised how often price turns around right there. It's a hidden gem a lot of traders overlook.
-
Backtest a "Golden Zone" strategy using the MT5 Strategy Tester. Run it on at least 50 historical trades to see how well your setup holds up. The numbers will tell you if it's worth trading live.
-
Join the MQL5 community forum and check out the Fibonacci Expert Advisor scripts other traders share. Some of them can automatically alert you when price hits key Fibonacci levels, which means less time staring at charts.
The Fibonacci tool in MT5 is more than just a drawing tool — it helps you see how markets move in a structured, repeatable way. Spend some time studying it, and you'll notice just how often price respects those levels. That kind of insight can help you across any market or timeframe, whether you're day trading or swinging for longer moves. If you ever need to port your MT5 strategies to other platforms, this Pine Script to MQL4 converter guide provides a helpful bridge between TradingView and MetaTrader ecosystems.