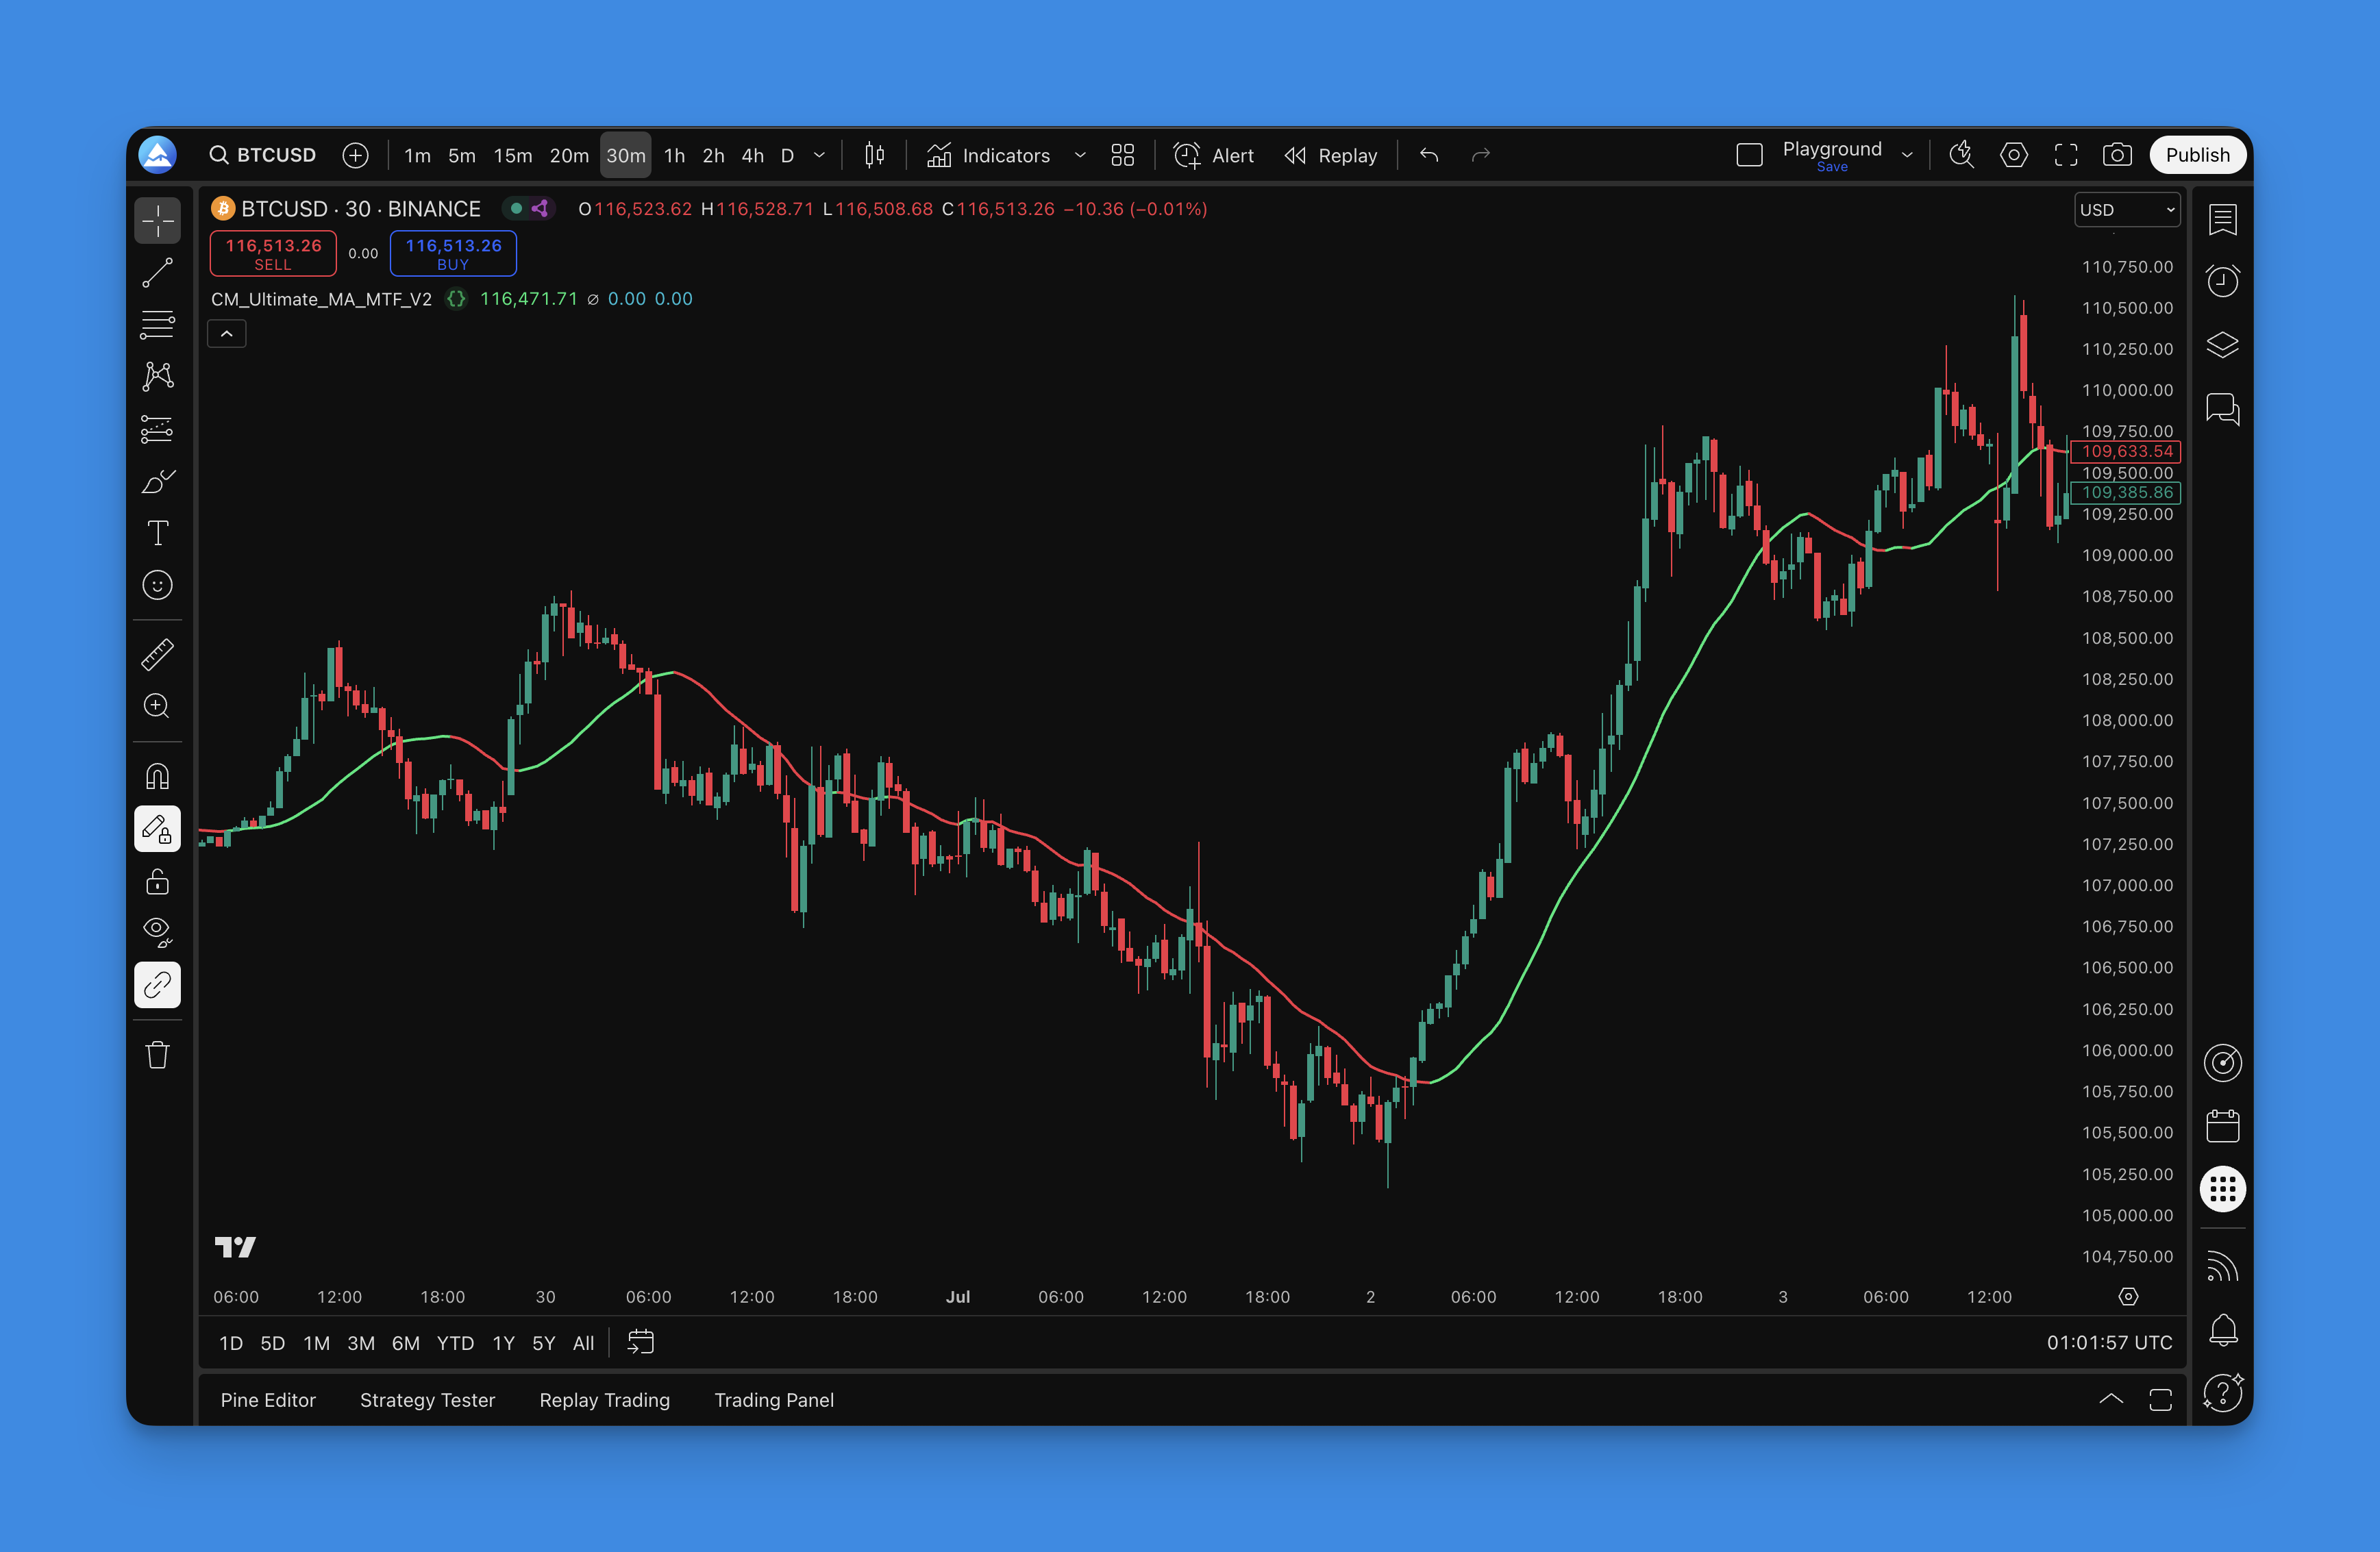
Williams VIX Fix: Spot Market Bottoms and Oversold Conditions

· 13 min read
Pineify Team
Pine Script and AI trading workflow research team

Ever wonder how some traders seem to buy right at market bottoms while you're still waiting for the trend to confirm? They're probably using something like the Williams VIX Fix.

The Williams VIX Fix is a synthetic volatility indicator created by Larry Williams that measures how far prices have fallen from recent highs, expressed as a percentage. It acts like a universal fear gauge you can apply to stocks, crypto, or forex - no options data required. When readings spike, it signals that panic selling may have pushed prices too far.

If you've ever struggled with timing entries in volatile markets, you'll want to understand the Choppiness Index indicator first - it helps you figure out whether you're in a trending market where the VIX Fix really shines, or a choppy sideways mess where it might give false signals.

Williams VIX Fix Indicator displaying market bottom signals on TradingView chart

Trading Strategy Optimizers: Pineify vs Walk-Forward vs Heatmap

· 18 min read
Pineify Team
Pine Script and AI trading workflow research team

I spent last month stress-testing three trading strategy optimizers — Pineify, walk-forward analysis in Python, and a manual heatmap approach — on a 50/200 SMA crossover for BTCUSD and an RSI(2) mean reversion on SPY. The verdict: Pineify is the most practical pick for TradingView traders who want results fast. But if you're deploying five figures or more, walk-forward optimization isn't optional. A trading strategy optimizer is a tool that automatically tests different values for your strategy's parameters — moving average lengths, RSI levels, stop-loss distances — and tells you which combination performs best. Here's exactly what each method delivers and where they fall short.


Trading Strategy Optimizers Compared: Pineify vs Walk-Forward vs Heatmap Tools

Amibroker vs Pineify Backtest Reports: Strategy Validation Compared

· 16 min read
Pineify Team
Pine Script and AI trading workflow research team

A backtest report is the proof that tells you whether a trading strategy has real edge or just got lucky. Amibroker has been the desktop gold standard for this kind of analysis for years. Pineify's Backtest Deep Report is the newer web-based alternative, built specifically for TradingView users. I've tested the same strategies across both platforms, and my verdict is clear: if you write Pine Script on TradingView and want advanced risk metrics without extra coding, Pineify gives you deeper insight faster. But if you need portfolio-level backtesting with custom data feeds, Amibroker is still the better pick.


Amibroker vs Pineify Backtest Reports: Complete Strategy Validation Comparison

Advanced Backtesting: 3 Metrics That Uncover Hidden Strategy Risks

· 16 min read
Pineify Team
Pine Script and AI trading workflow research team

It's a great feeling when your TradingView strategy backtest shows a big green profit number, a high win rate, and a smooth-looking equity curve. It's easy to think you've found a winner. Here's the thing: the standard Strategy Tester results only give you the surface-level view. If you're not also looking at professional metrics like the Sharpe Ratio, Sortino Ratio, and Monte Carlo analysis, you're missing the full picture. And that can be expensive once you start trading with real money.

Advanced backtesting is the practice of evaluating a trading strategy using risk-adjusted metrics beyond basic profit and loss figures. The standard TradingView Strategy Tester leaves out several critical checks. Serious traders fill those gaps with the Sharpe Ratio, Sortino Ratio, and Monte Carlo simulation. I've tested over 50 strategies on TradingView, and the ones that looked best on paper—like a 2023 AAPL momentum setup with a 2.8 profit factor—often fell apart under deeper scrutiny.


Advanced TradingView Backtesting: Uncover Hidden Strategy Risks with Professional Metrics

How to Trade Synthetic Indices on MT5: A Practical Walkthrough

· 18 min read
Pineify Team
Pine Script and AI trading workflow research team

Synthetic indices are computer-generated trading instruments that ignore economic news and run 24/7 on MetaTrader 5. I started trading them on Deriv in early 2024, and the first thing that stood out was the price action — clean, no surprise gaps, no overnight gaps from some Fed announcement you missed. If technical analysis is your thing, this market was built for it.


How to Trade Synthetic Indices on MT5: Step-by-Step Guide for Beginners

Real-Time Options Flow Tracker | Pineify Market Insights

· 15 min read
Pineify Team
Pine Script and AI trading workflow research team

A real-time options flow tracker is a tool that monitors every large options trade as it hits the market and surfaces the data instantly. For a long time, only hedge funds and institutions had access to this kind of feed. But that gap is closing. Services like Pineify Market Insights now bring the same type of data to individual traders.

I started tracking options flow on SPY and QQQ back in January, and the first thing I noticed was how often big call sweeps appeared 2-3 days before major earnings reports. It's not a crystal ball, but it does show you where informed money is positioning itself before the rest of the market catches on. Pineify combines live options flow, off-exchange block trades, congressional stock disclosures, and overall sentiment into one dashboard. To get the most out of your charts, check out the Best Chart Settings for TradingView.


Real-Time Options Flow Tracker | Pineify Market Insights for Smart Money Data

Option Flow Data: The Institutional Trading Edge

· 20 min read
Pineify Team
Pine Script and AI trading workflow research team

Big moves in the markets rarely happen completely in the dark. When hedge funds and institutional traders place huge options bets, they leave behind clues in the data. This trail of clues is known as option flow data. Learning how to spot and interpret this flow can shift how you see the market, whether you're trading in and out of positions daily or building a portfolio for the long run.


Option Flow Data: The Institutional Trading Edge Every Trader Needs

CMF Strategy Guide: Color, Material and Finish in Product Design

· 17 min read
Pineify Team
Pine Script and AI trading workflow research team

CMF strategy is the practice of selecting Color, Material, and Finish to define a product's look, feel, and personality. Think of it as the recipe that determines whether a gadget feels premium or plastic, whether a chair invites you to sit or reads as clinical. In a market where products often share the same internal components, CMF is what makes one stand out over another. It has moved beyond being a final design step to become a core part of how brands tell their story and connect with people.

CMF Strategy Guide: Color, Material & Finish in Product Design

Pineify Market Insights: Institutional Trading Edge with Market Tide

· 13 min read
Pineify Team
Pine Script and AI trading workflow research team

Individual traders have been playing catch-up with institutions for decades. Hedge funds and market makers have always had better data: real-time options flow, dark pool prints, congressional disclosures, and broad sentiment gauges. That kind of intelligence used to cost thousands a month to assemble.

I've watched this gap slowly close over the past few years. Pineify Market Insights is a unified dashboard that brings options flow, dark pool activity, market sentiment tracking, and congressional trading into one screen. It's the kind of tool that would have cost a small fortune not long ago.


Pineify Market Insights: Best Market Tide Platform for Institutional Trading Edge