Trading Strategy Optimizers: Pineify vs Walk-Forward vs Heatmap
I spent last month stress-testing three trading strategy optimizers — Pineify, walk-forward analysis in Python, and a manual heatmap approach — on a 50/200 SMA crossover for BTCUSD and an RSI(2) mean reversion on SPY. The verdict: Pineify is the most practical pick for TradingView traders who want results fast. But if you're deploying five figures or more, walk-forward optimization isn't optional. A trading strategy optimizer is a tool that automatically tests different values for your strategy's parameters — moving average lengths, RSI levels, stop-loss distances — and tells you which combination performs best. Here's exactly what each method delivers and where they fall short.
How a Trading Strategy Optimizer Works
A trading strategy optimizer automates what used to be manual guesswork. You define a range for each setting — test every SMA period from 10 to 50 in steps of 2 — and the optimizer runs hundreds or thousands of backtests, then ranks the results. "Best" might mean highest net profit, lowest drawdown, or best Sharpe ratio.
I've watched traders spend whole weekends tweaking one parameter at a time in TradingView's backtester. The optimizer does it in minutes. It's a grid search: every combination of every range you specify gets tested, and you get a sorted list instead of messy notes across five browser tabs.
Why bother? Because the gap between a strategy that barely breaks even and one that consistently works is often down to a few specific parameter values. Finding them manually is like searching for a needle in a haystack. An optimizer finds them for you. If you're new to the foundational indicators that pair well with optimization, check out our RSI Trading Strategy Guide: Master Overbought/Oversold Signals & Divergence Patterns.
Get More From Your TradingView Strategies
If you've used TradingView's backtester, you know the pattern: tweak one setting, hit "Run," write down the result. Change another, run again. Before long you're drowning in browser tabs and spreadsheet cells, trying to piece together which combination actually worked.
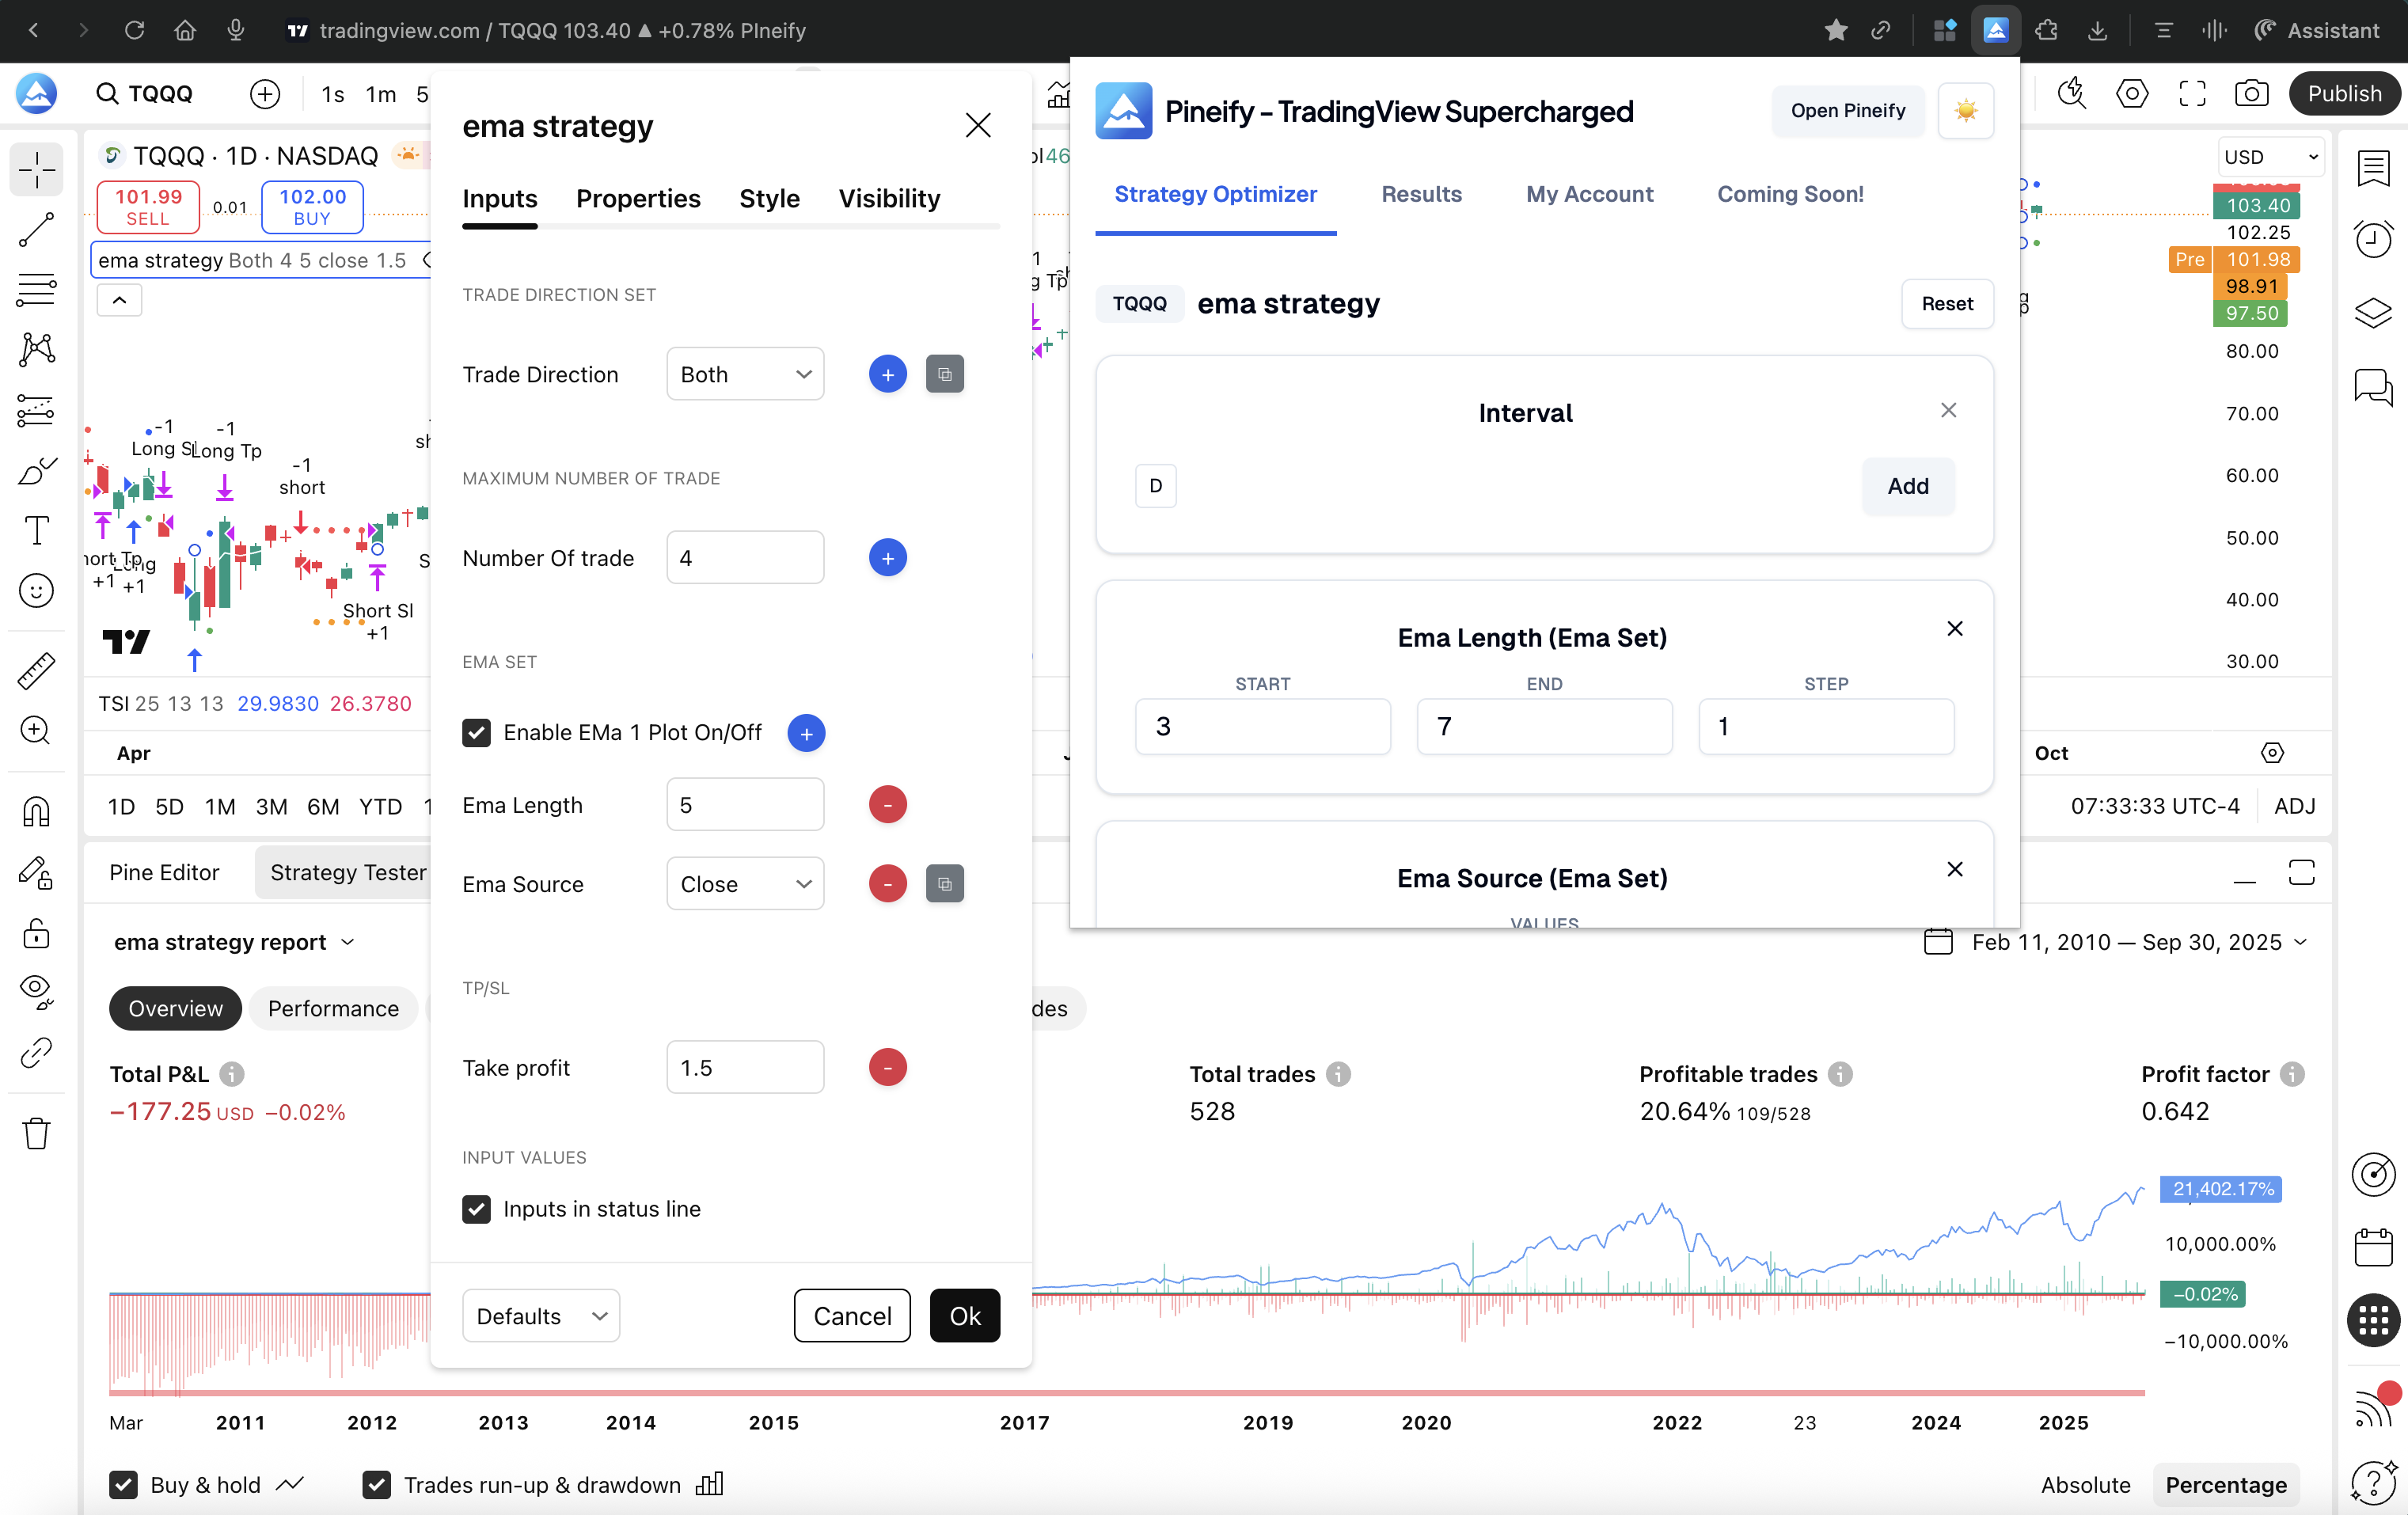
The Pineify Strategy Optimizer is a Chrome extension that automates that loop. It treats TradingView's native backtester like an engine and runs it on autopilot — thousands of combinations instead of one at a time.
What Pineify Does Differently
Tests everything at once. You tell it which parameters matter — say, RSI period, stop-loss, and take-profit — and the ranges to explore. It runs every combination and collects the results.
Shows the winners immediately. Results appear in a clean table you can sort by net profit, drawdown, win rate, or whatever metric you care about. No more squinting at notebooks.
Exports to CSV. Found a promising result? One click exports the full optimization history. I've loaded mine into Python for deeper analysis, but Excel works fine too.
Runs locally in your browser. Your Pine Script code never leaves your machine. The extension clicks buttons and reads data from the TradingView page you already have open. No servers involved.
Saves time. On my last run, Pineify tested about 400 combinations for a multi-timeframe strategy in under 12 minutes. That would've taken me hours manually.
Who It's For
Traders who live on TradingView and have a Pine Script strategy ready to go. It doesn't matter if you wrote it yourself or grabbed it from the community — the optimizer works with any standard Pine Script strategy. You don't need to learn a new platform or write a single line of code.
I'll be upfront about one limitation: Pineify's grid search doesn't include built-in walk-forward validation. That means your top results could still be overfitted to past data. You'll want to manually test them on fresh market data before trading with real money. For more on building automated systems, see Automated Trading with Pine Script Bots.
Pricing & Access: The optimizer is part of Pineify's Advanced and Expert lifetime plans, starting at a one-time payment of $149. Those plans also include AI-assisted Pine Script writing and enhanced backtesting reports.
Walk-Forward Optimization: Stress-Testing Strategies Like a Quant
Walk-forward optimization (WFO) is the gold standard for proving a strategy isn't just lucky. Instead of testing everything on the same chunk of history, WFO simulates how you'd actually trade: optimize on past data, then test forward on unseen data, then repeat.
The Process
The mechanics are straightforward and mirror real trading cycles:
- Slice your data into windows. Take, say, 5 years of BTCUSD history and break it into rolling 12-month chunks.
- Optimize inside the first window. Split window 1 into two halves. Use the first half (in-sample) to find the best parameters.
- Test forward. Take those optimized parameters and run them on the second half (out-of-sample) — data the optimizer never saw.
- Roll and repeat. Slide the window forward. Optimize on new in-sample data. Test on the next out-of-sample period.
- Judge on out-of-sample results only. The only results that matter are the out-of-sample periods stitched together. If performance holds up across all these unseen slices, you have real evidence the strategy works.
Why I Use WFO for Serious Money
- It fights overfitting hard. Testing on fresh data every cycle makes it nearly impossible to fool yourself with a curve-fitted strategy.
- It mirrors reality. The cycle of optimize, test, refine is exactly how you'd manage a live strategy. The out-of-sample results give you a realistic preview of what to expect.
- Data efficiency. You use your historical data twice — once for tuning, once for validation — which matters when you only have a few years of quality data.
The Trade-Offs
- Computationally expensive. A single walk-forward run can take hours for complex strategies. I've had Python scripts running overnight for a 50-parameter search.
- You need the right tools. StrategyQuant, Amibroker, or a custom Python setup are the typical options. None of these integrate with TradingView directly.
- Steep learning curve. This isn't a weekend project. Understanding window sizes, re-optimization frequency, and result interpretation takes real study.
Best Fit For: Quantitative traders who need production-level confidence before committing capital. I haven't used WFO on crypto strategies trading 24/7 markets, so I can't speak to how well it handles round-the-clock session handling.
Getting Clear with Heatmap Optimizers
A heatmap optimizer is a visual diagnostic tool. It plots two of your strategy's parameters on a grid — say, entry timeframe on the X axis and stop-loss percentage on the Y axis — and uses color to show performance. Hot colors (reds, oranges) mean better results. Cool colors (blues) mean worse. You spot your sweet spot in seconds without reading a single number.
Why I Still Use Heatmaps
- Instant pattern recognition. I can tell in one glance whether my best results form a wide plateau (stable) or a narrow spike (brittle). That visual check alone has saved me from trading at least two overfitted strategies.
- Parameter interaction at a glance. Sometimes a fast MA only works when paired with a specific take-profit level. A heatmap makes that relationship obvious in a way a table never could. This is similar to how patterns jump out once you learn to read the Market Cipher Indicator Guide: How to Actually Read Those Green Dots and Blue Waves (Without Getting Confused).
- Quick sanity check. Before I trust any optimization result, I throw it into a heatmap. If the hot zone covers a reasonable range of values, I'm more confident the strategy will hold up.
Where Heatmaps Fall Short
- Two parameters max. Heatmaps show two variables clearly. If your strategy has five inputs, you're juggling multiple charts and guessing about interactions.
- Extra setup. Most heatmap tools outside full backtesting platforms require you to format and import data yourself. It's one more step in the workflow.
- No single answer. A heatmap tells you where the good zones are, but it won't hand you one optimized parameter set. You still need to decide.
| Best For... | Less Suited For... |
|---|---|
| Traders who want a quick visual stability check after running a grid search | Strategies with more than two or three interacting parameters |
| Understanding trade-offs between two main settings | Fully automated, hands-off optimization that picks one best answer |
| Spotting wide performance plateaus to reduce overfitting risk |
Side-by-Side Comparison
Here's how the three approaches stack up on the metrics that matter:
| Feature | Pineify Strategy Optimizer | Walk-Forward Optimization | Heatmap Optimizer |
|---|---|---|---|
| Platform | TradingView (Chrome Extension) | StrategyQuant, Python, R, Amibroker | Custom tools, ThinkOrSwim, Python |
| Ease of Use | ⭐⭐⭐⭐⭐ Beginner-friendly | ⭐⭐ Advanced | ⭐⭐⭐ Intermediate |
| Overfitting Protection | Moderate (grid search only) | High (out-of-sample validation) | Moderate (visual reliability check) |
| Multi-Parameter Support | ✅ Yes | ✅ Yes | ⚠️ Two parameters at a time |
| Visual Output | Sortable results table | Performance stats per segment | Color-coded 2D heatmap |
| Export | CSV (one-click) | CSV / HTML reports | CSV / image exports |
| Code Required | ❌ No | ✅ Yes | ⚠️ Sometimes |
| Cost | One-time ($149+) | Varies (free to $1000+) | Free to moderate |
| Best For | TradingView traders | Quant professionals | Visual sensitivity analysis |
The best tool depends on what you're optimizing and how much capital is at stake. If you live in TradingView and want simplicity, Pineify fits. If you're building institutional-quality systems, walk-forward is the professional standard. If you need to see how two settings interact, a heatmap is invaluable.
More Specialized Optimization Tools
Beyond the three main approaches, I've come across a few alternatives worth mentioning:
- StrategyQuant X. The industrial workshop for strategy development. It bundles walk-forward optimization, Monte Carlo simulation, and deep reliability testing in one package. Powerful, but the price ($500-$1,000+) and learning curve put it beyond most retail traders.
- Amibroker. A longtime favorite among retail quants. Its walk-forward support is excellent, and the AFL scripting language gives you fine-grained control. I've used it for portfolio-level testing and found the speed impressive compared to Python for large datasets.
- Python (Backtrader, VectorBT). The "build it yourself" path. I've spent more time than I'd like to admit writing custom walk-forward loops in VectorBT. The flexibility is unmatched — you control every aspect of the optimization — but you'll need to be comfortable debugging Python at 2 AM. If you're learning to code your own indicators, Understanding the Talinreg Function in Pine Script v6 is a good starting point.
- TradingView's Native Optimizer. TradingView added a basic optimizer in 2025. It's useful for quick single-parameter tweaks, but it can't handle the multi-parameter automation that Pineify or Python workflows provide.
Picking the Right Optimizer for Your Situation
Three questions I ask myself before choosing an optimizer:
Where do you trade? If you're on TradingView 90% of the time, Pineify adds directly to your existing workflow. No code, no platform switching, no data exports. It's the fastest path from "I wonder if this works" to "here are my top 10 parameter sets."
How much capital is at risk? For small accounts or initial idea validation, grid search optimization is fine. Once you're managing $10,000 or more, walk-forward validation becomes non-negotiable. I've seen too many strategies look perfect in a grid search and fall apart in live trading because they were fitted to noise.
What kind of analysis do you need? If you're tweaking two main parameters and want to see their interaction, start with a heatmap. If you're optimizing a strategy with five or six inputs, you need a multi-parameter approach like Pineify or WFO.
In practice, I use a blend. Pineify for initial discovery and fast iteration, then a heatmap for visual validation, and finally a walk-forward check in Python before I risk real money. Each method covers a blind spot the others leave open.
Q&A: Common Questions About Strategy Optimizers
Q: Does strategy optimization guarantee future profits? No. And anyone who tells you otherwise is selling something. Optimization tells you what worked in the past, not what will work tomorrow. Markets drift, regimes change, and the setup that crushed it last year could bleed money next quarter. Always test optimized parameters on fresh out-of-sample data and paper trade before going live. Walk-forward optimization is the best tool I know for managing this uncertainty.
Q: Can Pineify's Strategy Optimizer work with any TradingView strategy? Yes, if the strategy is written in Pine Script and uses standard input types — numbers, true/false toggles, or dropdown menus. You don't need to modify a single line of code.
Q: What's the risk of over-optimization? It's the number one trap in quantitative trading. You tune a strategy so precisely to historical data that it fails the moment the market breathes differently. The best defense is to look for wide performance plateaus — parameter ranges where the strategy performs well consistently — rather than a single perfect peak. If your optimizer only finds one narrow spike, be suspicious.
Q: How long does an optimization run take with Pineify? It depends on how many combinations you're testing and your TradingView subscription speed. For a few hundred combinations, expect 5-15 minutes. I've run 2,000+ combinations overnight without issues.
Q: Is my strategy code safe when using Pineify? Yes. The code stays on your machine. The extension automates clicks and reads data from the page you already have open. Nothing gets sent to any server.
What to Do Next
You've got a clear picture now. Here's how to start:
- Install Pineify's Strategy Optimizer. Head to the Chrome Web Store and install it. In under five minutes you can connect it to one of your TradingView strategies and run your first multi-parameter scan.
The tool is part of Pineify's broader toolkit, which includes a Visual Editor and AI Coding Agent. You can go from a trading idea to an optimized, error-free Pine Script strategy in one workflow.

- Visualize your results. Export the CSV from Pineify and build a simple heatmap in Excel or Python. You're looking for a wide zone of good performance, not a single sharp peak.
- Paper trade your top settings. Run the optimized strategy on a demo account for 4 to 8 weeks. This is your reality check — does the backtest match live behavior?
- Try walk-forward analysis. If you're serious about a strategy, test it with a walk-forward approach. StrategyQuant offers a free trial, or you can build one with Python's vectorbt library.
- Join a community. Optimization works better with feedback. The Pineify Discord is active with traders sharing their results and methods.
The real edge comes from testing a strategy from multiple angles, not from one clever idea. Start simple with Pineify, add heatmap checks when you want to visualize stability, and layer in walk-forward analysis as your capital grows. Each method covers a blind spot the others leave open.
▶What is the difference between a grid search optimizer and walk-forward optimization?
A grid search optimizer (like Pineify) runs every combination of your chosen parameters against the same historical data and ranks the winners. Walk-forward takes a different approach: it splits your data into rolling windows, optimizes on the first chunk, then tests those settings on the next chunk of unseen data. Grid search is faster and straightforward. Walk-forward is your best defense against overfitting, but it's more complex to set up.
▶Which trading strategy optimizer is best for beginners?
Pineify Strategy Optimizer is the easiest to get started with. No coding required, it works inside TradingView as a Chrome extension, and results show up in a sortable table. Walk-forward tools like StrategyQuant and Python frameworks are more powerful but expect you to know your way around quantitative analysis. If you're just starting out, start with Pineify.
▶How do I avoid overfitting when optimizing a trading strategy?
Four things I'd tell anyone: (1) Always test optimized parameters on out-of-sample data — data the optimizer didn't see during the run. (2) Look for wide performance plateaus, not narrow spikes. A strategy that works across a range of values is more trustworthy than one that peaks at a single exact setting. (3) Use walk-forward optimization for strategies you plan to trade with real money. (4) Paper trade for several weeks before going live. None of these alone is enough, but together they catch most overfitting problems.
▶Can I use a heatmap optimizer alongside Pineify?
Absolutely. My typical workflow: run Pineify to generate the full parameter grid, export the CSV, then build a 2D heatmap in Excel or Python. Pineify handles the heavy lifting of testing every combination, and the heatmap shows you whether your best results form a stable plateau or a spiky peak that's likely to fail.
▶Does Pineify Strategy Optimizer support multi-parameter backtesting?
Definitely. You can set up multiple parameters at the same time — for example, RSI period, stop-loss distance, and take-profit level — each with its own range and step size. Pineify runs every combination automatically and ranks results. It's a genuine multi-parameter backtesting optimizer for TradingView.
▶What is the cost of Pineify Strategy Optimizer compared to StrategyQuant?
Pineify's lifetime access starts at a one-time payment of $149, which includes the Strategy Optimizer and other tools. StrategyQuant X is significantly more expensive — often $500 to $1,000+ — and targets professional quants. Python libraries like VectorBT are free, but you'll need to know how to code to use them. Each option makes sense for a different budget and skill level.