Pine Script v6 Cheat Sheet: Operators, Functions, and Data Types
· 12 min read

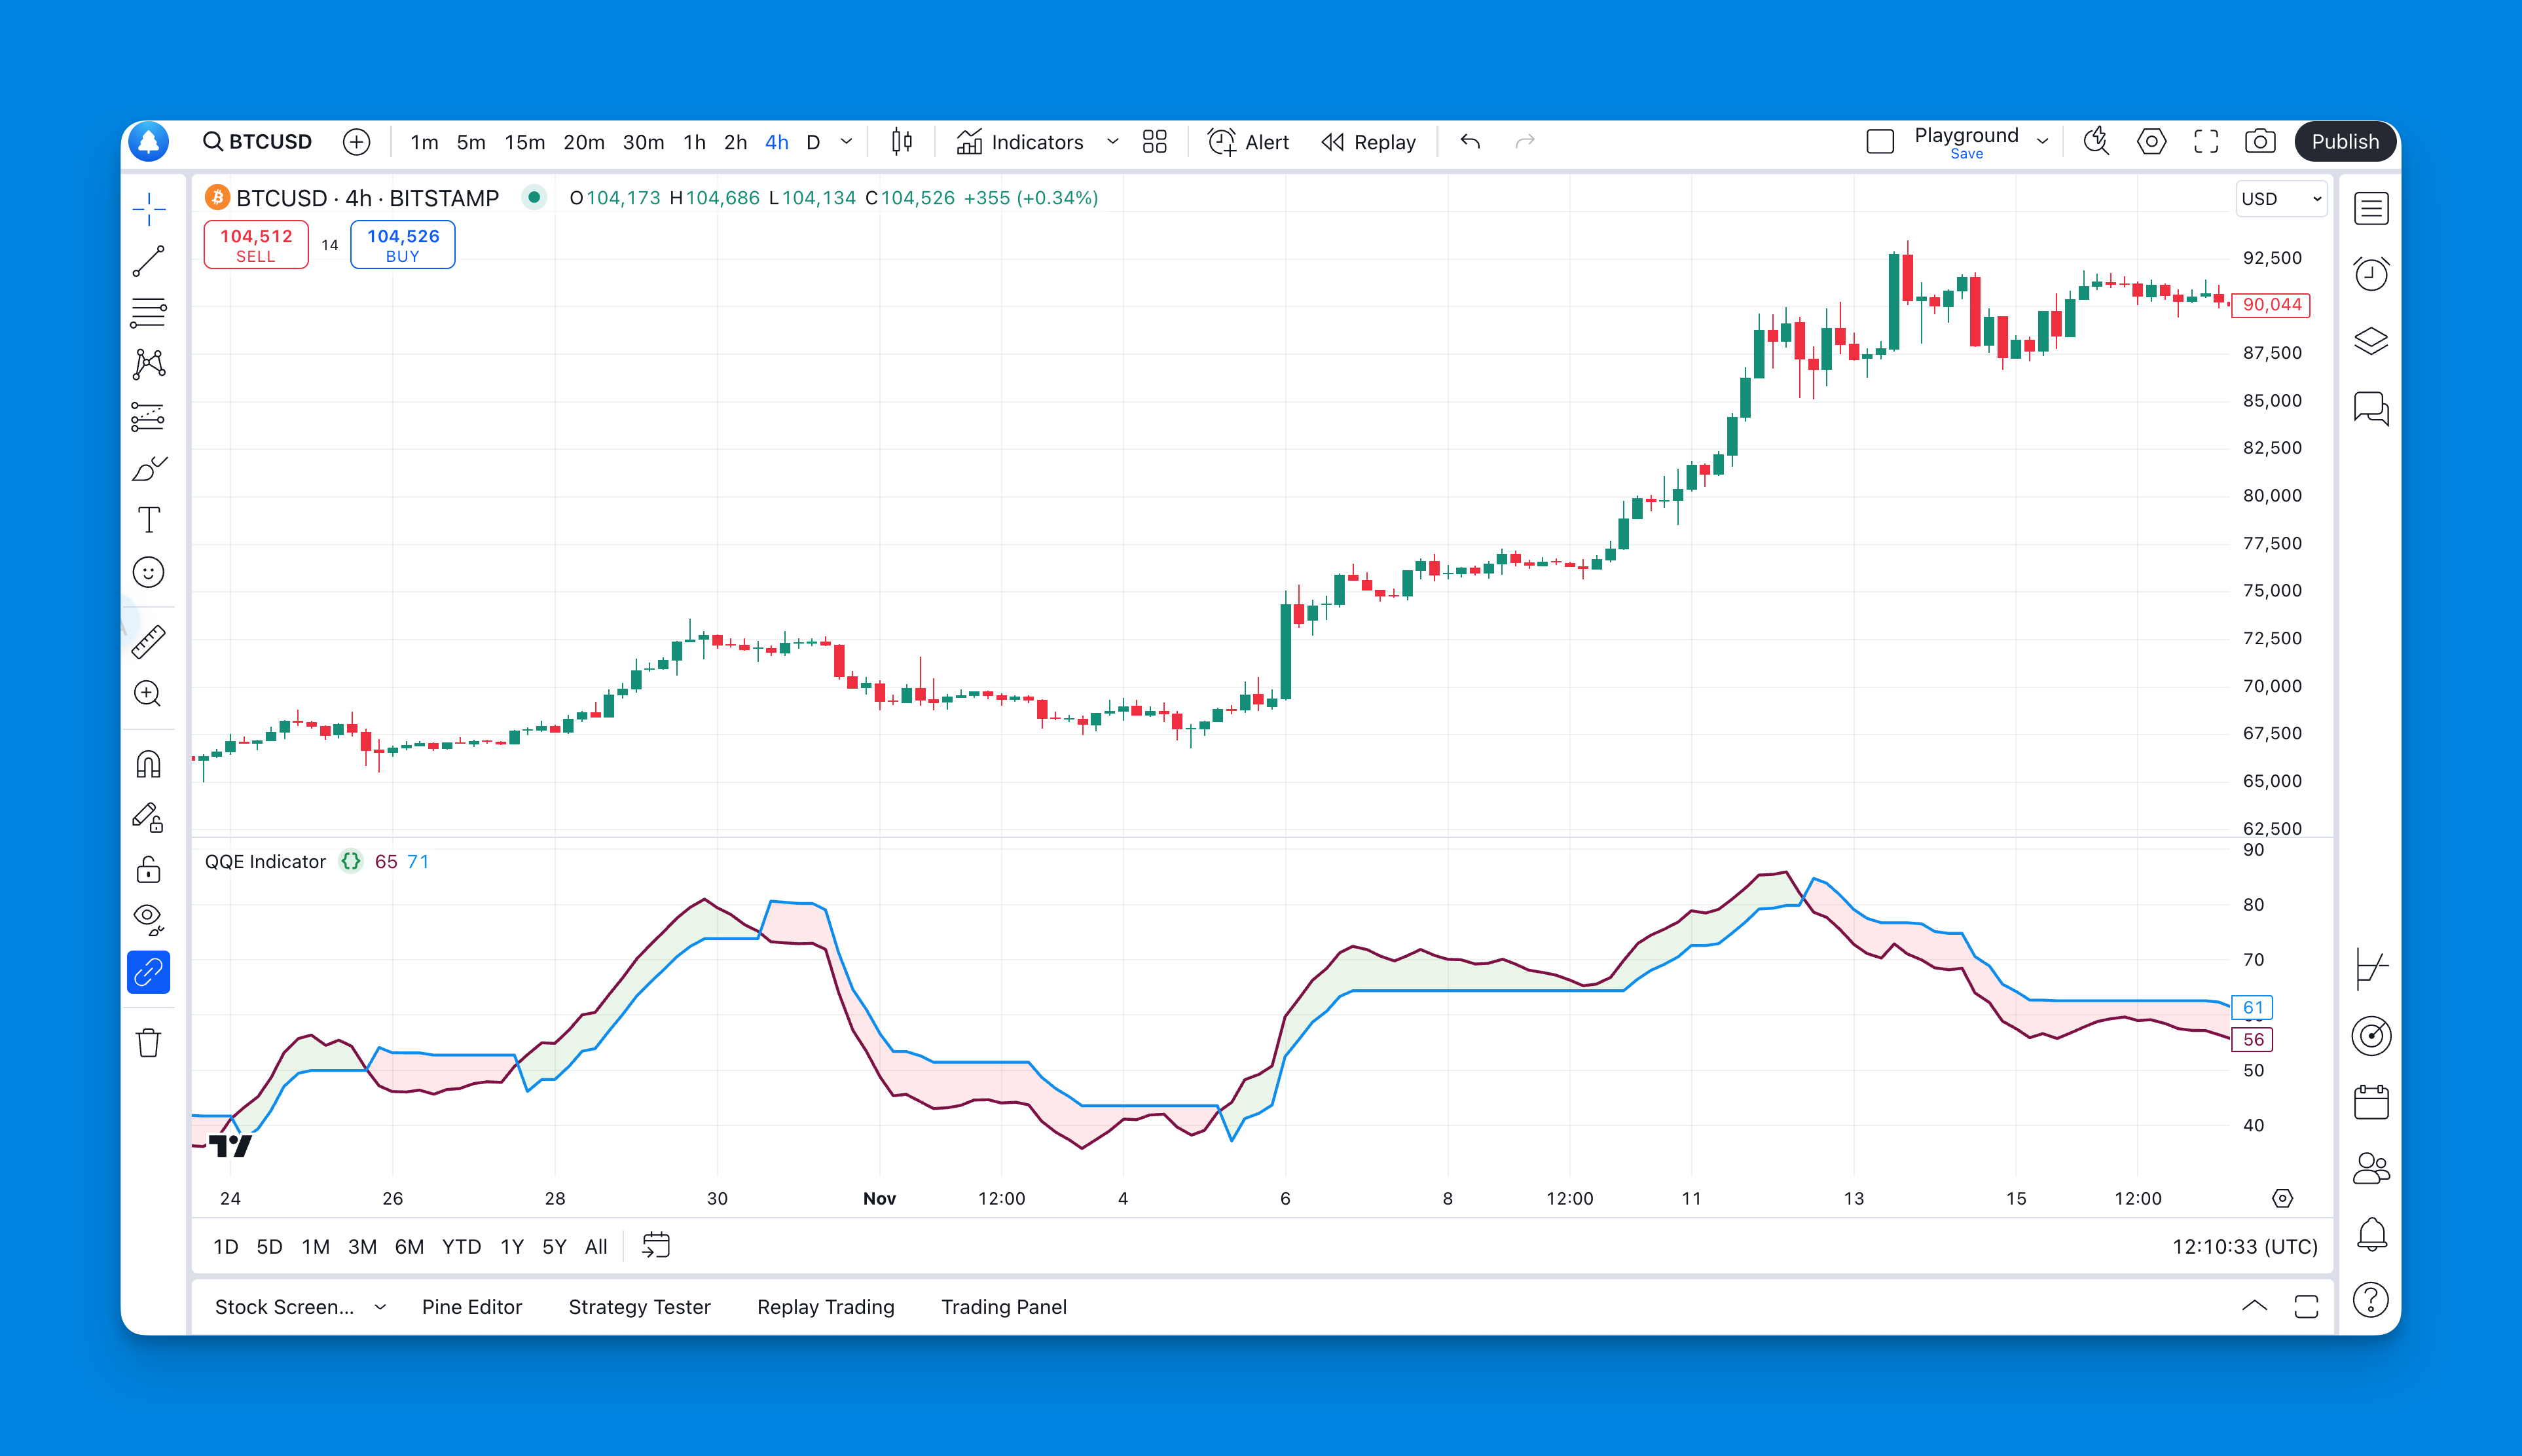
Pine Script v6 is TradingView's scripting language for building custom indicators and trading strategies. I've been writing Pine Script for about two years, and this cheat sheet collects the operators, data types, and built-in functions I reference most. Whether I'm coding an RSI divergence scanner for AAPL or a trailing stop for ES futures, these are the fundamentals.
If you're wondering what language is Pine Script, it's TradingView's domain-specific scripting language for financial analysis and automated strategies.