TradingView Backtest Alternative: Smarter Analysis with Pineify
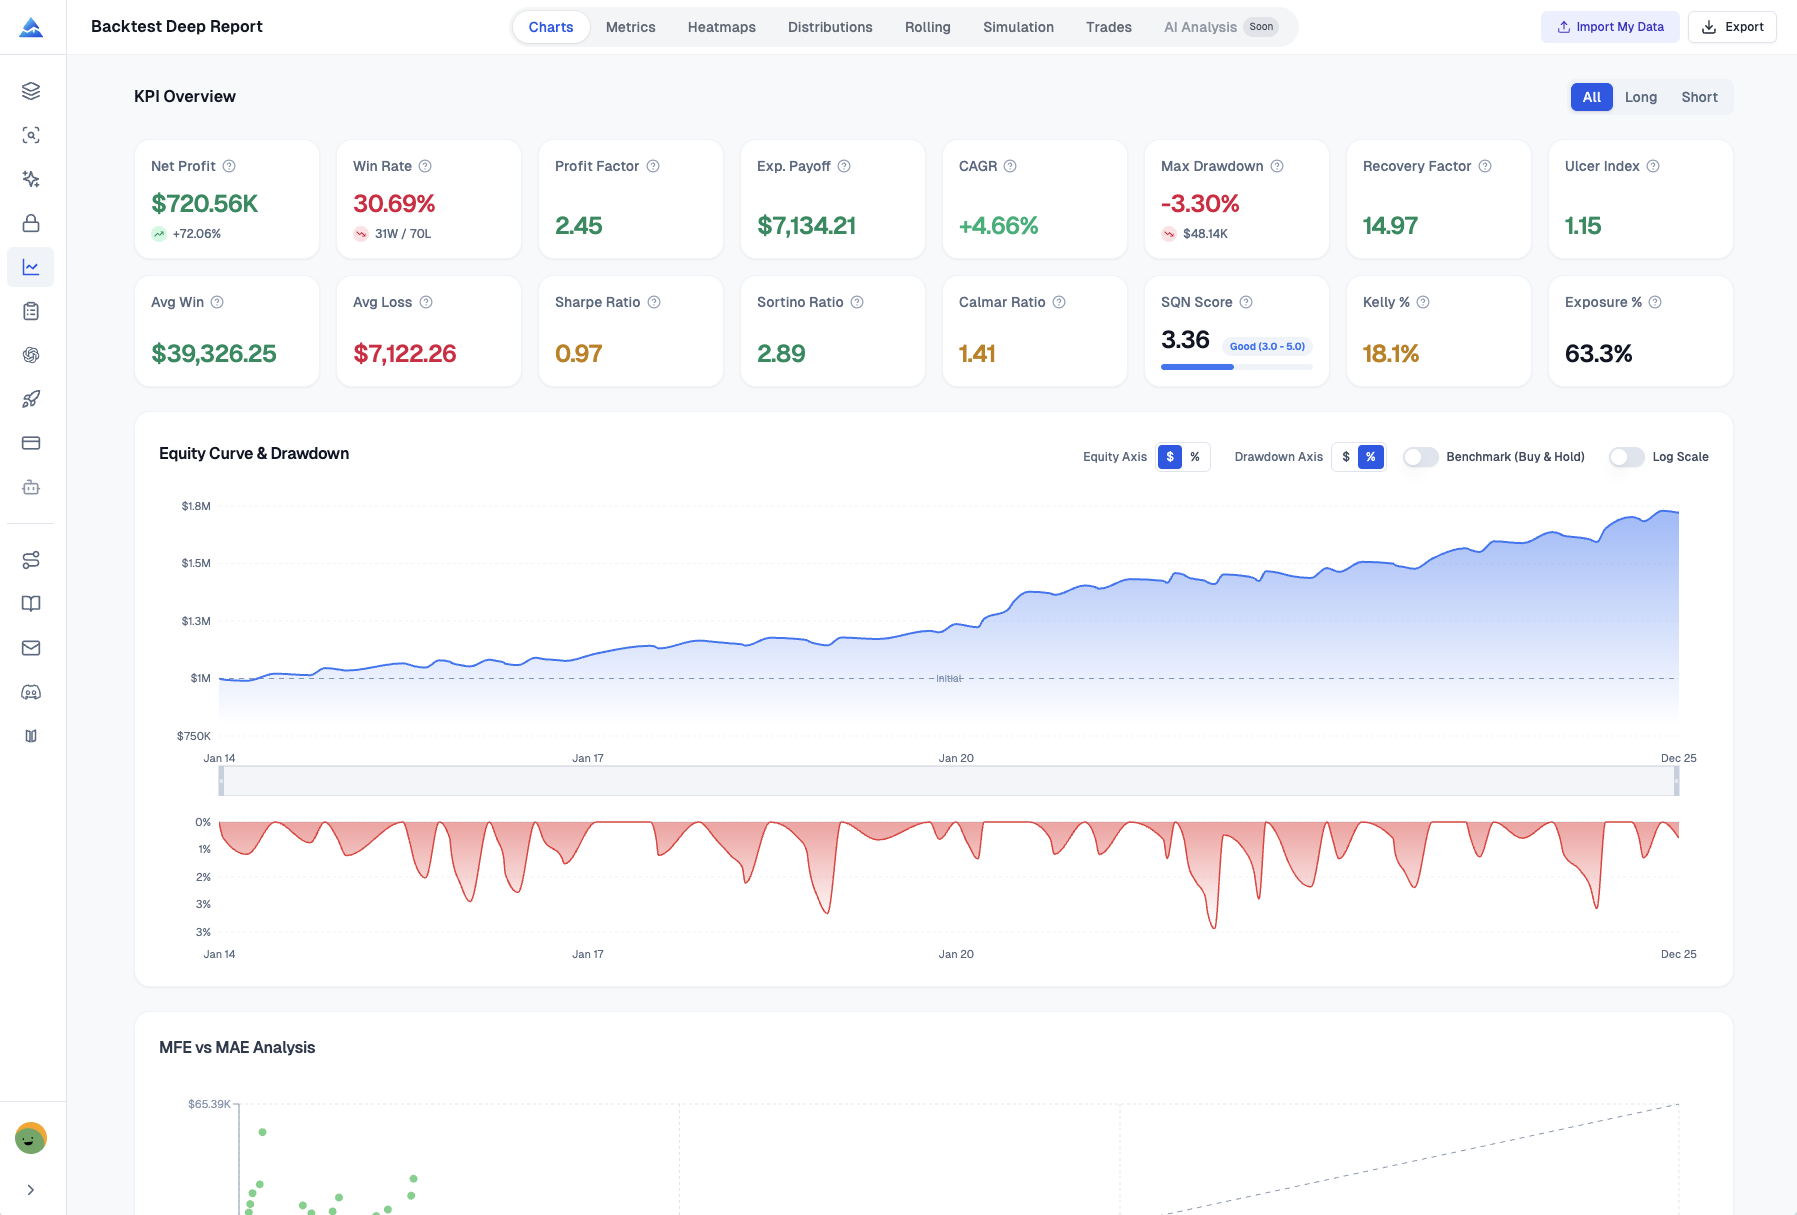
If you've ever downloaded your TradingView strategy results as a CSV and felt lost in a sea of numbers, I get it. Pineify Backtest Deep Report is a browser-based tool that turns that raw trade list into a full performance dashboard. You upload the CSV, and in seconds you get 16+ KPIs, Monte Carlo simulations, MFE/MAE analysis, rolling window stats, and time-based heatmaps — all processed on your own machine so your data never leaves your device. TradingView's built-in backtester is great for quick checks, but when you need real depth, it comes up short.
I've run into this myself testing a EUR/USD trend-following strategy earlier this year. The standard TradingView report showed a 62% win rate and a nice equity curve, but I had no way to tell if those returns would hold up if the market behaved differently. That's the gap Pineify fills.