Pine Script Multi-Timeframe Analysis with request.security()
· 12 min read
Multi-timeframe analysis is the practice of evaluating an asset across multiple chart timeframes to get a more complete market view. I learned this the hard way — staring at a 5-minute AAPL chart in December 2024, watching what I thought was a breakout, only to realize the daily trend had been bearish for weeks. That trade cost me, and it's why I won't trade without multiple timeframes anymore.
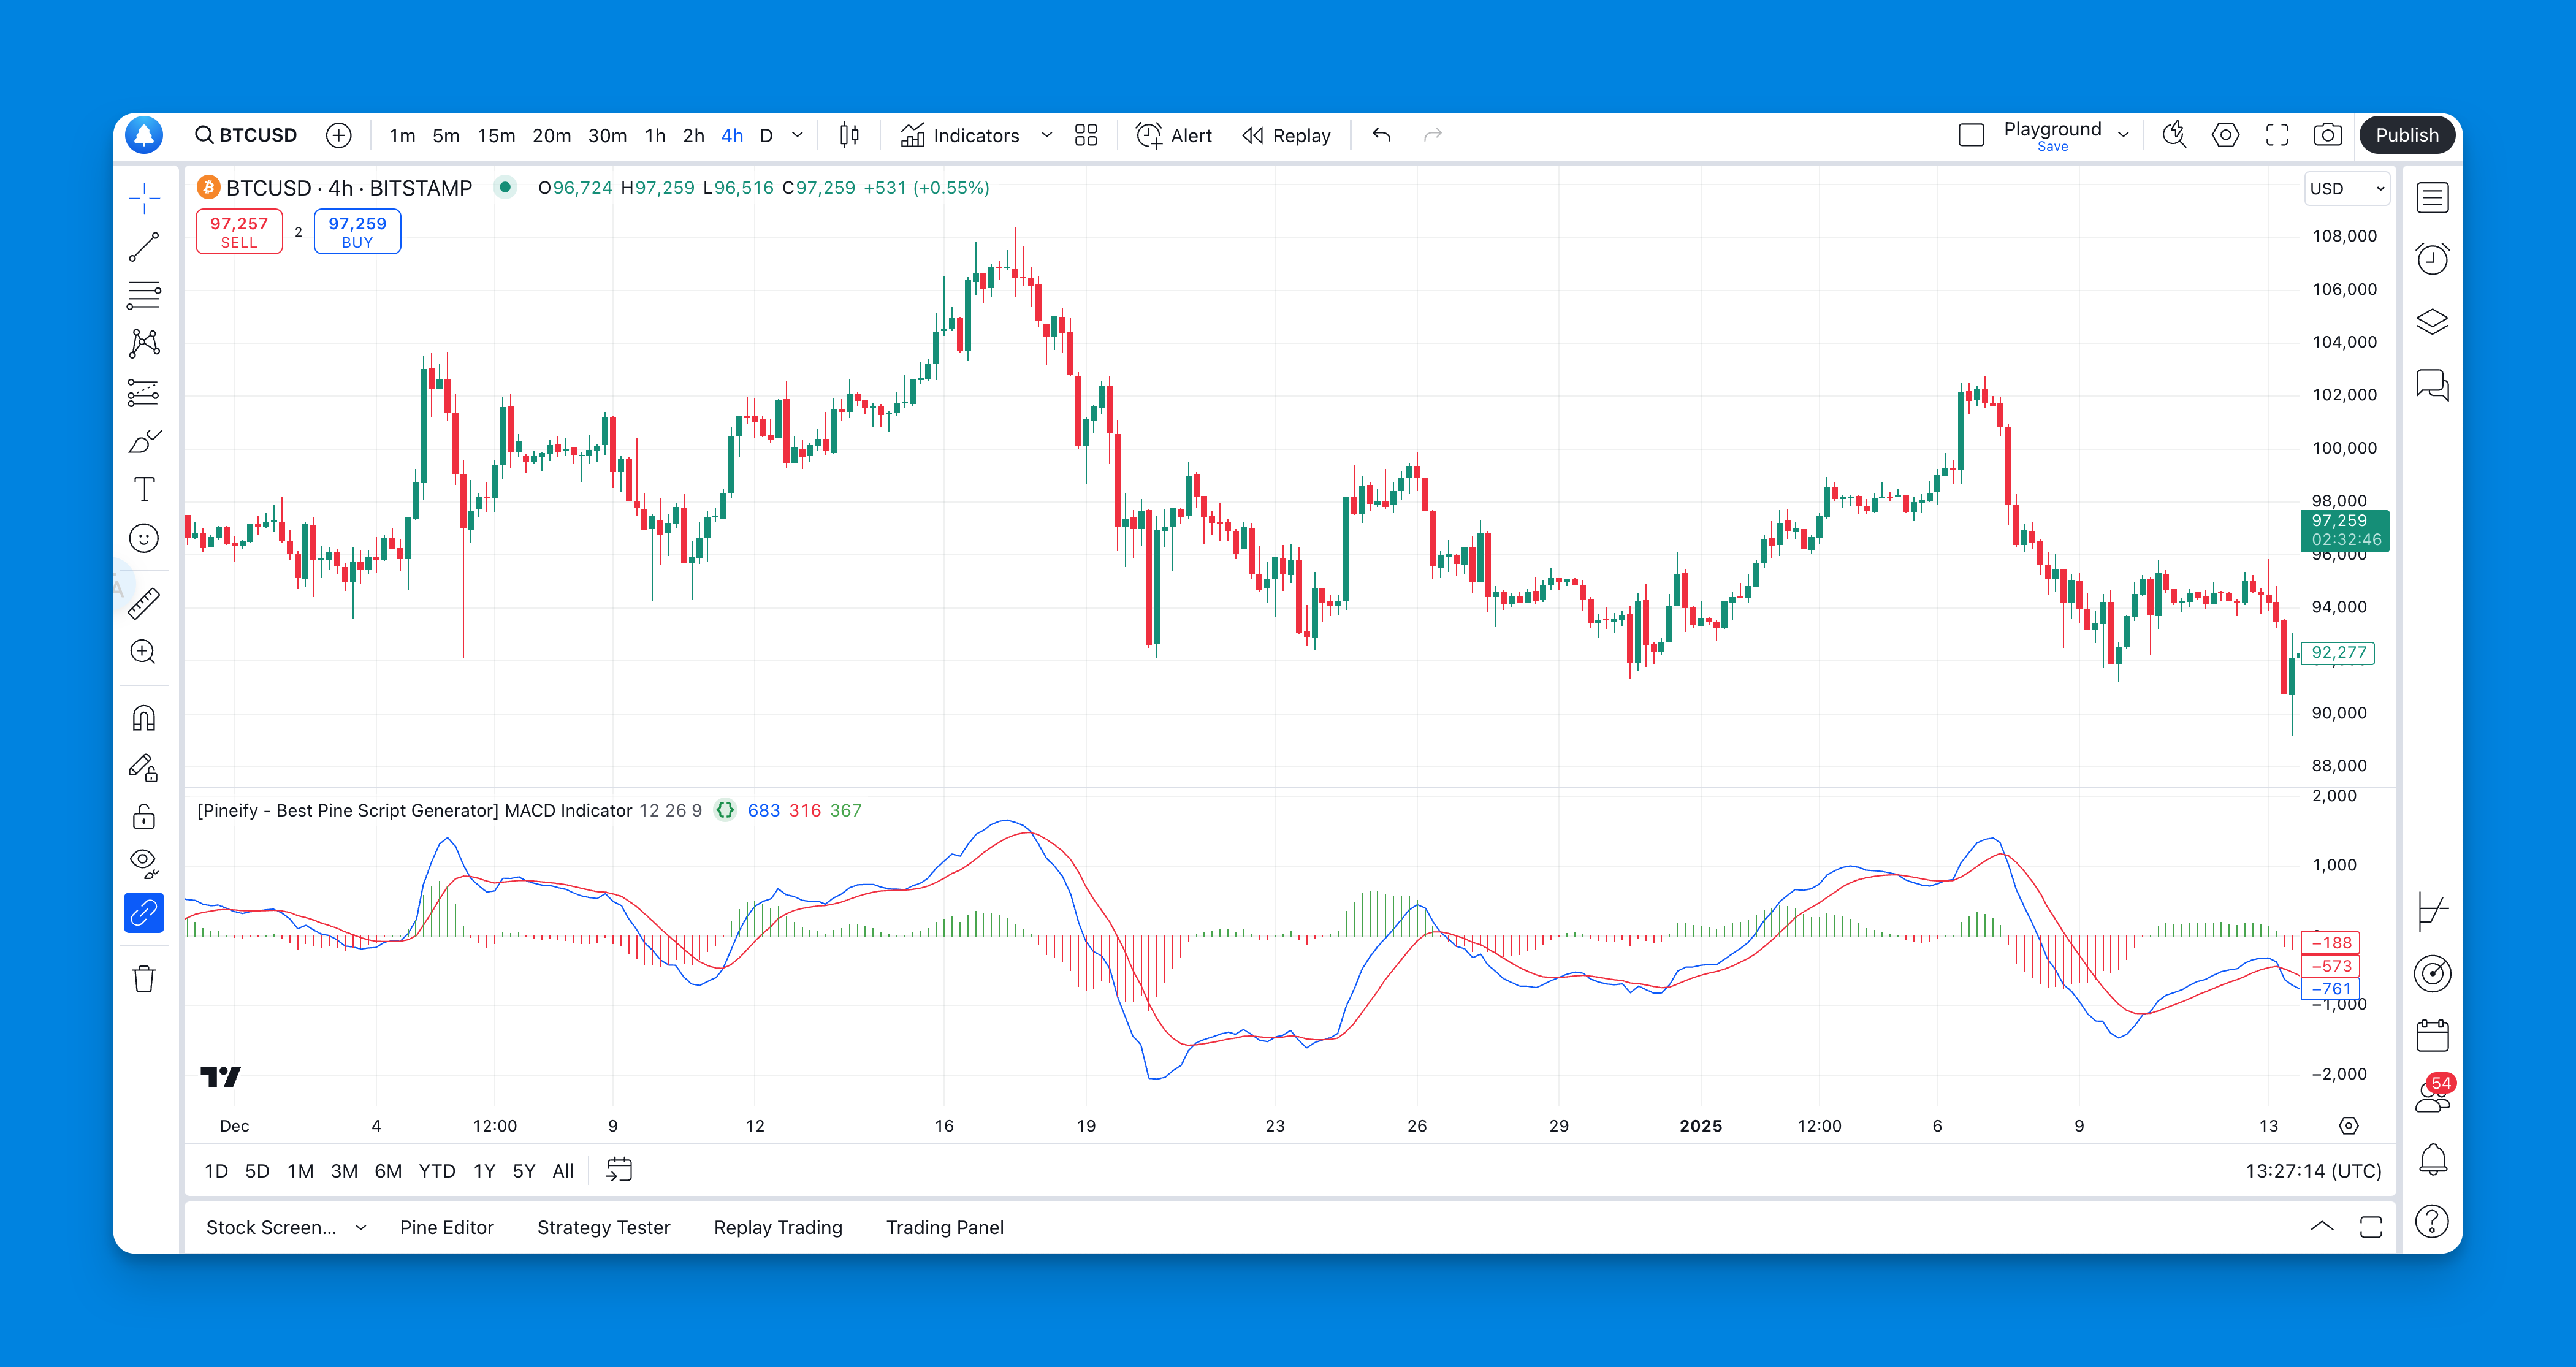
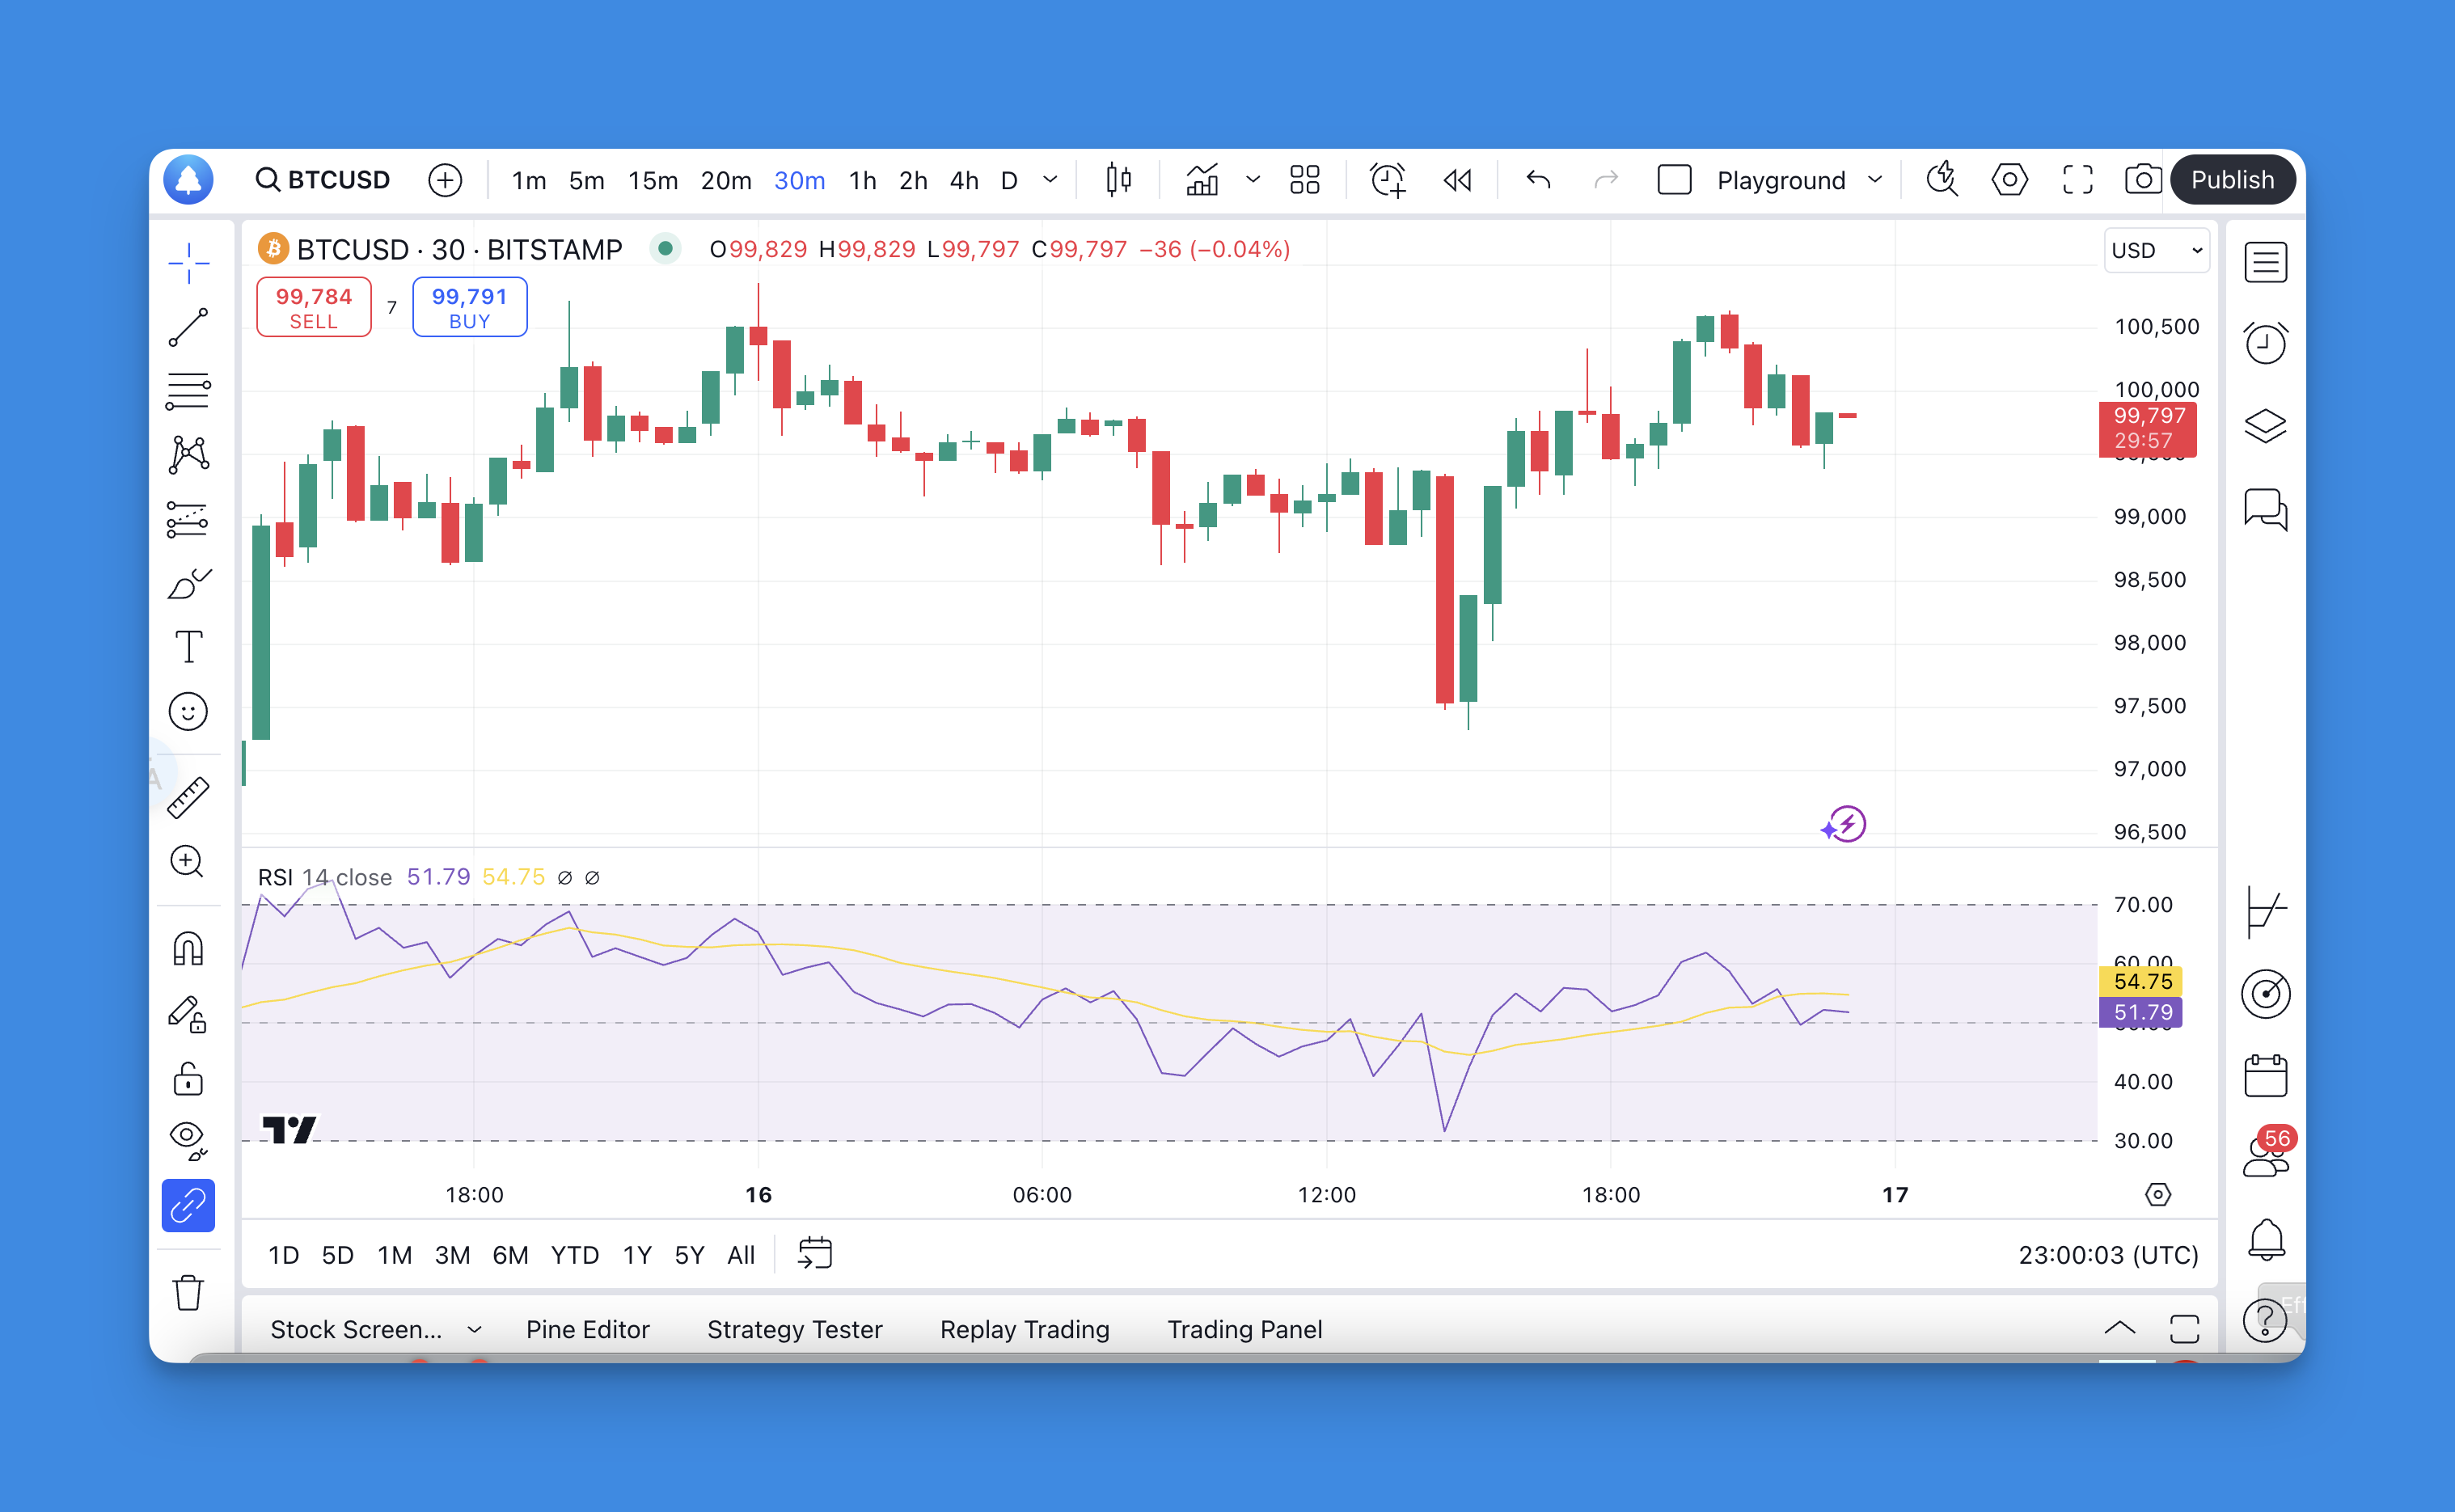
Working with different time frames in Pine Script is like having multiple cameras recording the same movie from different angles. You get the full story instead of one confusing scene.