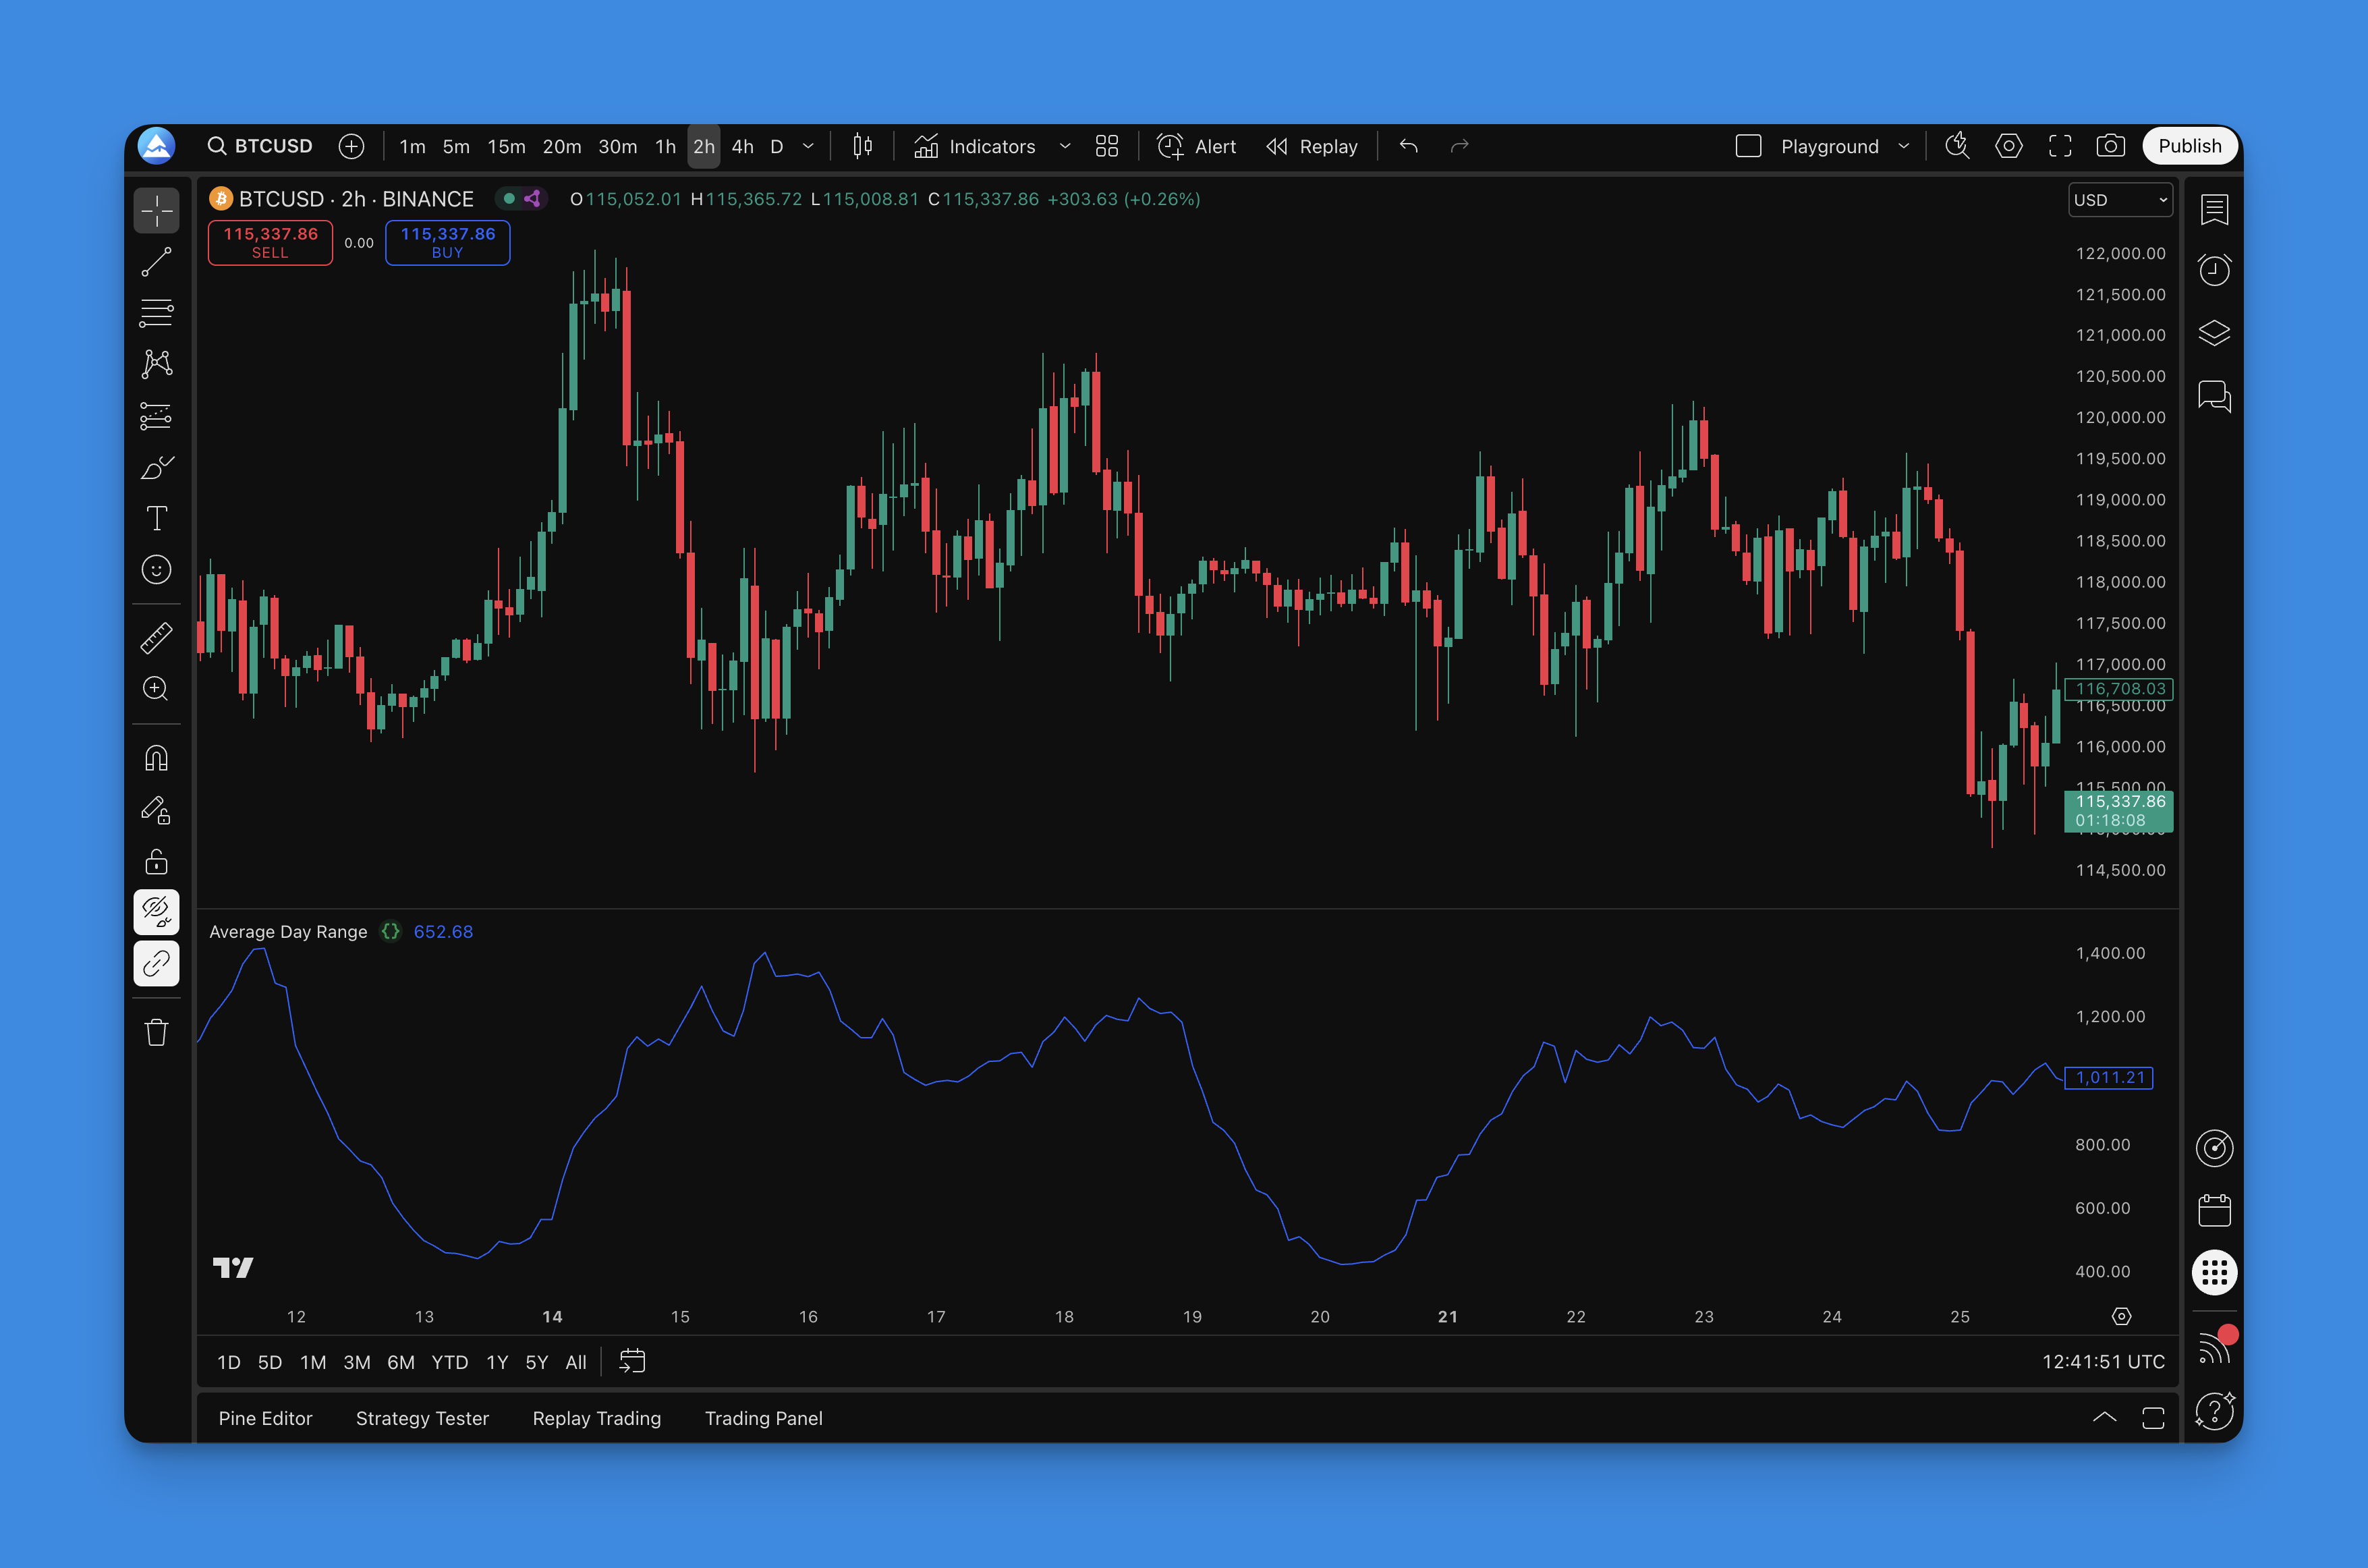
Average Day Range Indicator: Better Risk Management on TradingView
The Average Day Range (ADR) indicator measures how much an asset typically moves in a single session. Take TSLA — I've been tracking it since March 2025, and on a normal day it swings about $12 to $15 between high and low. When I saw ADR spike to $28 on April 3, 2026, I knew something was off before the earnings miss hit the news. That's what ADR gives you: a volatility benchmark that actually means something.
Most traders I know jump straight to RSI or MACD. I've done that too. But ADR is the one I check first now, because it tells me what the market is doing instead of what it already did. It's not complicated — you don't need a math degree or a PhD in quantitative finance.
How ADR Is Calculated
Here's the formula, and I promise it's simpler than you'd expect:
ADR = SMA(Daily High - Daily Low, N)
Take the high of the day, subtract the low, do that for N days (usually 14), and average it. That's it. No True Range adjustments, no ATR-style gap accounting, just the plain range averaged out. If Bitcoin's daily range was $1,800, $2,100, $1,950, $2,400, and $2,000 over the last five sessions, your 5-period ADR is roughly $2,050.
Why You'd Want This
The average range tells you what counts as normal. When the current day's range pushes past the ADR line, the market is making a statement. When it shrinks below, indecision is setting in. I've found this especially useful for crypto — BTCUSD in late 2025 had a 14-day ADR of around $3,100, but by February 2026 it dropped to $1,800. Anyone who ignored that shift and kept their same position size got burned.
Key Parameters
| Timeframe | Recommended Period | Best For |
|---|---|---|
| 1-min to 5-min | 7-10 | Scalping quick moves |
| 15-min to 60-min | 10-14 | Day trading intraday |
| Daily | 14-20 | Swing trading |
| Weekly | 20-30 | Long-term position trading |
These aren't hard rules. I personally run 7, 14, and 21 periods on the same chart and watch how they interact.
Adding ADR to Your TradingView Charts
If you've ever tried coding an ADR indicator from scratch in Pine Script, you know it's doable but tedious. The Pineify visual editor handles it in about five minutes without writing a line of code.
Search for "Average Day Range" in the Pineify indicator library. You'll see a few variants — some overlay on price, some plot in a separate pane. I prefer the separate pane version because it keeps my price chart clean. Pick your period (14 is the default but you can change it), choose your colors, and hit generate. The Pine Script code comes out ready to paste into TradingView's Pine Editor.

If you're newer to Pine Script, this beginner's guide to Pine coding walks through the basics. The platform also keeps up with Pine Script v6 updates automatically, so you don't need to worry about your code breaking after an upgrade.

Using ADR for Real Risk Management
This is where ADR stops being academic and starts saving you money.
Position sizing that adjusts to volatility. Say you're willing to risk $200 on a trade. If AAPL has a 14-day ADR of $4.50, you can buy about 44 shares and stay within your risk limit. If that ADR jumps to $7 after earnings, you drop to roughly 28 shares. Same dollar risk, different position. I use this every time I enter a trade now.
Stop-loss placement with actual reasoning. Instead of picking a random percentage, set your stop at an ADR multiple. For day trades I use 0.5x ADR — tight enough to matter, loose enough to avoid whipsaws. For swing trades I go with 1.5x ADR. On a stock with a $5 ADR, that's a $7.50 stop instead of a made-up number. I haven't tested this on forex during high-impact news, so I'd be careful applying it to GBP or JPY pairs around NFP releases.
Profit targets that are actually reachable. If the ADR is $3 per share, hoping for a $10 move in one session is a lottery ticket, not a strategy. I aim for 1x to 2x ADR depending on the setup. Conservative trades target 1x, aggressive ones push for 2x. On December 15, 2025, I caught a TSLA move at 1.8x ADR and took profit when it hit $9.80 — right around the 2x level.
Reading market conditions. I track whether the current day's range is above or below ADR. Above means the asset is getting active — could be news-driven momentum or panic selling. Below means it's quiet, which is a good time to wait for a breakout rather than chase price. I covered this more in the risk-reward calculation guide.

ADR Settings I've Actually Tested
I've gone through probably thirty variations of ADR settings across different assets. Here's what I've settled on.
14 periods is the standard for a reason — it's a decent middle ground. Not too jumpy, not too slow. Works fine for most blue chips and major indices.
Shorter periods (7-10) for faster-moving assets or day trading. If you're trading SPY on 5-minute candles, a 7-period ADR reacts to recent volatility changes within hours rather than days. The tradeoff is more noise. Some days you'll see ADR spike on a single outlier bar, which can lead to over-adjusting your position size if you're not careful.
Longer periods (20-30) for swing trading or crypto. BTCUSD's daily ADR over 21 periods gives a smoother picture of the underlying volatility trend. The downside is lag — it takes longer to react when volatility regime shifts.
Multi-period comparison is the setup I actually use. Three lines: 7, 14, and 21 periods. When all three slope up together, volatility is expanding. When they diverge, I pay attention because the short-term picture and long-term picture disagree.
Backtesting ADR Strategies Properly
Backtesting with ADR is straightforward if you avoid a few common mistakes.
Write the rules first. Define your entry and exit conditions in plain language. Example: "Buy when price breaks above the 20-day high AND ADR has been rising for 3 consecutive days. Sell when price closes below 0.5x ADR of the entry price." If you can't explain it in one sentence, it's too complicated.
Use enough data. I test across at least three years including 2022's bear market and 2023-2024's recovery. If your strategy only works in trending markets, you need to know that before you trade it with real money.
Track the right numbers. Win rate is tempting to optimize for, but I've found it's a trap. A strategy that wins 40% of the time with a 1:3 risk-reward beats one that wins 70% with a 1:1 ratio. Focus on profit factor, max drawdown, and the Sharpe ratio.
Don't curve-fit the ADR period. If 13.7 periods gives better backtest results than 14, ignore the improvement — it's noise. Test your parameters on out-of-sample data. If they hold up, you've got something real.
Account for trading costs. Commissions, spreads, and slippage add up fast, especially with short ADR periods that trigger frequent entries. A strategy that looks great on paper at $0 commissions might be unprofitable in reality.
For a deeper dive into quantitative testing, check this Pine Script backtesting guide.
Frequently Asked Questions
▶What is the Average Day Range indicator?
The Average Day Range (ADR) measures the average daily price range of an asset over a set period, normally 14 days. It takes the daily high minus the daily low, averages those differences, and plots the result. The key difference from ATR is that ADR uses a simple average of raw ranges while ATR accounts for overnight gaps and limit moves. For most day-to-day trading I find ADR more intuitive.
▶How do I add the ADR indicator to TradingView?
The quickest route is Pineify's visual editor — search "Average Day Range" in the indicator library, tweak the period and colors, generate the Pine Script code, and paste it into TradingView's Pine Editor. Takes about five minutes and you don't need to write any code. If you prefer coding it yourself, the logic is just SMA(high-low, period).
▶What is the best ADR setting for day trading?
I use 7 to 10 periods for day trading. Shorter periods respond faster to recent volatility, which matters when you're trading intraday. Swing traders should go longer — 20 to 30 periods smooths out the noise. The classic 14-period setting works for general analysis across most assets.
▶How do I use ADR for position sizing?
Divide your risk amount by the ADR value. Risking $200 on a stock with a $5 ADR means 40 shares. If the ADR jumps to $8, you drop to 25 shares. The dollar risk stays the same regardless of how volatile the market gets. I've been using this method since early 2025 and it's kept my drawdowns predictable.
▶What is the difference between ADR and ATR?
ADR uses SMA(daily high - daily low), while ATR applies True Range which factors in overnight gaps and limit moves. ADR is simpler and works well for most stocks and crypto. ATR is more thorough during volatile conditions where the close-to-open gap matters. For normal trading days the two values are usually close.
▶Does ADR work for backtesting strategies?
Yes. ADR gives you a framework for setting stop-loss and take-profit levels based on the asset's typical range. Backtest your strategy across at least two to three years of data covering different market regimes — bull, bear, and sideways. Track profit factor, maximum drawdown, and Sharpe ratio rather than fixating on win rate.