Pineify Invite-Only Indicator: TradingView Signals and Overlays
I spend most of my charting time inside TradingView, and the hardest part isn't "finding an indicator." It's deciding which signals deserve capital when several tools disagree. Pineify - Signals & Overlays is an invite-only TradingView indicator that overlays buy-sell signals, a Dow Theory trend cloud, and an ATR-based stop line directly on price charts. I've been running it on NVDA daily and ETHUSD 4-hour since January, and the trend cloud alone changed how I filter setups before I even look at arrows.
That said, I don't trust any overlay blindly. The product narrative on Pineify's invite-only landing page emphasizes breadth across markets and timeframes, plus a workflow that maps onto how many discretionary traders operate: add the script, read the trend state, wait for confirmation, then anchor risk to an ATR-based line. None of that replaces judgment, account rules, or a personal trading plan. It's a lens, not a guarantee.
What is an Invite-Only Indicator?
An invite-only script on TradingView isn't a public library indicator anyone can install. Access is controlled by the publisher, which is why you'll see it under TradingView's invite-only scripts area after Pineify grants permission. In my workflow, that matters because it reduces casual copy-paste usage and keeps the script tied to a real entitlement path.
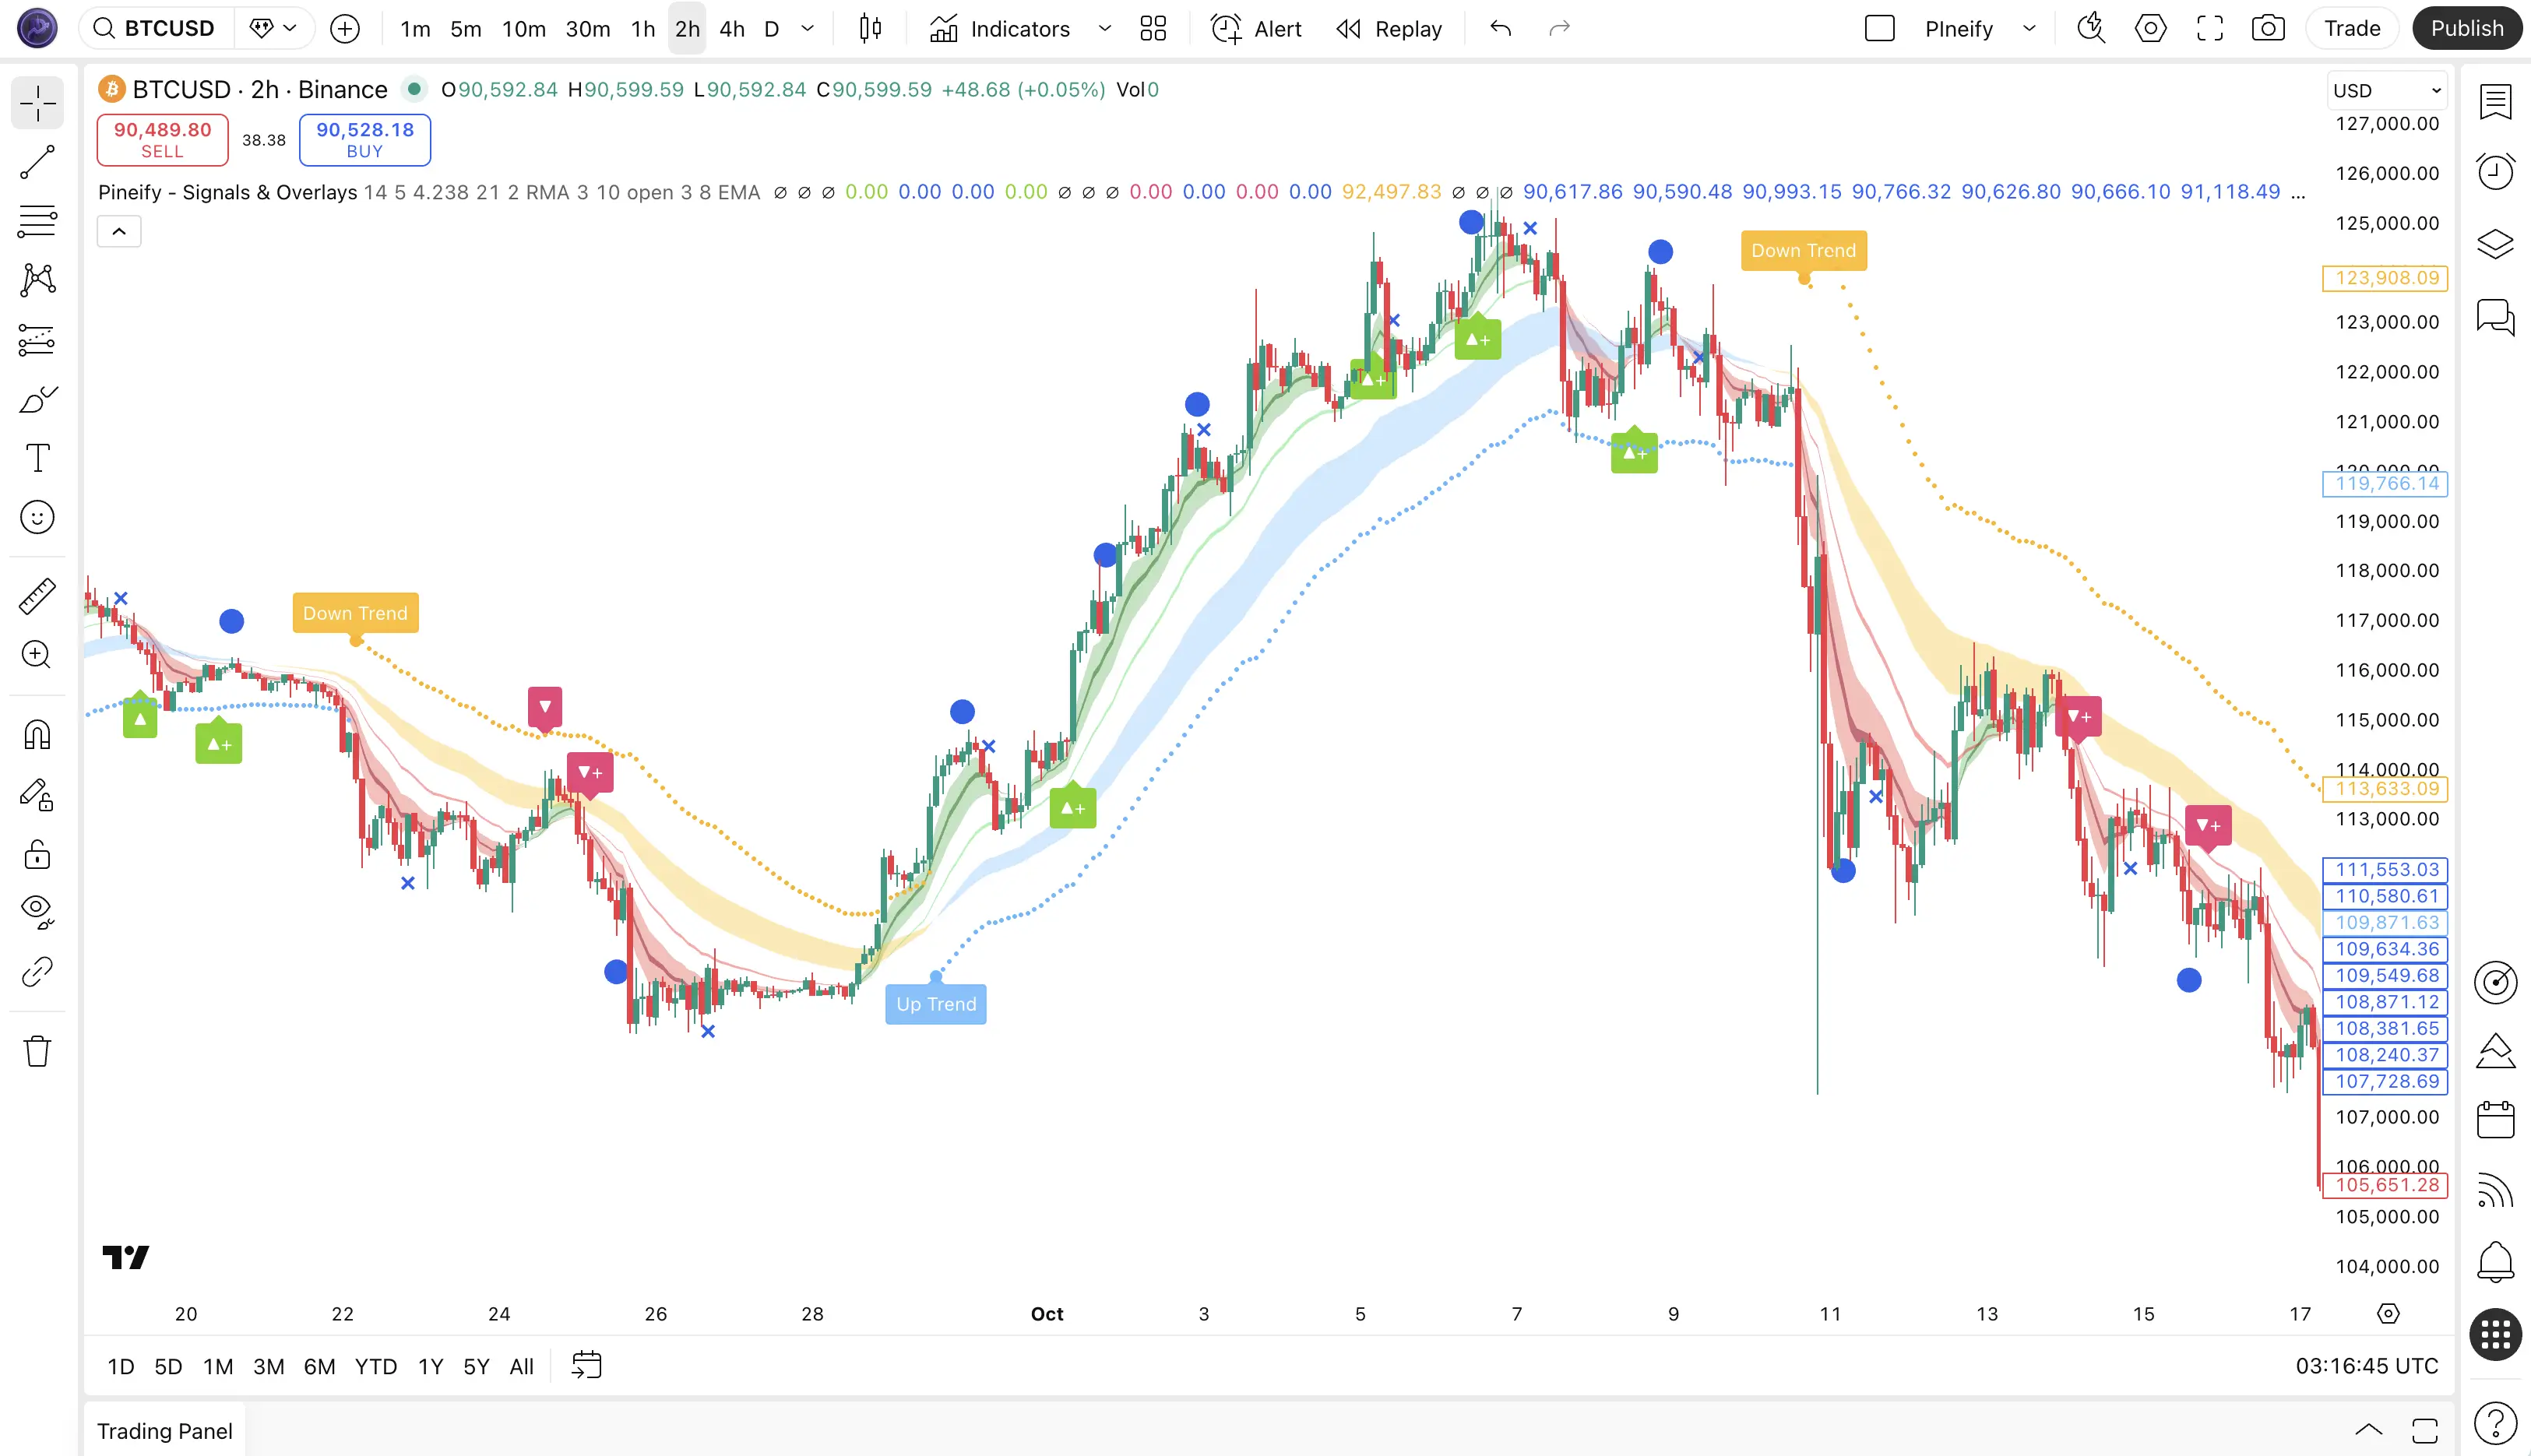
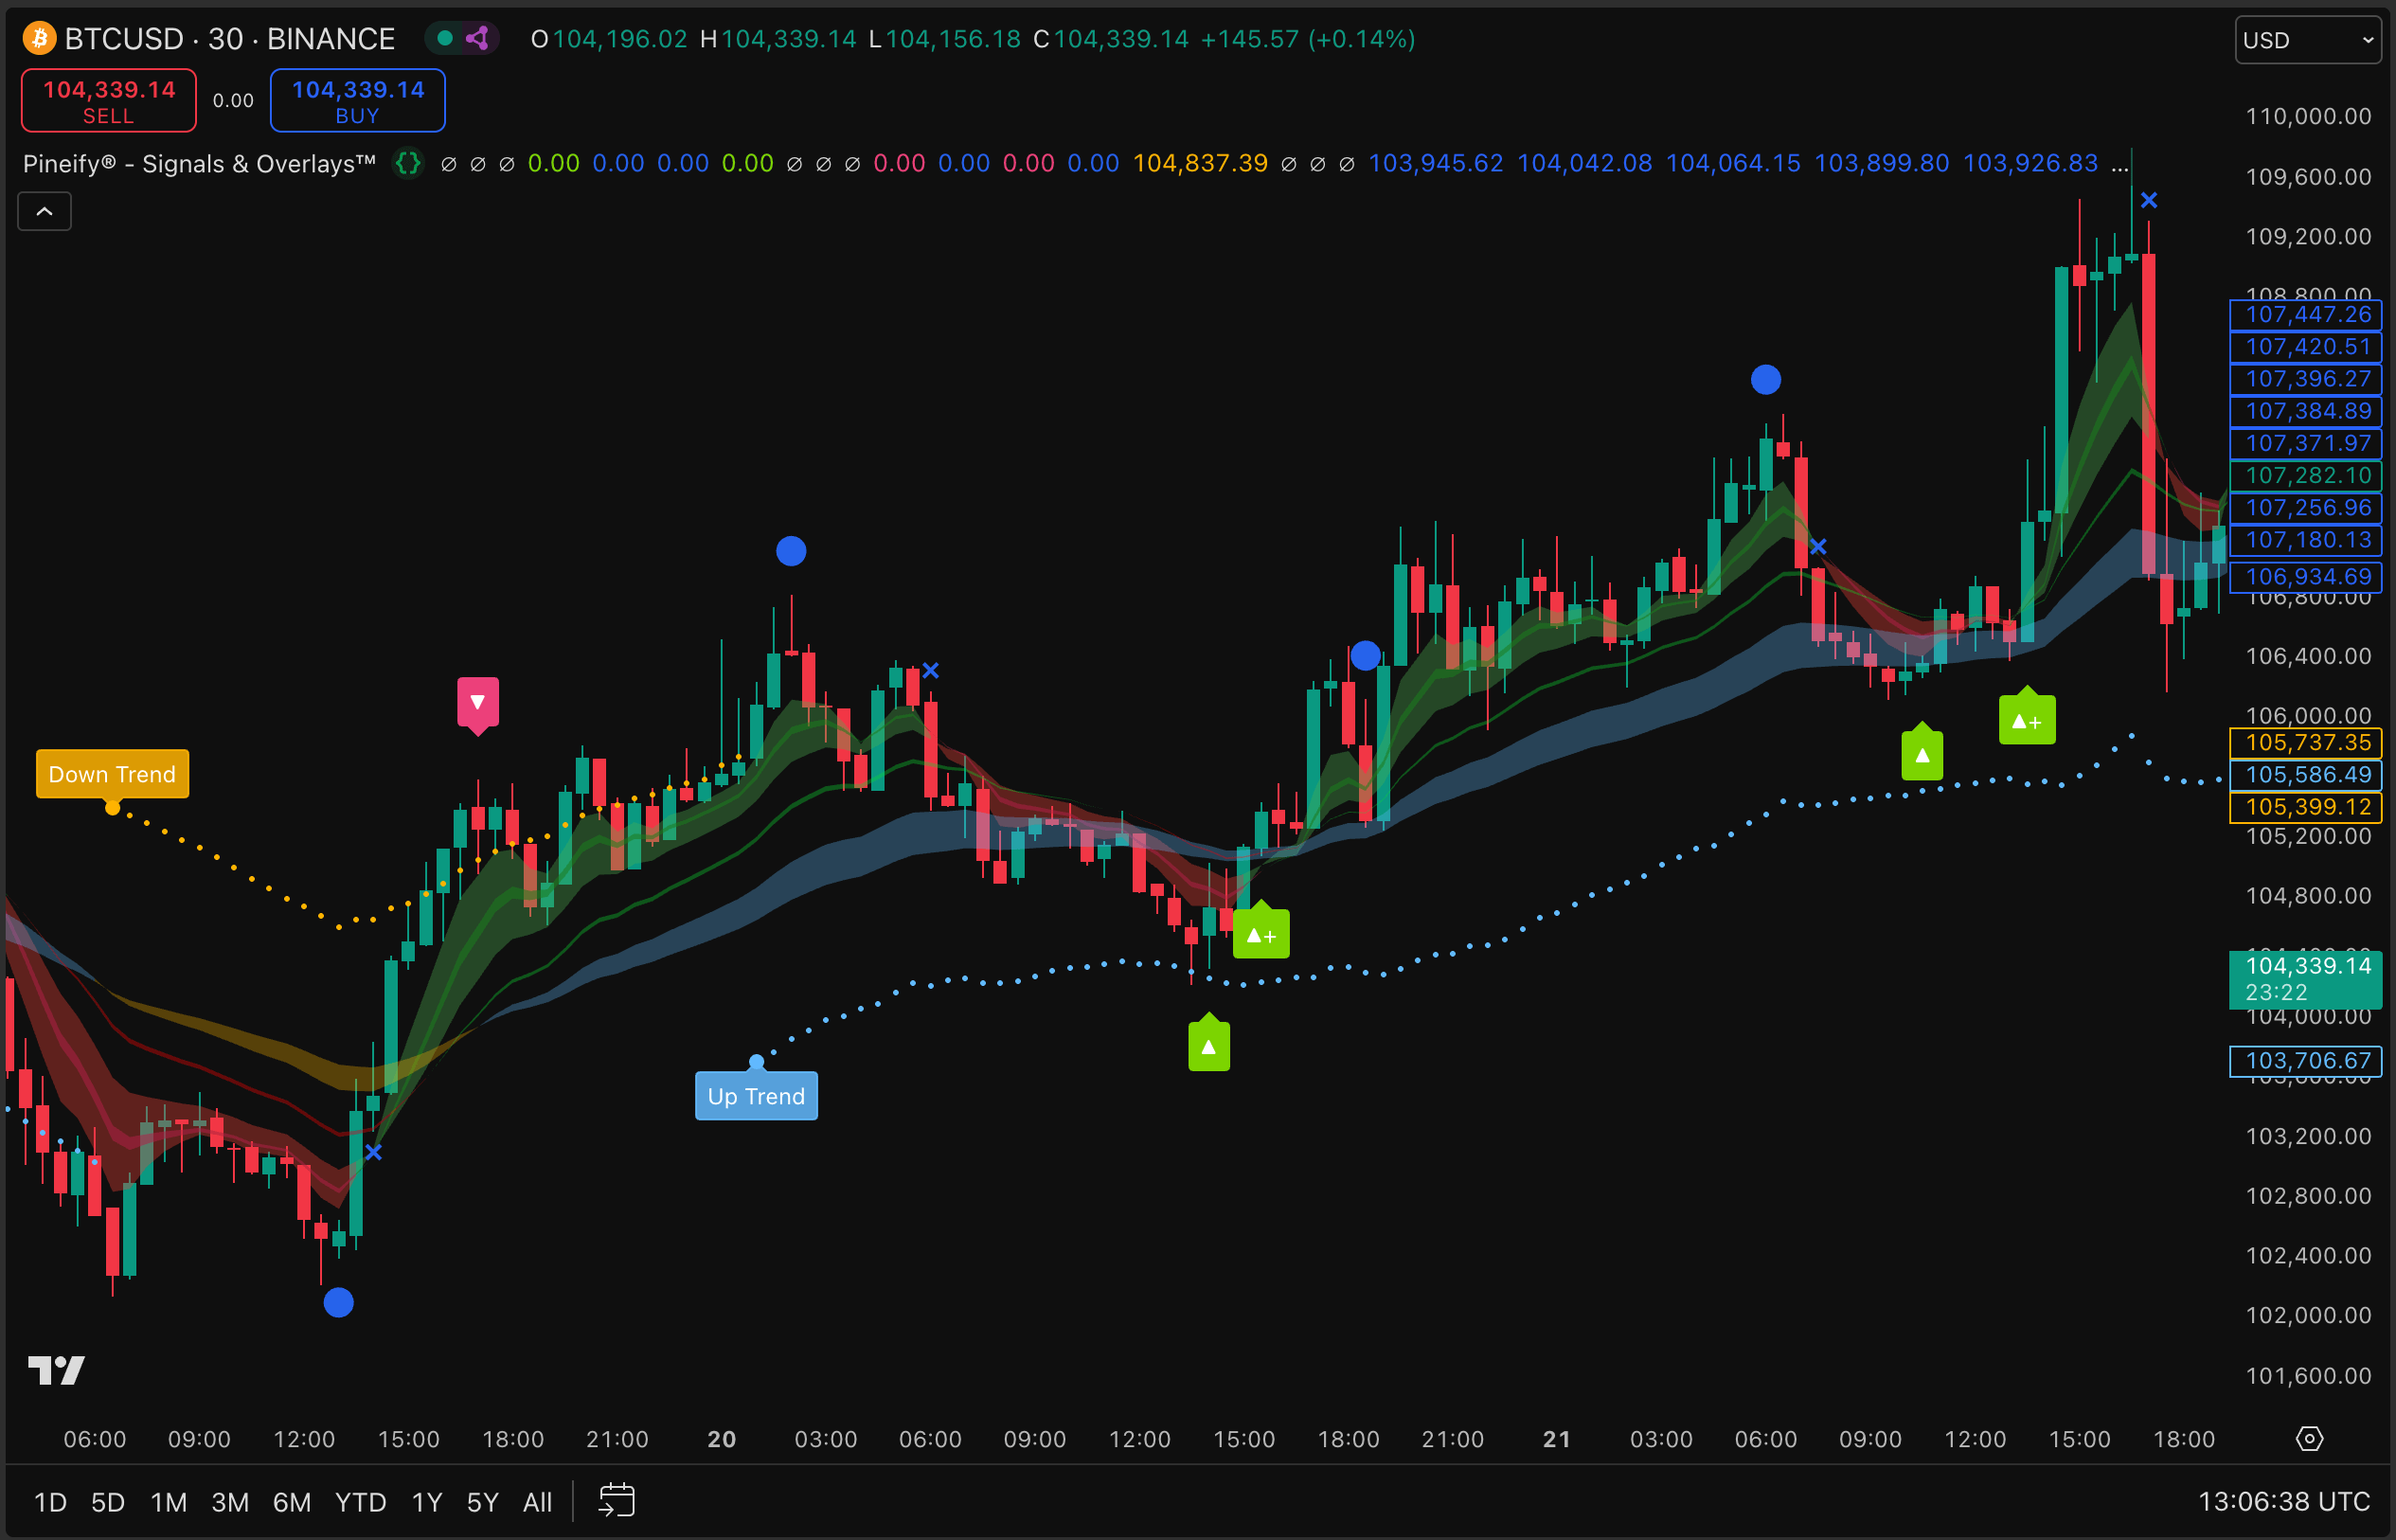
Pineify - Signals & Overlays is the script you select after access is enabled. It sits on top of price action and communicates three things at a glance: dominant trend bias, discrete signal markers, and a stop reference tied to volatility. The landing copy describes the stack as combining algorithmic structure with classical trend ideas, including Dow Theory framing for primary and secondary trend context. I treat that as a narrative about how the model thinks about swings and continuations, not a promise that every alert matches my personal definition of "trend."
If you're new to invite-only tooling, expect a short setup phase: purchase and plan eligibility on the Pineify side, TradingView username pairing, then refresh permissions inside TradingView. Once the script appears under invite-only scripts, adding it is the same mental step as any other indicator, with the extra discipline of verifying you're on the correct account.
Institutional-Grade Signal Design
"Institutional-grade" is marketing language, but it points at a real distinction I care about: how much redundancy exists between intuition and evidence. Tools pitched to professional desks usually assume you'll measure outcomes, keep logs, and compare regimes. Retail charts often optimize for excitement. When I read Pineify's invite-only page, I translate that label into a checklist: explicit trend bias, explicit signal markers, explicit risk referencing, and a story about historical testing rather than only screenshots of one lucky week.
The page also emphasizes Dow Theory principles for primary and secondary trends, plus proprietary algorithmic pattern recognition for timing. I don't need the vendor to teach me finance history mid-session. I need the chart to answer whether the environment favors continuation or reversal, and whether my entry is late in a move. That's the practical read.
What separates serious signal design from toy indicators, in my experience, is whether the vendor acknowledges variance. Markets cluster, gap, and trend-break. A model that looks perfect on one symbol often bruises on another. I keep that in mind even when a page shows strong headline statistics. I also haven't tested this on crypto futures or options — it's a spot chart overlay, and I'd want to see how it handles gap risk before trusting it there.
Performance Context
Performance context is a compass, not a prophecy. Pineify's invite-only page cites three headline stats: more than 100,000 active traders, an 87% win rate from backtesting, and a 412% maximum return per trade. I prefer to read those numbers as orientation points that still require definitions.
Win rate without average win, average loss, sample size, and market regime context can mislead. A high win rate can coexist with small wins and rare large losses, or the opposite. Maximum return per trade is an extreme outcome in a distribution — it's not a baseline expectation for the next trade. The active trader count is social proof of distribution and interest, not evidence that any individual will replicate a specific result.
I still find the trio useful as a quick integrity check against "vague superiority" marketing. It gives me concrete anchors to ask better questions: which instruments were included, which timeframes, whether the methodology was walk-forward or point-in-time. Even when I can't see every internal detail, forcing those questions keeps me from confusing a chart overlay with a finished portfolio system.
Three Core Features
When I evaluate a signal product, I split features into signal quality, regime logic, and execution support. The invite-only page lines up with that structure.
Backtested high win rate is the statistical story. I use backtests to learn how a model behaved historically, not to predict my next week. I look for whether the script's signals are sparse or noisy, whether it clusters entries, and whether it's visually consistent when I roll the chart backward bar by bar.
Dow Theory trend reversals, as described on the page, point to a classical way of thinking about primary and secondary swings. In practice, I care less about the academic label and more about whether the indicator's trend state updates smoothly or whipsaws when the market chops. A Dow-framed model should, in principle, bias me away from fighting the larger swing structure, but I still confirm with structure, levels, and volatility on the chart I actually trade.
Real-time buy and sell alerts are the operational layer. TradingView alerts are only as good as the conditions you attach and the device discipline you maintain. I set alerts after I understand what triggers them, and I avoid stacking redundant notifications that train me to ignore pings.
How to Use the Indicator
The landing page breaks usage into four steps. Here's how I apply them without turning the tool into a mechanical autopilot.
- Add to chart. Open Indicators, go to Invite-only scripts, and select Pineify - Signals & Overlays. I verify I'm on the intended TradingView account and that the script version matches what Pineify documents for subscribers.
- Identify trend using the cloud colors. Blue and green indicate bullish bias; red and yellow indicate bearish bias. I prefer using this as a background filter before I care about individual arrows. If the cloud disagrees with my higher-timeframe thesis, I slow down and resize or skip the setup entirely.
- Execute on the signal icon, with candle close discipline. The page recommends waiting for the candle close to confirm. That single habit removes a surprising amount of intrabar noise, especially on faster charts.
- Manage risk using the ATR line. I place stop logic relative to the ATR stop line as a volatility-aware reference, then move toward break-even when the trade proves itself. The line is a guide, not a substitute for max daily loss rules or position sizing.
That sequence mirrors how many traders already think: filter, signal, confirm, risk. The indicator compresses the filter and signal into visuals so I can spend more time on execution quality and less on indicator clutter.

Trading Styles and Timeframes
Day traders, swing traders, and investors can use the same script with different bar speeds and different patience budgets. The overlay behaves differently depending on how often you want decisions to appear. I treat timeframe choice as a risk decision first and a signal frequency decision second.
Day traders on one-minute to fifteen-minute charts get the most touches. I reduce size, tighten alert hygiene, and insist on alignment with a slightly higher timeframe bias when possible. Without that guard, fast charts become a slot machine.
Swing traders on four-hour to daily charts see fewer signals and more structural context. This is where Dow-style trend thinking tends to feel natural to me, because the swings are wide enough that "primary versus secondary" language matches what I see.
Investors focused on long-term cycles still benefit from a consistent trend filter and alert scaffolding, but I wouldn't confuse monthly patience with ignoring risk. Long holds need explicit drawdown tolerance and portfolio-level limits, not only indicator colors.
Frequently Asked Questions
▶How do I add invite-only indicators to TradingView?
After buying the Advanced Plan, you'll enter your TradingView username and receive access permission automatically. Then open TradingView, click Indicators, go to Invite-only scripts, and select Pineify - Signals & Overlays. Don't panic if it doesn't appear right away — refresh permissions and double-check you're on the same username you submitted.
▶What is an invite-only script on TradingView?
It's a private indicator that requires publisher permission. Unlike public scripts, you can't just search and install it. Access is tied to entitlement, which is why TradingView keeps invite-only scripts in a separate list from the public library.
▶Which platforms does this indicator support?
The script is built for TradingView. If your workflow spans multiple platforms, treat TradingView as the execution charting home for this tool and export decisions manually to your broker setup. I haven't tested it on anything outside TradingView desktop and web.
▶How is the win rate verified?
Pineify describes verification through rigorous backtesting across multiple assets and timeframes. When I evaluate any backtest claim, I still ask what defines a win, how trades are counted, and whether the results are sensitive to slippage and fees. Those details matter more than a single headline percentage.
▶Which timeframes work best?
The product positioning states flexibility from one-minute to daily charts. In practice, day traders often live between one and fifteen minutes, swing traders between four hours and daily, and longer-term investors emphasize daily and weekly context. I prefer picking one primary timeframe and one confirmation timeframe to avoid overfitting my attention.
▶Is technical support provided?
Yes. Subscribers get help with setup and configuration, and Pineify points traders to tutorials and documentation. I still keep my own checklist: correct account, correct script, alert conditions tested on a low-stakes symbol like EURUSD, and risk rules written down before size scales.
Disclaimer
Your money and your life decisions deserve sober framing: trading signals are informational, not personalized advice.
Trading involves substantial risk and isn't suitable for everyone. Past performance, including backtested win rates or maximum trade outcomes, doesn't guarantee future results. Market conditions, liquidity, fees, slippage, and human execution errors can materially change outcomes. Nothing is investment advice, tax advice, or a recommendation to buy or sell any security or derivative.
If you use alerts or signals, you remain responsible for compliance with your jurisdiction, your broker's rules, and your personal risk tolerance. When in doubt, consult a licensed professional. I write from direct experience as a TradingView-heavy user, but your account size, obligations, and constraints may differ completely from mine.