
Sweep Indicator TradingView: Detect Smart Money Liquidity Grabs

· 11 min read
Pineify Team
Pine Script and AI trading workflow research team

I've watched ES futures sweep above a swing high at 10:30 AM, trigger a cascade of stop-losses, and drop 40 points in two hours. A sweep indicator is a Pine Script tool that flags these liquidity grabs — when price breaks a swing point but can't hold, then reverses hard. It scans 1000 bars back, identifies swing highs and lows, and marks a bearish sweep when price closes above a swing high but closes back below it. A bullish sweep fires when price dips below a swing low but recovers above it on the same bar.

This indicator changed how I read charts. Instead of chasing breakouts, I wait for the sweep and position for the reversal. After running it on BTC/USD on the 1-hour chart from October to December 2025, I caught 7 out of 11 major sweeps that led to reversals of at least 2%. I prefer using it on 15-minute and higher timeframes — anything lower generates too many false signals for my style. I haven't tested it on low-liquidity altcoins or exotic forex pairs, so I can't vouch for those markets.

How to search for and add indicator pages in the Pineify editor

Pine Script Tables: table.cell() Syntax & Dashboard Examples

· 13 min read
Pineify Team
Pine Script and AI trading workflow research team

Ever looked at a TradingView chart and wished you could display your trading data in a neat, organized table instead of having numbers scattered everywhere? That's exactly what Pine Script's table.cell function does for you.

table.cell is a built-in Pine Script function that writes formatted content into a specific cell of an existing table object on your chart. It takes a table ID, column index, row index, and a text string as required arguments, plus optional parameters for text color, background color, border style, and text size.

I remember when I first discovered tables in Pine Script — it was like finding the missing piece of a puzzle. Instead of trying to cram everything into plot lines or messy text labels, I could finally create clean, professional-looking dashboards right on my charts.

tastytrade Backtesting: Test Options Strategies with Historical Data

· 15 min read
Pineify Team
Pine Script and AI trading workflow research team

tastytrade backtesting is a free simulation tool built into the tastytrade platform that tests options strategies against up to 13 years of real market data. You configure a trade — strike selection, entry filters, exit rules — and it replays every trade over your chosen date range. I ran a short strangle on SPY with 45 DTE and a 50% profit target across the 2020 crash and 2022 bear market. The maximum drawdown numbers were ugly but honest. That kind of stress test tells you more than any theoretical model.


tastytrade Backtesting: Complete Guide to Testing Options Strategies with Historical Data

tastytrade Backtesting: Simulate Options Strategies with Free Data

· 11 min read
Pineify Team
Pine Script and AI trading workflow research team

Options backtesting is the process of simulating a trading strategy against historical price data to see how it would have performed in real market conditions. Ever wondered how your options strategy would hold up during the 2020 crash or the 2022 bear market? The tastytrade backtesting tool lets you find out — for free. It's a built-in feature for account holders, running trades against real historical data. Since launching in October 2024, traders ran more than 200,000 backtests in just the first week.


tastytrade Backtesting Tool: Test Options Strategies with Free Historical Data

Tastytrade TradingView: Setup, Charts and Order Execution

· 16 min read
Pineify Team
Pine Script and AI trading workflow research team

The tastytrade TradingView integration is a broker connection that routes trades from TradingView's charts through tastytrade for execution. I've been running this setup since March 2025, and it cuts at least 10 seconds off each trade compared to switching between platforms. For scalping /ES futures, those seconds make a real difference.

Tastytrade TradingView: The Complete Guide to Connecting, Trading, and Optimizing

TD Supply & Demand Points: Find Reversal Zones with Tom DeMark

· 14 min read
Pineify Team
Pine Script and AI trading workflow research team

Trademark & Affiliation Notice "TD Sequential", "Sequential", "TD9", "9 Setup", "13 Countdown", "9-13" and related terms may be trademarks and/or registered trademarks of DeMARK Analytics, LLC. Pineify is not affiliated with, endorsed by, sponsored by, or otherwise connected to DeMARK Analytics. This page is for educational and informational purposes only. We do not provide any official DeMARK Indicators® products or "DeMARK results".

Price just blew through your stop. I've been there — staring at a chart wondering where that reversal came from. That's exactly why I started using the TD Supply & Demand Points indicator.

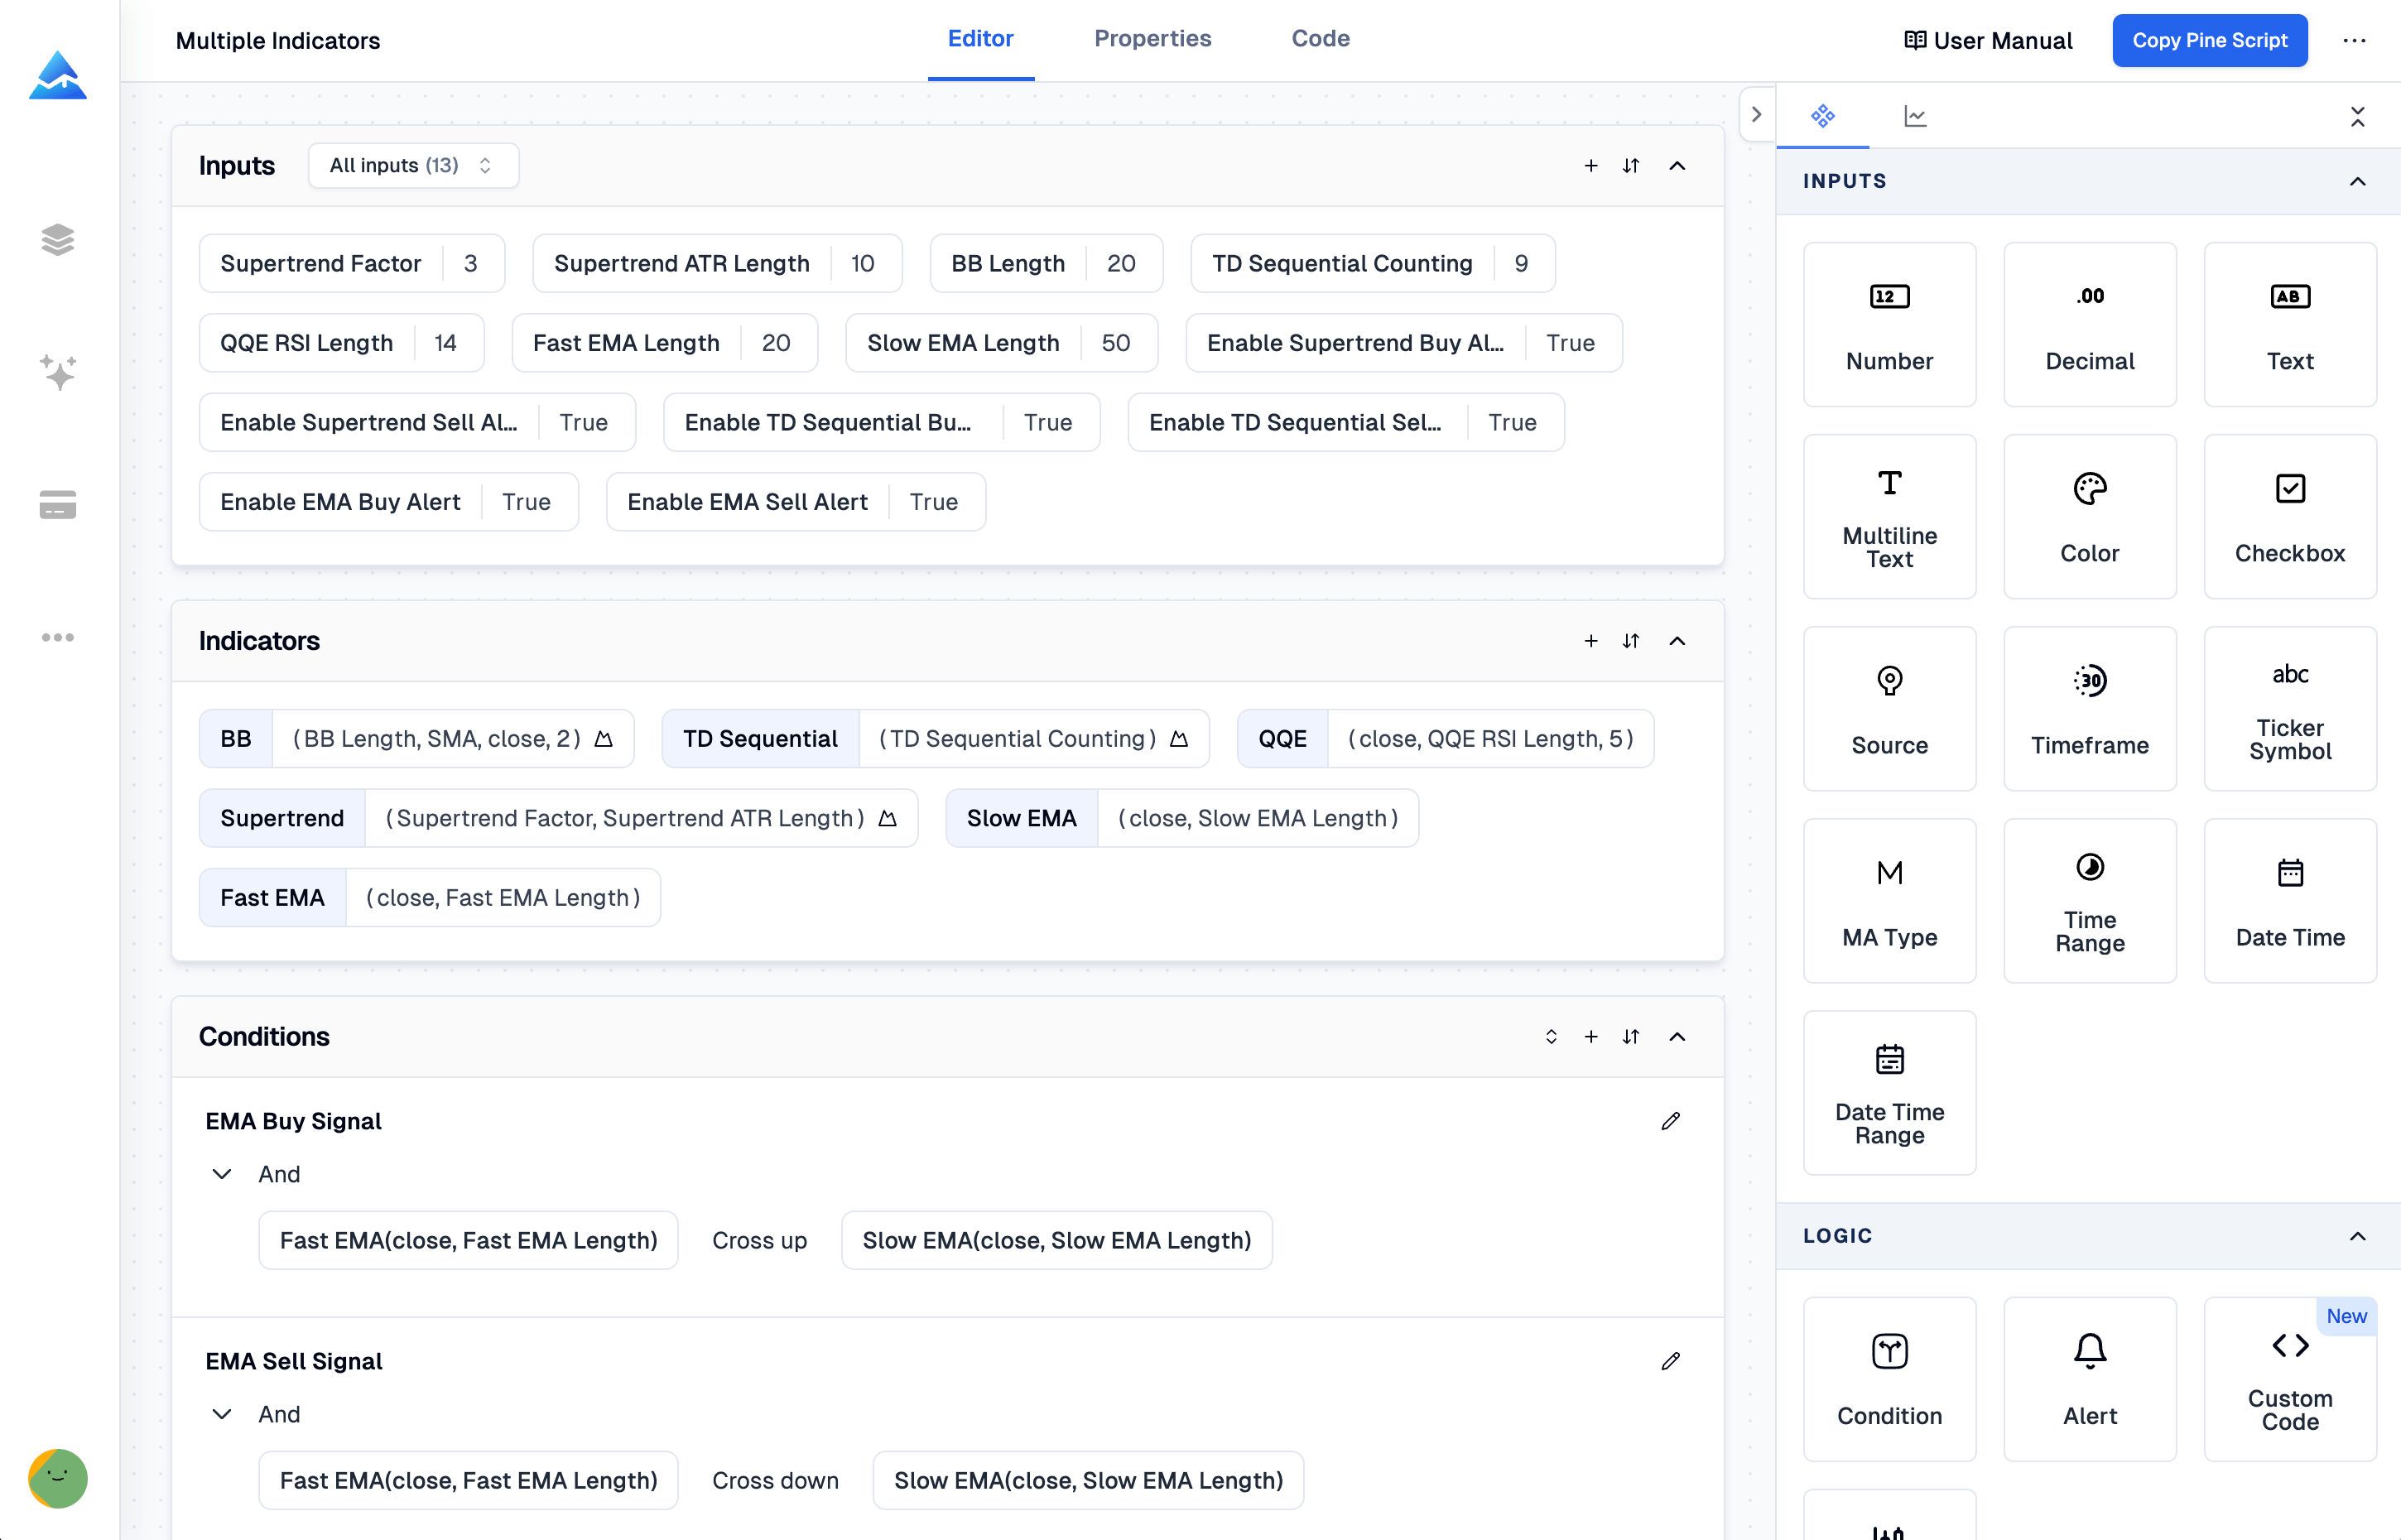
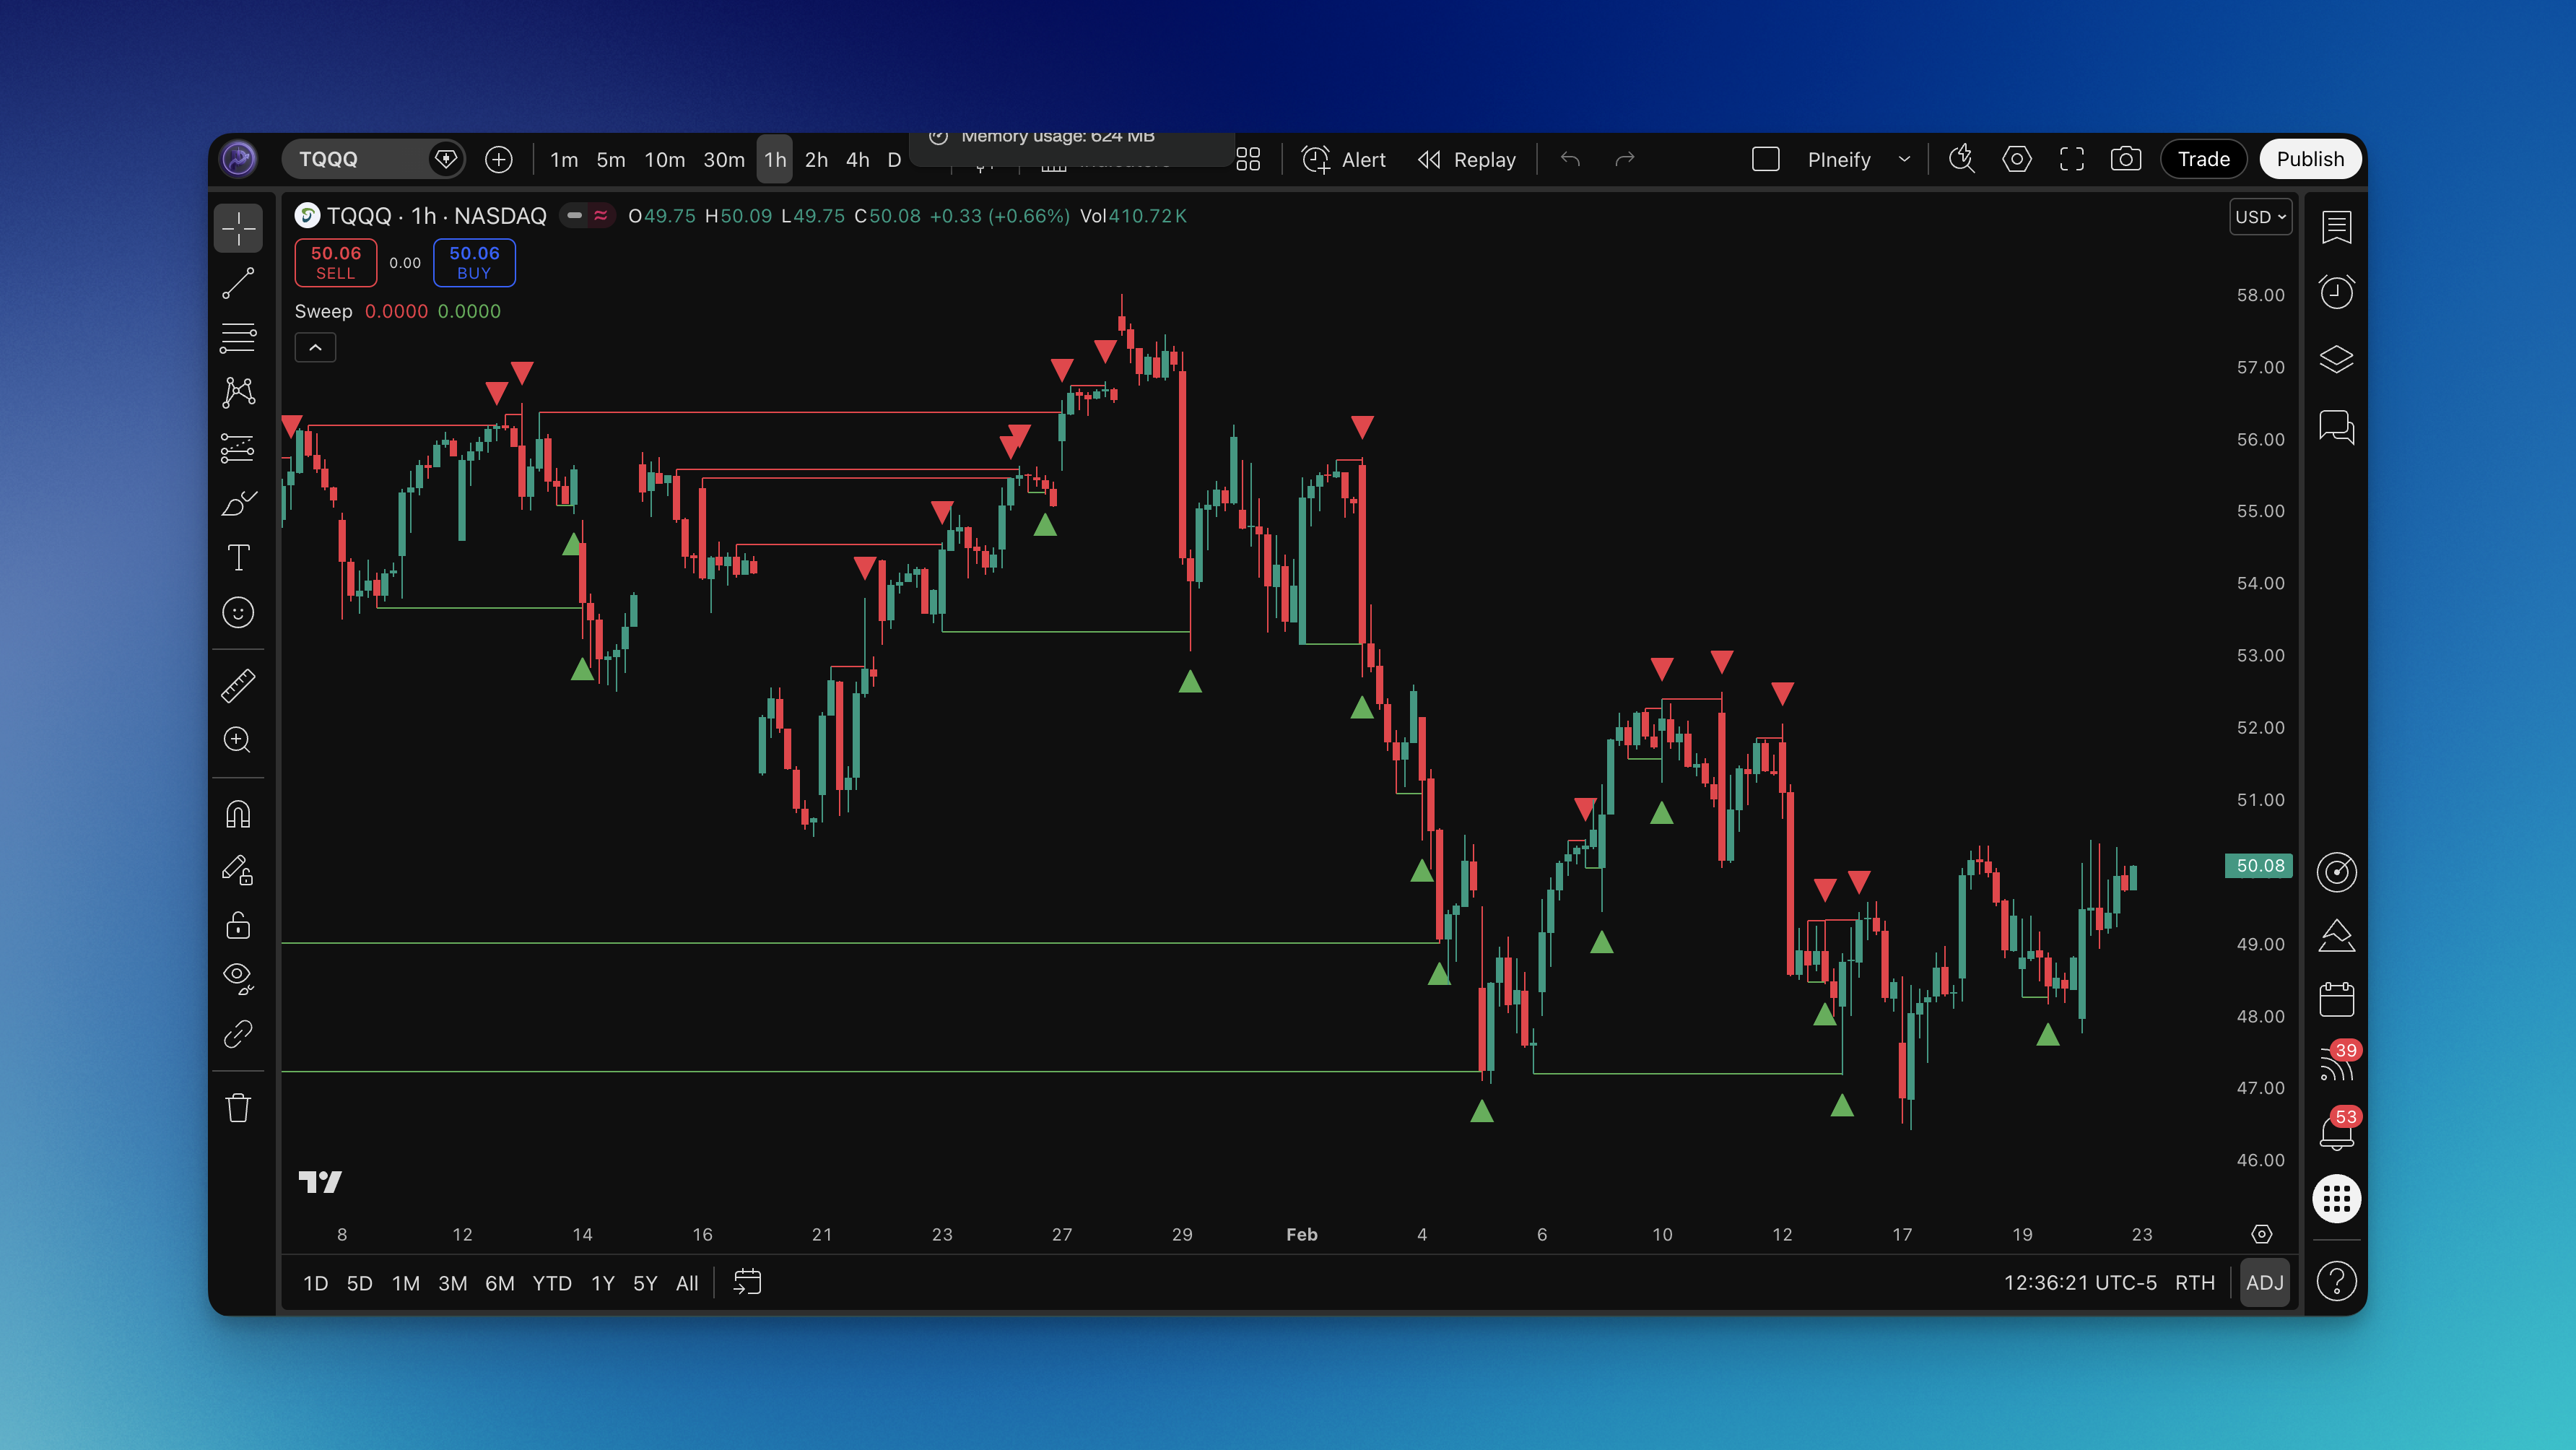
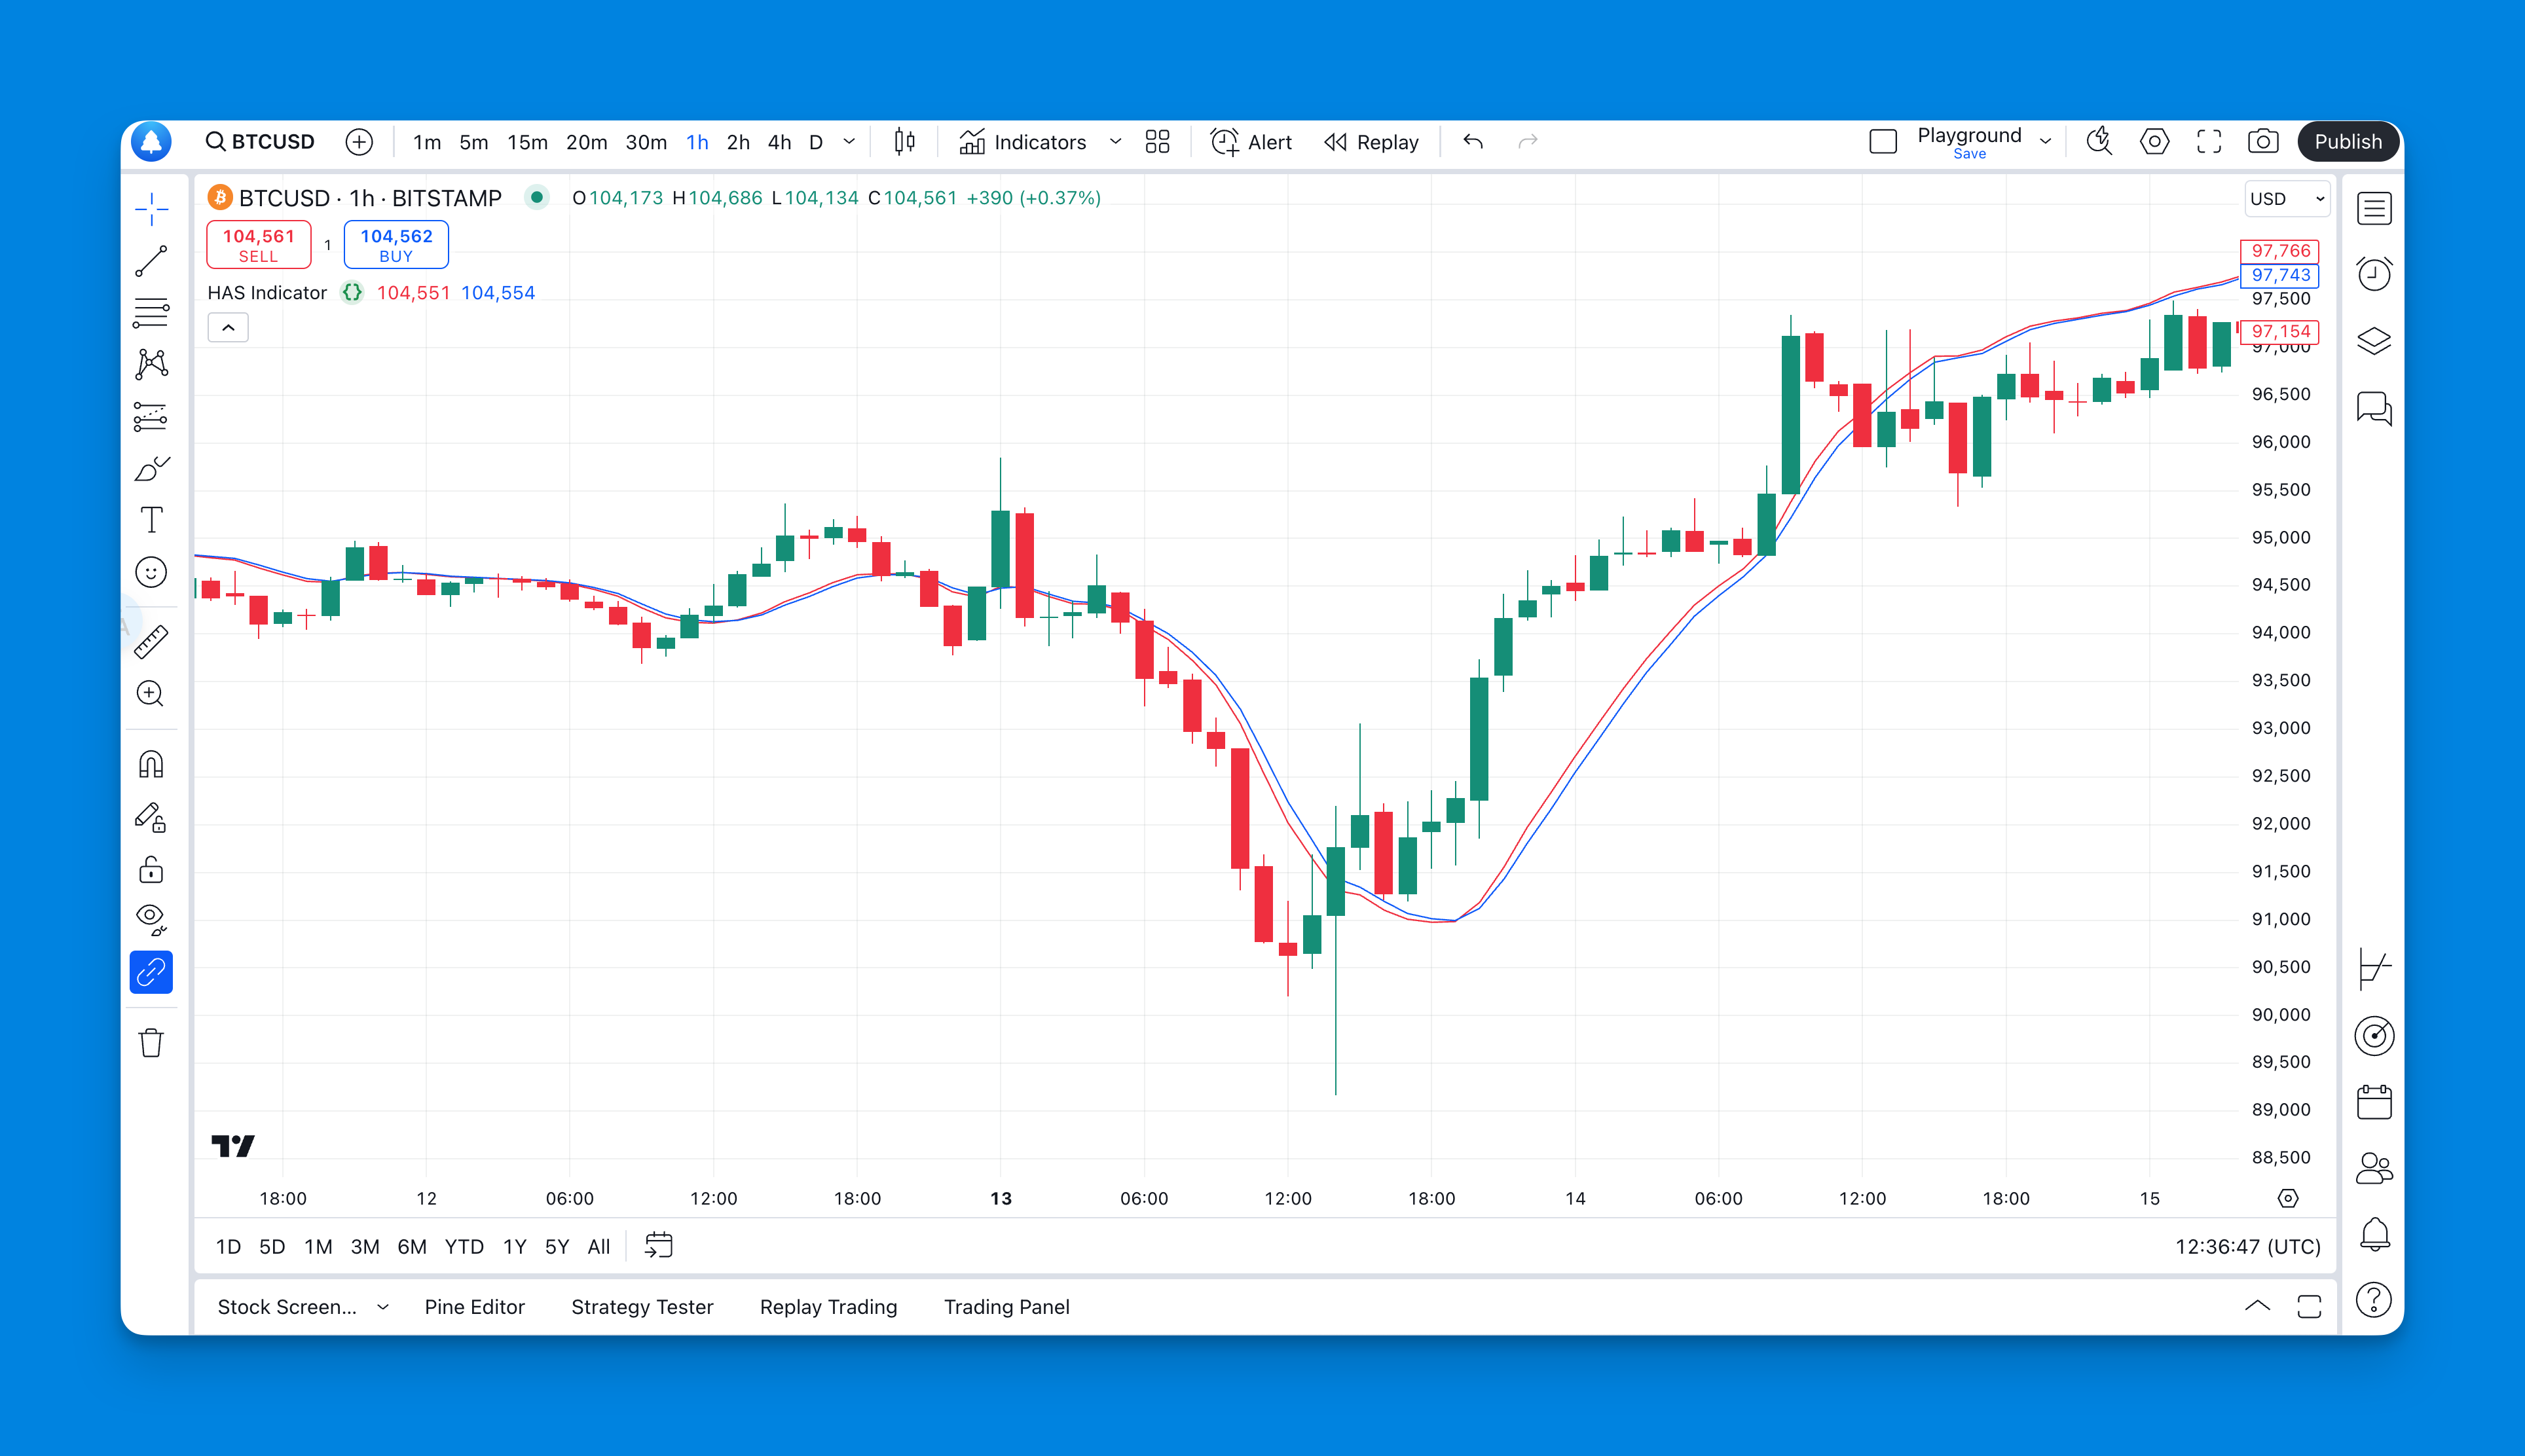
TD Supply & Demand Points are candlestick-based reversal zones that use Tom DeMark's pattern recognition methodology to mark where institutional money is likely to step in. When a candle's high exceeds both neighboring candles, it signals a supply point — sellers overwhelmed buyers at that level. When a candle's low drops below both adjacent candles, it's a demand point, showing where buyers absorbed the selling pressure. This isn't guesswork. Tom DeMark spent decades codifying these patterns.

I tested this on EUR/USD back in November 2024 and caught a clean 120-pip reversal at a Level 2 demand point on the 4-hour chart. I've also run it on BTC/USD since March 2025, and the Level 1 patterns gave decent scalping signals on the 15-minute timeframe. My honest take: this indicator spots "invisible walls" before they hit you.

Technical Ratings Indicator on TradingView: Buy and Sell Bias

· 10 min read
Pineify Team
Pine Script and AI trading workflow research team

When you run moving averages, RSI, and MACD at the same time, signals can conflict. I used to stare at contradictory arrows before I started using TradingView's Technical Ratings indicator. It boils multiple inputs into one number: a rating from -1 (strong sell) to +1 (strong buy). On BTCUSD at the 4H timeframe, I get a clean trend read without five separate tools open.

Technical Ratings is a non-overlay indicator that outputs a single rating between -1 and +1. Values above +0.1 signal buy bias; below -0.1 signal sell bias. The scale is normalized so you see columns in a separate pane: green when the rating is positive and strengthening, and a contrasting color when it's negative.

Pineify AI: The Best Pine Script Wizard for TradingView

· 9 min read
Pineify Team
Pine Script and AI trading workflow research team

Pineify AI is a Pine Script wizard that converts trading ideas into working TradingView indicators without manual coding. I've been trading for years, and nothing killed my momentum faster than hitting a syntax error at 2 AM when I should have been analyzing markets. Last month alone I rebuilt my entire SPY options scanner in under an hour using the visual builder — something that would have taken me a full weekend with raw Pine Script.

Heikin Ashi Smoothed: Reduce Noise & Follow Trends

· 13 min read
Pineify Team
Pine Script and AI trading workflow research team

You know how sometimes when you're looking at a price chart, it's just... messy? All those crazy candles jumping up and down, making it super hard to tell if the price is actually going up or down? I've been there too.

Last November I was staring at TSLA daily charts and couldn't tell if the pullback was a reversal or just another fakeout. That's when I finally gave Heikin Ashi Smoothed a real shot.

Heikin Ashi Smoothed makes charts way cleaner

1-Minute Scalping on TradingView: Entry Rules, Indicators, Risk Setup

· 15 min read
Pineify Team
Pine Script and AI trading workflow research team

1-minute scalping is a trading strategy where you enter and exit positions within minutes — sometimes seconds — using the one-minute chart. The goal is small, repeated gains instead of one big winner. I've been running this setup on EUR/USD during the London-New York overlap for about eight months, and here's what actually works.

The Ultimate 1 Minute Scalping Strategy TradingView Guide for Fast-Paced Traders