Pineify AI: The Best Pine Script Wizard for TradingView
· 9 min read
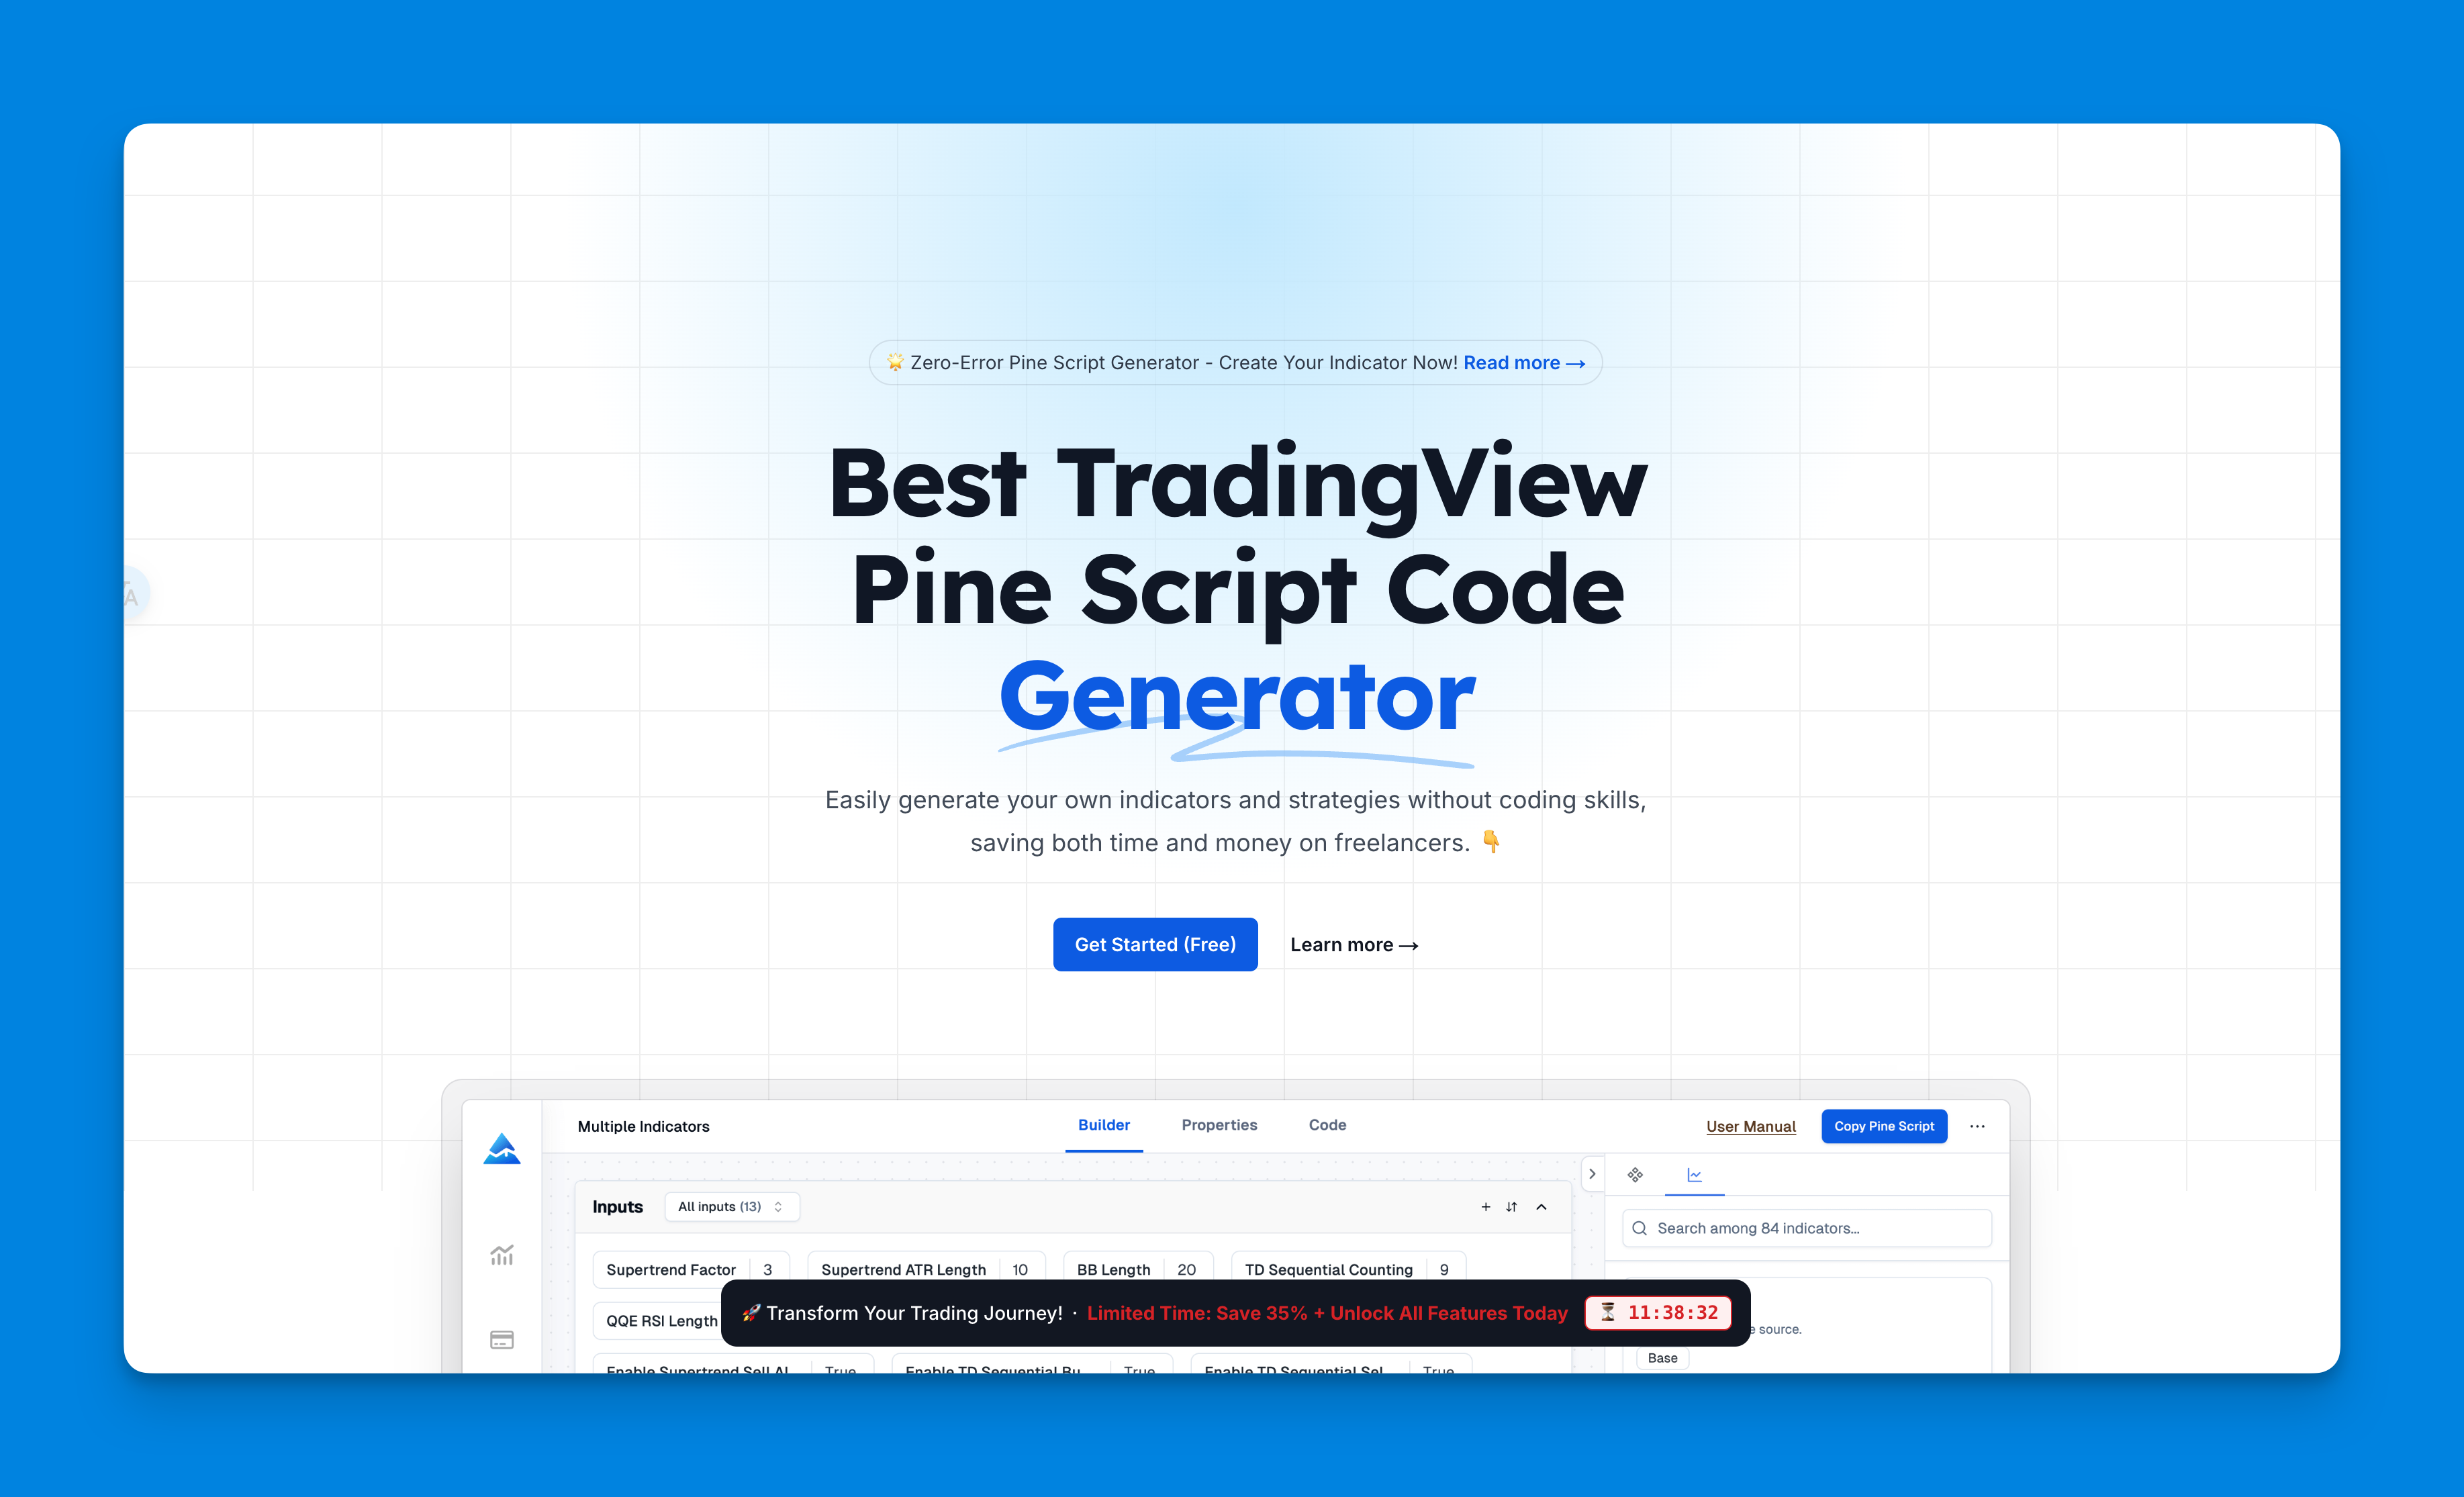
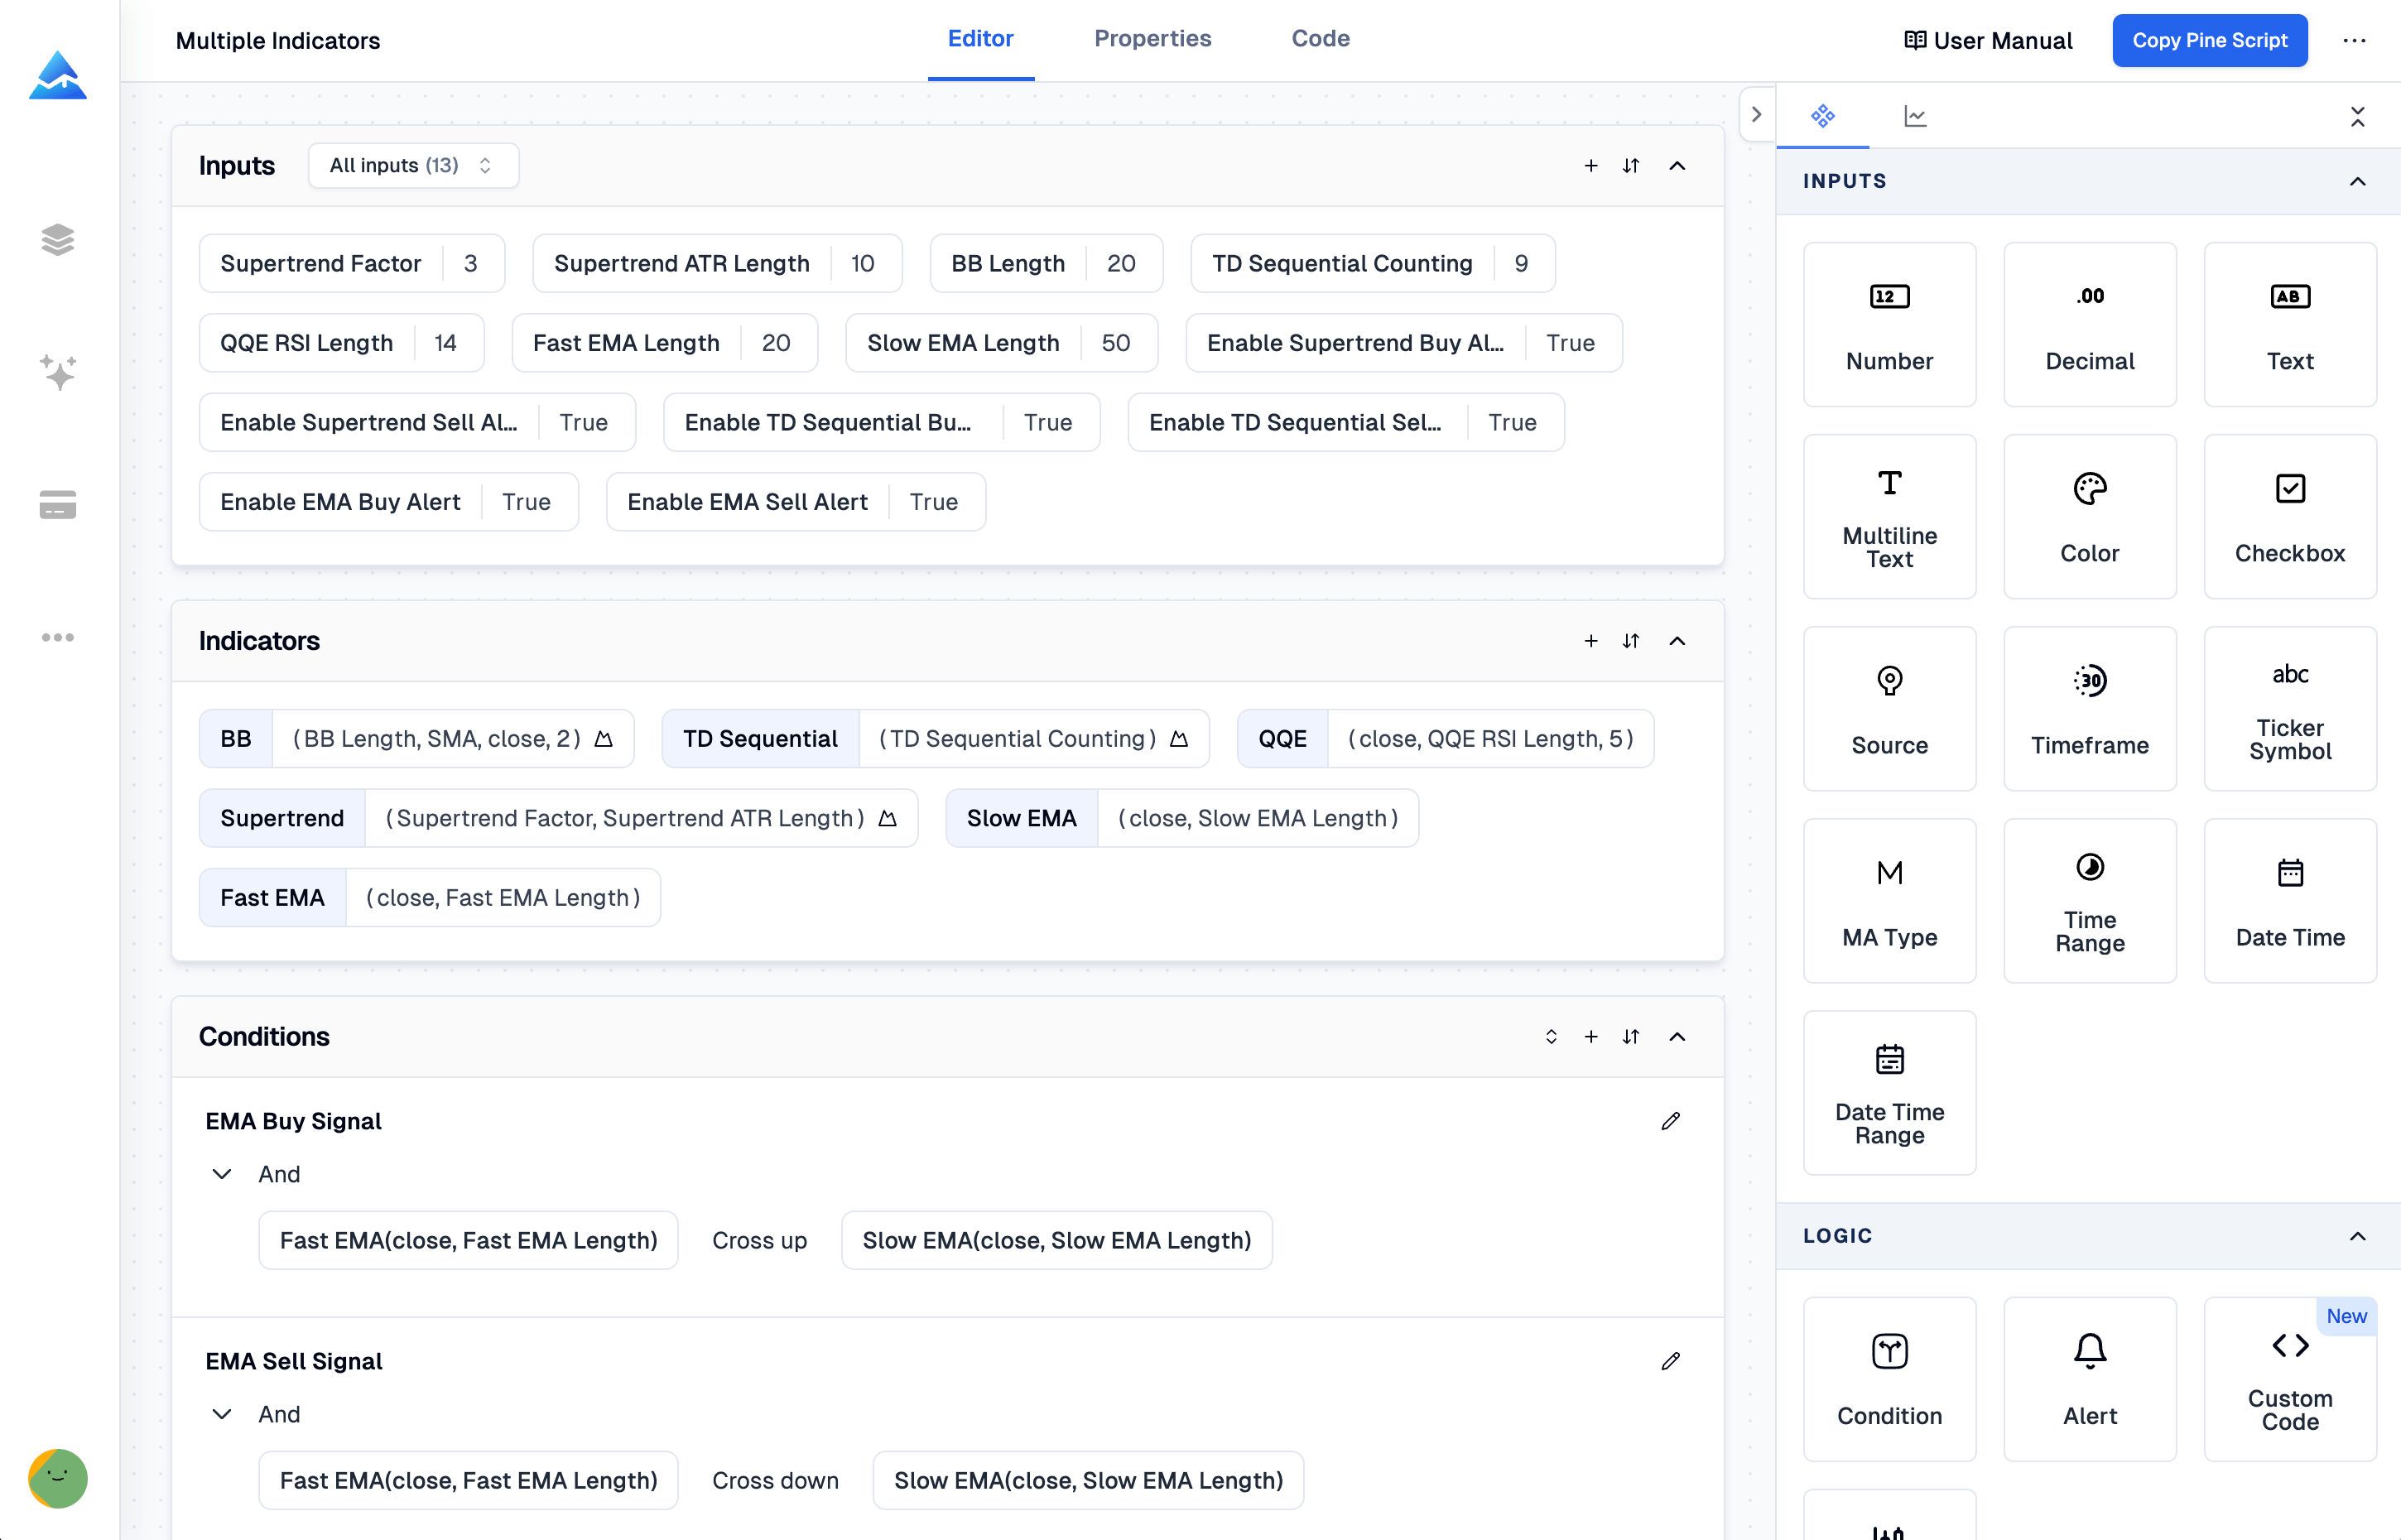
Pineify AI is a Pine Script wizard that converts trading ideas into working TradingView indicators without manual coding. I've been trading for years, and nothing killed my momentum faster than hitting a syntax error at 2 AM when I should have been analyzing markets. Last month alone I rebuilt my entire SPY options scanner in under an hour using the visual builder — something that would have taken me a full weekend with raw Pine Script.