Technical Ratings Indicator on TradingView: Buy and Sell Bias
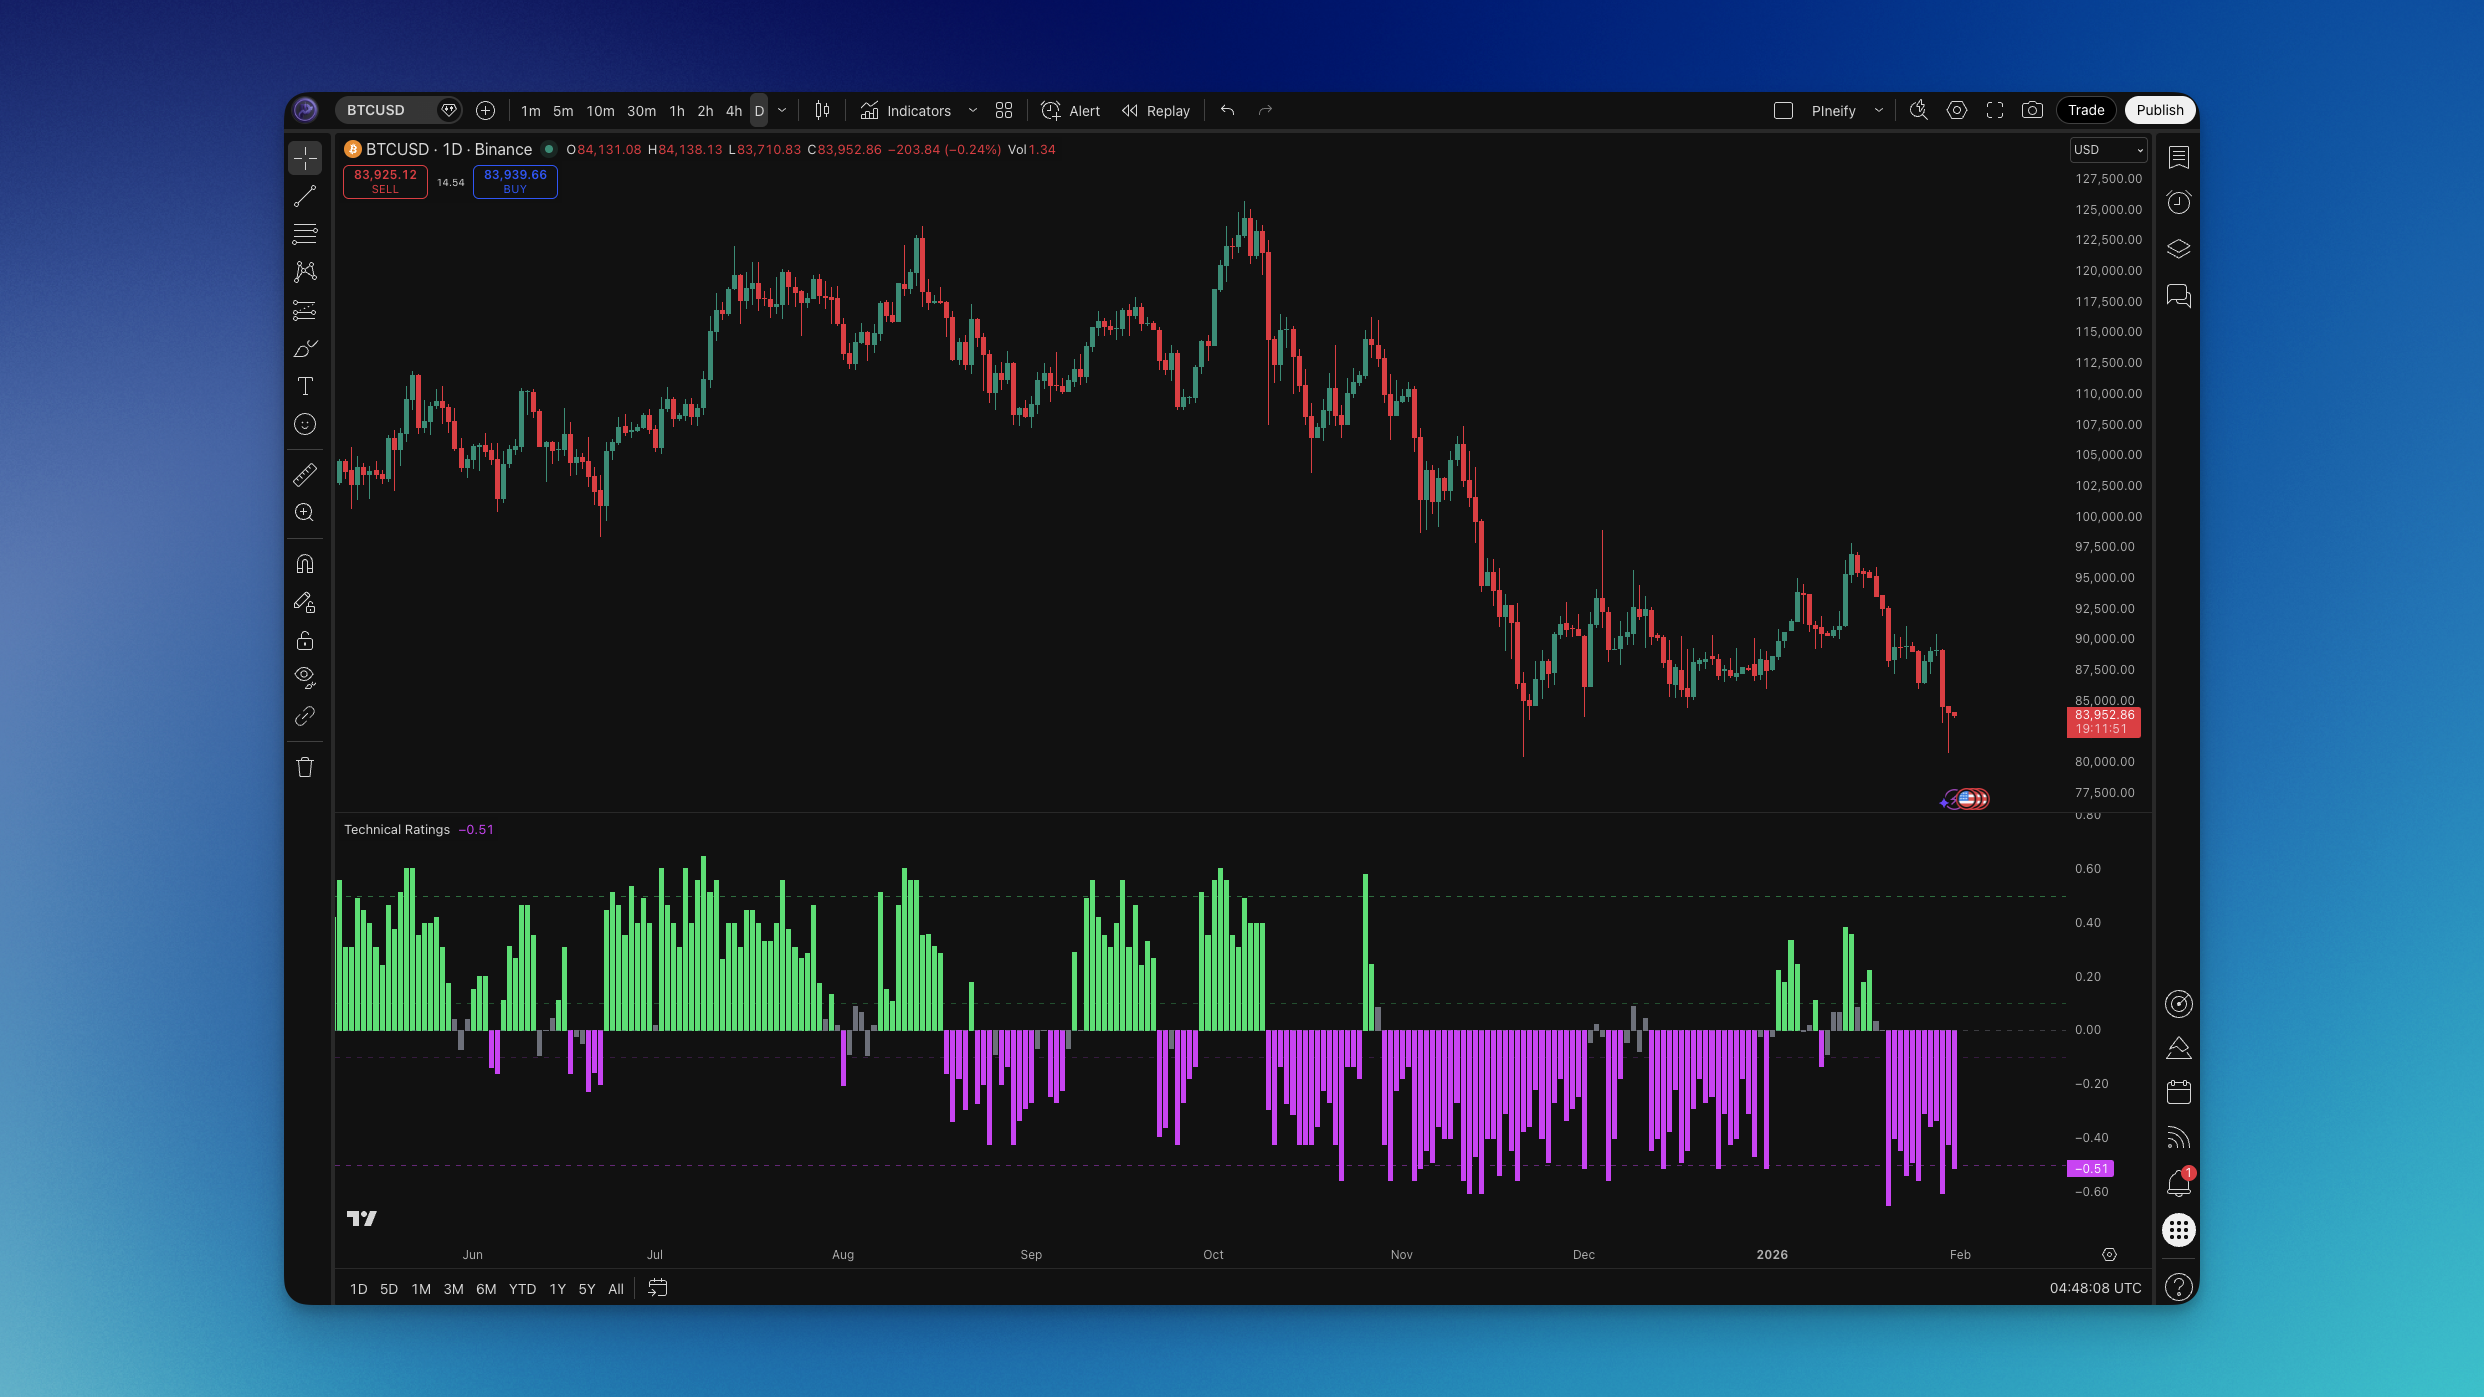
When you run moving averages, RSI, and MACD at the same time, signals can conflict. I used to stare at contradictory arrows before I started using TradingView's Technical Ratings indicator. It boils multiple inputs into one number: a rating from -1 (strong sell) to +1 (strong buy). On BTCUSD at the 4H timeframe, I get a clean trend read without five separate tools open.
Technical Ratings is a non-overlay indicator that outputs a single rating between -1 and +1. Values above +0.1 signal buy bias; below -0.1 signal sell bias. The scale is normalized so you see columns in a separate pane: green when the rating is positive and strengthening, and a contrasting color when it's negative.
What is Technical Ratings?
The indicator blends two sub-ratings: one from moving averages (trend) and one from oscillators (momentum). The formula is:
- rating_tot = (MA rating × weight) + (oscillator rating × (1 − weight))
Default weight is 50%, so MAs and oscillators contribute equally. You can set Rating Uses to 0 (both), 1 (MAs only), or 2 (oscillators only). For AAPL on the daily, I keep the weight at 55% and Rating Uses at 0. I haven't tested oscillators-only mode in a sideways market, but I'd expect more false reversals.
Reference lines are usually drawn at +0.5 (strong buy), +0.1 (buy), 0 (neutral), -0.1 (sell), and -0.5 (strong sell). The plot color reflects gradient level so you see not only the level but also whether bias is strengthening or fading. Pair it with ADX to confirm whether the trend behind the rating has real strength.
How to Add Technical Ratings to TradingView
You can use TradingView's built-in Technical Rating if it's in your indicator list, or add it through Pineify in minutes.

Through Pineify:
- Open the Pineify editor and go to the indicator library.
- Search for "Technical Ratings" (or "Ratings").
- Select it and add to your script.
- Adjust inputs: Higher Timeframe, Repainting on/off, Rating Uses (0/1/2), Weight of MAs (0–100), Plot Style, and Width.
- Generate the Pine Script and copy it to TradingView's Pine Editor, or use Pineify's deployment flow to add it to your chart.
Key settings:
- Higher Timeframe: Leave empty to use chart timeframe. Set a higher timeframe for a non-repainting rating from that level.
- Repainting: On updates the rating on the current bar with each tick. Off shows last confirmed value.
- Rating Uses: 0 = MAs and Oscillators, 1 = MAs only, 2 = Oscillators only.
- Weight of MAs (%): 50 is equal; increase for more trend, decrease for more momentum.
The full Pine Script indicator library has many more options if you want to compare.

How to Use Technical Ratings (Practical Trading Strategies)
Here are concrete ways to use the gauge in your trading.
Strategy #1: Bias filter for trend entries
- Setup: Use Technical Ratings on the same timeframe as your chart (or one step higher).
- Entry: Go long when the rating crosses above +0.1 and stays positive; short when it crosses below -0.1 and stays negative. I like pairing this with a break of the 20 EMA on EURUSD for confirmation.
- Stop-loss: Below the recent swing low (longs) or above the recent swing high (shorts), or use ATR for volatility-based stops.
- Take-profit: First target at a nearby structure or 1.5–2× risk.
Strategy #2: Strong buy / strong sell zones
- Setup: Keep default reference lines at ±0.5 and ±0.1.
- Entry: Look for longs when the rating reaches or exceeds +0.5; shorts at or below -0.5. Require price action confirmation.
- Stop-loss: Beyond the candle or structure that triggered the extreme.
- Take-profit: Scale out as the rating moves back toward 0.
Strategy #3: Zero-line cross with confirmation
- Setup: Use rating as trend filter: above 0 = longs only; below 0 = shorts only.
- Entry: Enter on your preferred signal (pullback, breakout) only when the rating is on the correct side of zero.
I've used the gauge as a filter on my 1H charts for months. It cuts counter-trend noise when I only take longs above +0.1 and shorts below -0.1. It's not perfect — in tight ranges the rating hovers near 0 and I still rely on support and resistance to pick entries.
Best Technical Ratings Settings
Optimal settings depend on your timeframe and style.
| Setting | Scalping (1-5m) | Day Trading (15-60m) | Swing (4H-D) | Position (Weekly) |
|---|---|---|---|---|
| Rating Uses | 0 (both) | 0 | 0 or 1 | 0 or 1 |
| MA Weight | 40-50% | 50% | 50-60% | 55-65% |
| Repainting | On or Off | Off | Off | Off |
| Plot Style | Columns/Histogram | Columns/Line | Line/Area | Line |
In choppy or sideways markets, the rating may hover near 0 and produce small crosses. I add a volatility filter — only trade when price stays above the 50 MA — to reduce the noise.
Advanced Technical Ratings Techniques
Multi-timeframe setup: Run the indicator with a higher timeframe (e.g. 4H or daily) so the rating reflects the bigger picture. I use it as a filter: take longs only when the higher-timeframe rating is above 0, and shorts when it's below 0. On BTCUSD, this alone cut my false entries by a noticeable margin.
Combining with other indicators: Technical Ratings gives bias. Add RSI for overbought/oversold or volume for confirmation. For example, long when rating > +0.1 and RSI bounces from oversold; short when rating < -0.1 and RSI fails at overbought.
Pitfalls: No indicator works every time. Don't trade the rating alone during news events or low liquidity. Use stops. If you set a higher timeframe for non-repainting, remember the current bar can still change until that higher-timeframe bar closes.
How to Backtest Technical Ratings
In the Pineify editor you can define entry and exit conditions based on the rating (cross above +0.1 for long, below -0.1 for short), add market orders, set take-profit and stop-loss levels, and optionally trail the stop.
Keep risk tight: 1–2% per trade, consistent stops, no over-leveraging. Backtesting shows how signals would have performed historically. It doesn't guarantee future results — run a demo before going live.
FAQs
What timeframe works best for Technical Ratings?
Any timeframe works. For day trading, I prefer 15m to 1H. For swing trading, 4H or daily. Setting a higher timeframe for the rating (via the Higher Timeframe input) gives steadier signals on your chart.
Should I use MAs, oscillators, or both?
Both (Rating Uses = 0) is the safest start. MAs only (1) if you care more about trend. Oscillators only (2) if momentum is your priority. I'd start at 0 with 50% weight.
Why does the rating change on the current bar?
Repainting is on — the value updates with each tick. Turn it off to see only confirmed values, or use a higher timeframe so updates happen only when that bar closes.
Can I use Technical Ratings for crypto and forex?
Yes. The -1 to +1 scale works the same. Crypto moves faster, so I add wider stops. Forex on 15m–4H works well with the same settings.
How do I avoid false signals?
Use the rating as a filter — only long above +0.1 — and require price confirmation. Avoid trading near 0. Pair with support/resistance or volume to improve timing.
What does Weight of MAs mean?
It controls how much the MA-based rating counts vs the oscillator-based rating (0–100%). 50% is equal. Higher = more trend emphasis, lower = more momentum.
How is Technical Ratings different from RSI or MACD?
Technical Ratings blends multiple moving averages and oscillators into one normalized -1 to +1 score. RSI or MACD each reflect a single calculation. The rating gives a broader consensus.