Moving Average Ribbon Strategy: Spot Trends and Time Entries

· 15 min read
Pineify Team
Pine Script and AI trading workflow research team

I used to trade with a single 20-period EMA and kept getting faked out on false breakouts. Then I stacked eight EMAs on my chart and the picture got a lot clearer. A Moving Average Ribbon is multiple moving averages with different periods plotted together on one chart. When they spread apart, momentum is strong. When they squeeze, it's fading. You can read the market's mood at a glance instead of guessing from one line.

Moving Average Ribbon Trading Strategy: Using Multiple Moving Averages to Read Trend Strength

Pineify EMA Strategy: TradingView Guide for Automated Signals

· 17 min read
Pineify Team
Pine Script and AI trading workflow research team

I've been trading with the Pineify EMA Strategy for months, and it's the closest thing to an automated edge I've found on TradingView. The Pineify EMA Strategy is a multi-timeframe system built on three Exponential Moving Averages — short, medium, and long. It waits until all three align before generating a signal. No coding required.

Master the Pineify EMA Strategy: Ultimate TradingView Guide for Automated Signals

Supertrend Strategy: Trend-Following Trading with ATR Signals

· 15 min read
Pineify Team
Pine Script and AI trading workflow research team

You're watching a stock drift sideways for hours. Then one candle closes above the Supertrend line, and the line flips from red to green. That's your signal. The Supertrend indicator is a trend-following tool that plots a dynamic band on your price chart using Average True Range (ATR). When price closes above the line, the trend is up. Below it, the trend is down. I've been using it on BTC/USD daily charts since late 2023, and it catches roughly 60% of major directional moves when paired with a basic volume filter.

Master the Supertrend Strategy: Your Complete Guide to Trend-Following Trading Success

Trading Journal Mood Tracking: Build Discipline and Self-Reflection

· 18 min read
Pineify Team
Pine Script and AI trading workflow research team

Trading journal mood tracking is logging your emotional state alongside each trade so you can spot psychological patterns that hurt your performance. I learned this the hard way after three months of gains evaporated in a single week of revenge trading on SPY options. The trades looked fine on the chart — entries at resistance, defined risk. The problem was in my head, not on the screen.

Master Trading Psychology with Mood Tracking Journal for Discipline

Premium Pine Script Indicators for TradingView: What to Know

· 16 min read
Pineify Team
Pine Script and AI trading workflow research team

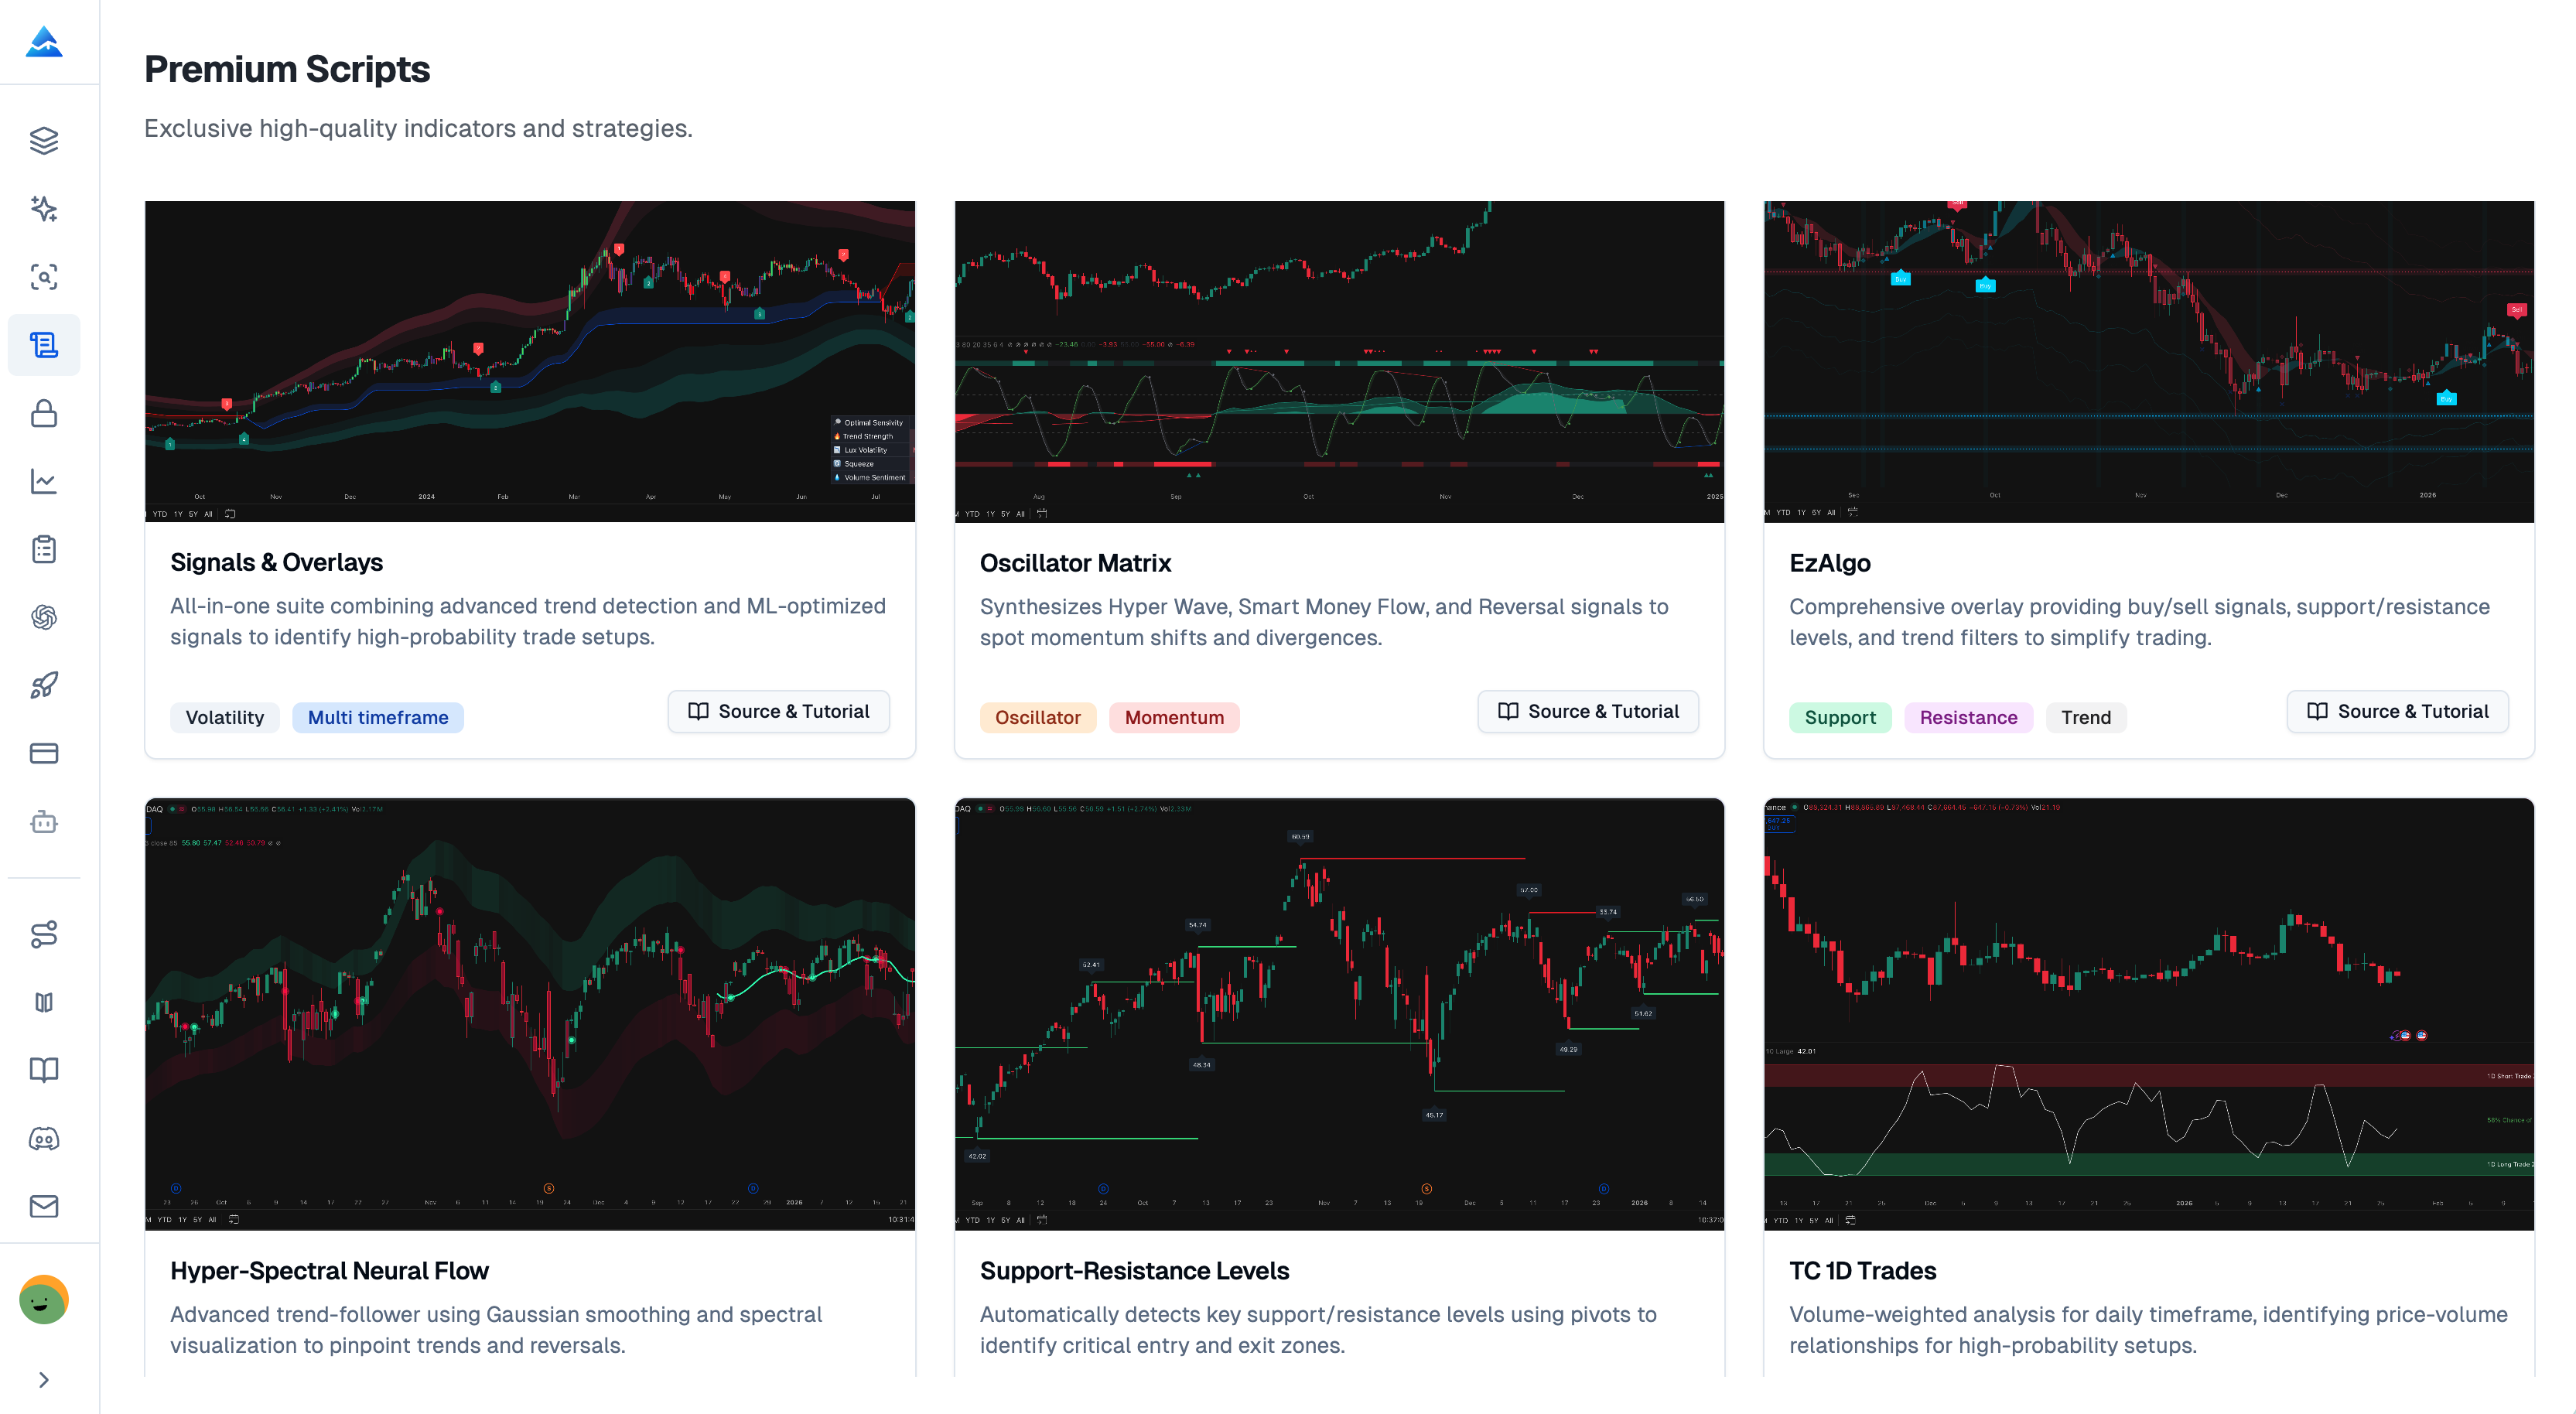
I built my first Pine Script indicator for Tesla (TSLA) back in early 2024. Ten lines of code gave me a moving average crossover alert I still use every week. Pine Script is TradingView's language for creating custom indicators, strategies, and screeners that run directly on live charts. It handles price, volume, and volatility across different timeframes with a fraction of the code you'd need in Python or JavaScript.


Master TradingView with Premium Pine Script Indicators | Complete Guide

Liquidity Sweeps: How to Optimize Your Business Cash Flow

· 13 min read
Pineify Team
Pine Script and AI trading workflow research team

Look, I get it. You're staring at bank statements showing thousands—maybe millions—of dollars sitting in operational accounts, earning basically nothing. Meanwhile, you're paying interest on credit lines. Your cash management feels like trying to herd cats.

A liquidity sweep is an automated technique that moves idle cash from multiple accounts into a central pot where it can earn interest or pay down debt. It's the simplest fix I know for idle cash that most finance teams either don't know about or think is too complicated to set up. But I've seen companies from $2M startups to $50M manufacturers pull this off with surprisingly little effort.

Pine Script array.push() — How to Add Elements to Arrays

· 9 min read
Pineify Team
Pine Script and AI trading workflow research team

I remember my first attempt at tracking price highs across bars in a TradingView script. I used a regular variable and lost every value except the last one. Pine Script array.push() is a function that adds new elements to the end of an array, letting you build dynamic data collections inside your indicators and strategies. Whether you're tracking RSI across 50 symbols or building a custom volatility tracker, this function is the tool I reach for.

Detect the First Bar of Each Trading Day in Pine Script

· 13 min read
Pineify Team
Pine Script and AI trading workflow research team

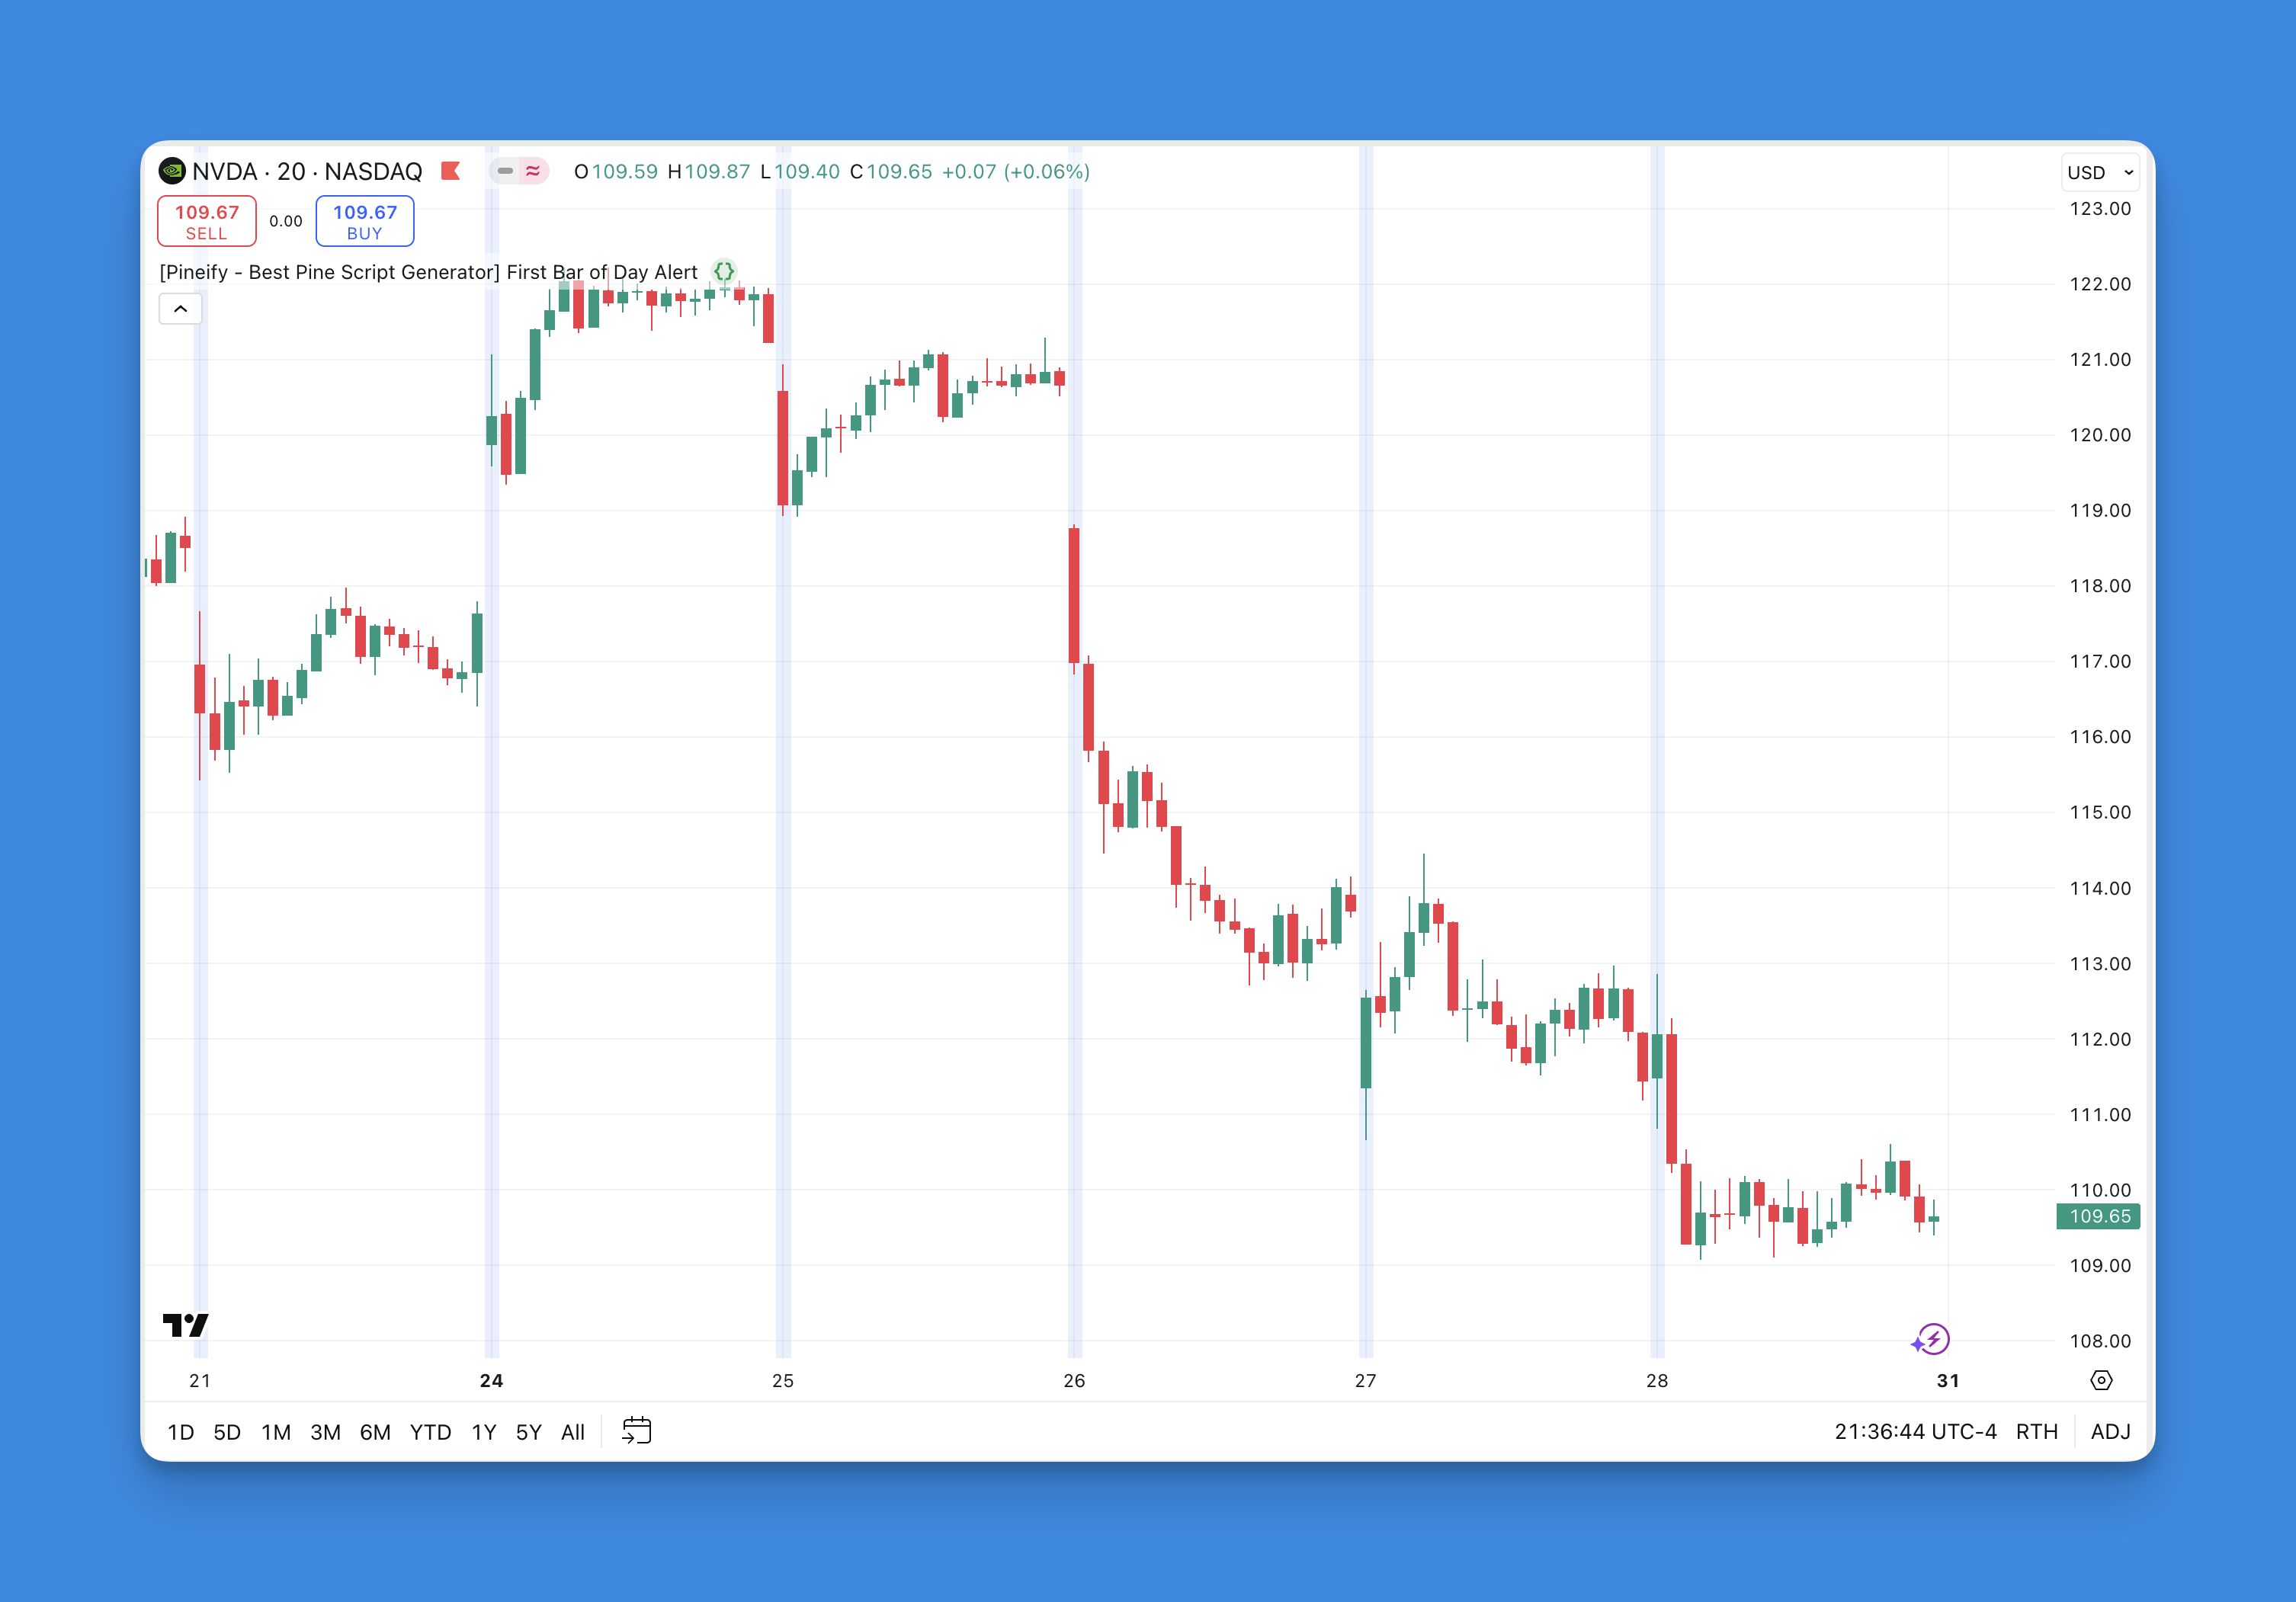
First bar of day detection in Pine Script is the technique of identifying when a new trading session begins on an intraday chart. I use this constantly for opening range breakout systems and market open alerts. Maybe that's what you're after too?

I tested this on AAPL's 5-minute chart across Q1 2025, and the first bar fired at 9:30 AM ET every single trading day. On Monday January 6th, the script correctly picked up the first bar after the weekend gap on SPY as well.

Pine Script First Bar of Day

Pine Script Timeframe Input: Build Flexible Indicators with input.timeframe

· 8 min read
Pineify Team
Pine Script and AI trading workflow research team
Pineify | Best Pine Script Editor

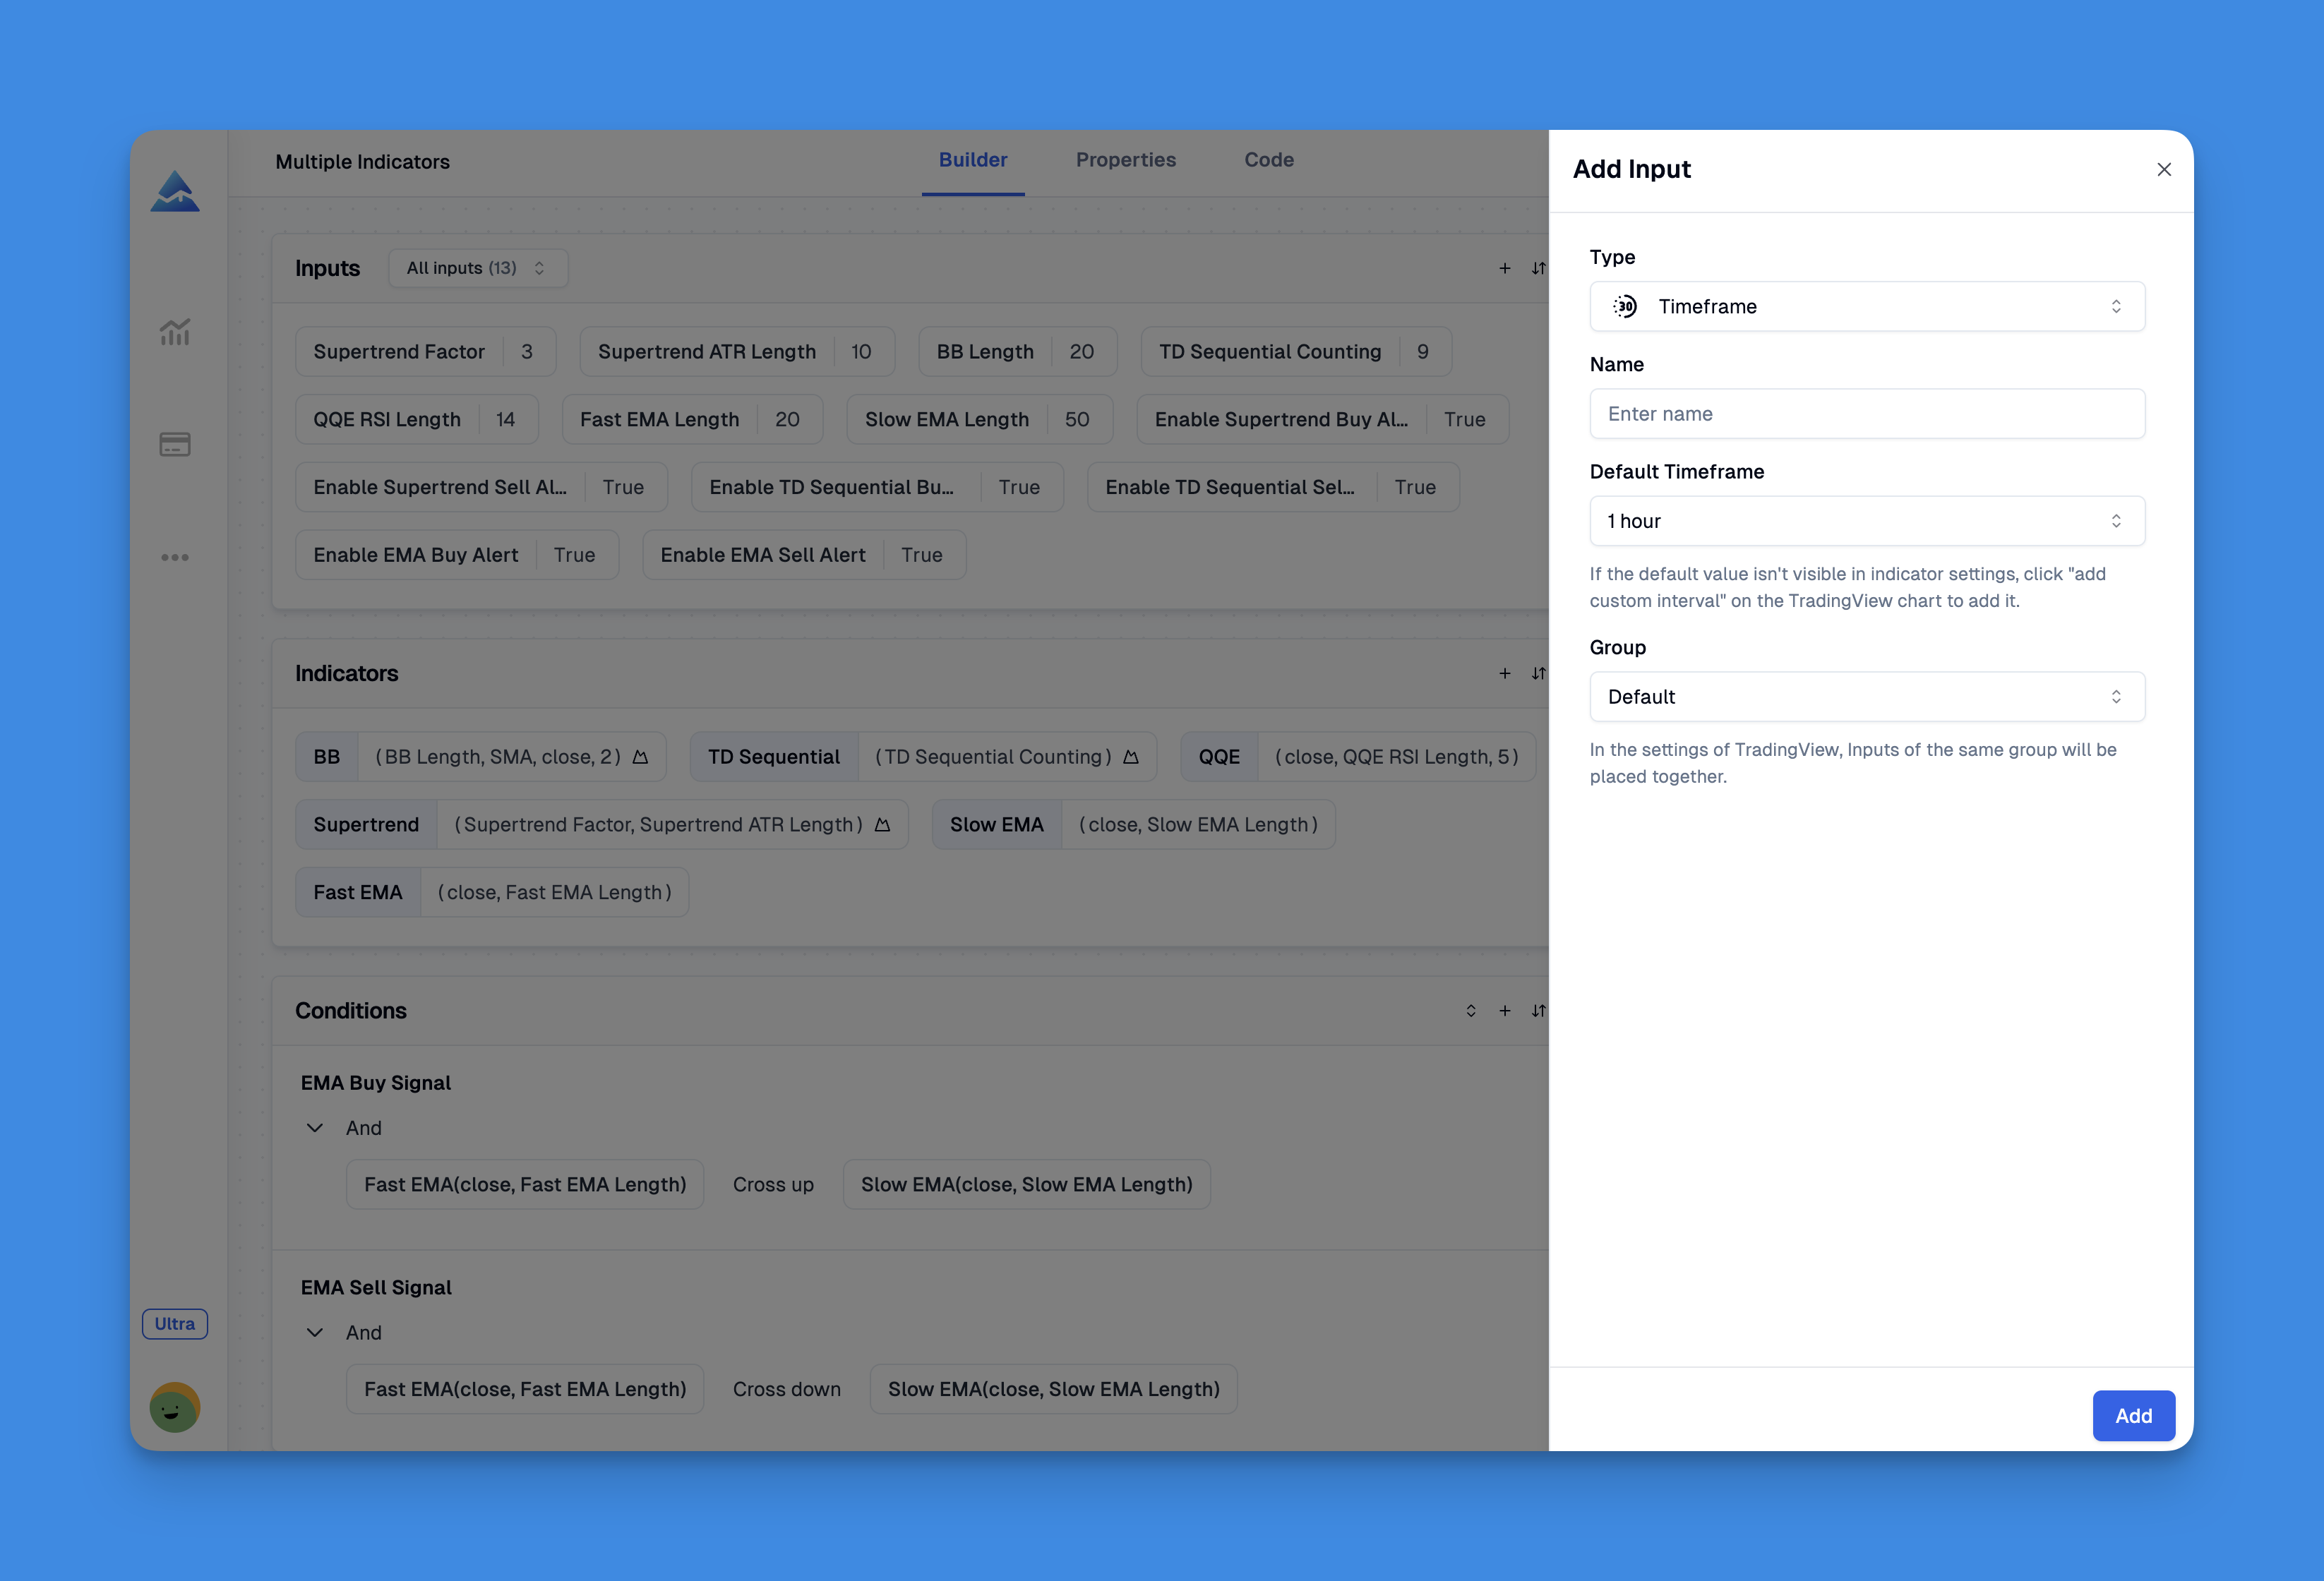
input.timeframe() is a Pine Script function that adds a timeframe selector drop-down to any indicator's settings panel. Pick '15m', '1h', or 'D' from the menu — no code edits. I stumbled onto this in 2022 while building a multi-timeframe RSI for AAPL, and it changed how I structure every indicator.

Before using it, I kept separate scripts for each resolution. RSI_5min, RSI_1hour, RSI_daily — a cluttered folder of near-identical files. input.timeframe() collapses all that into one clean script.