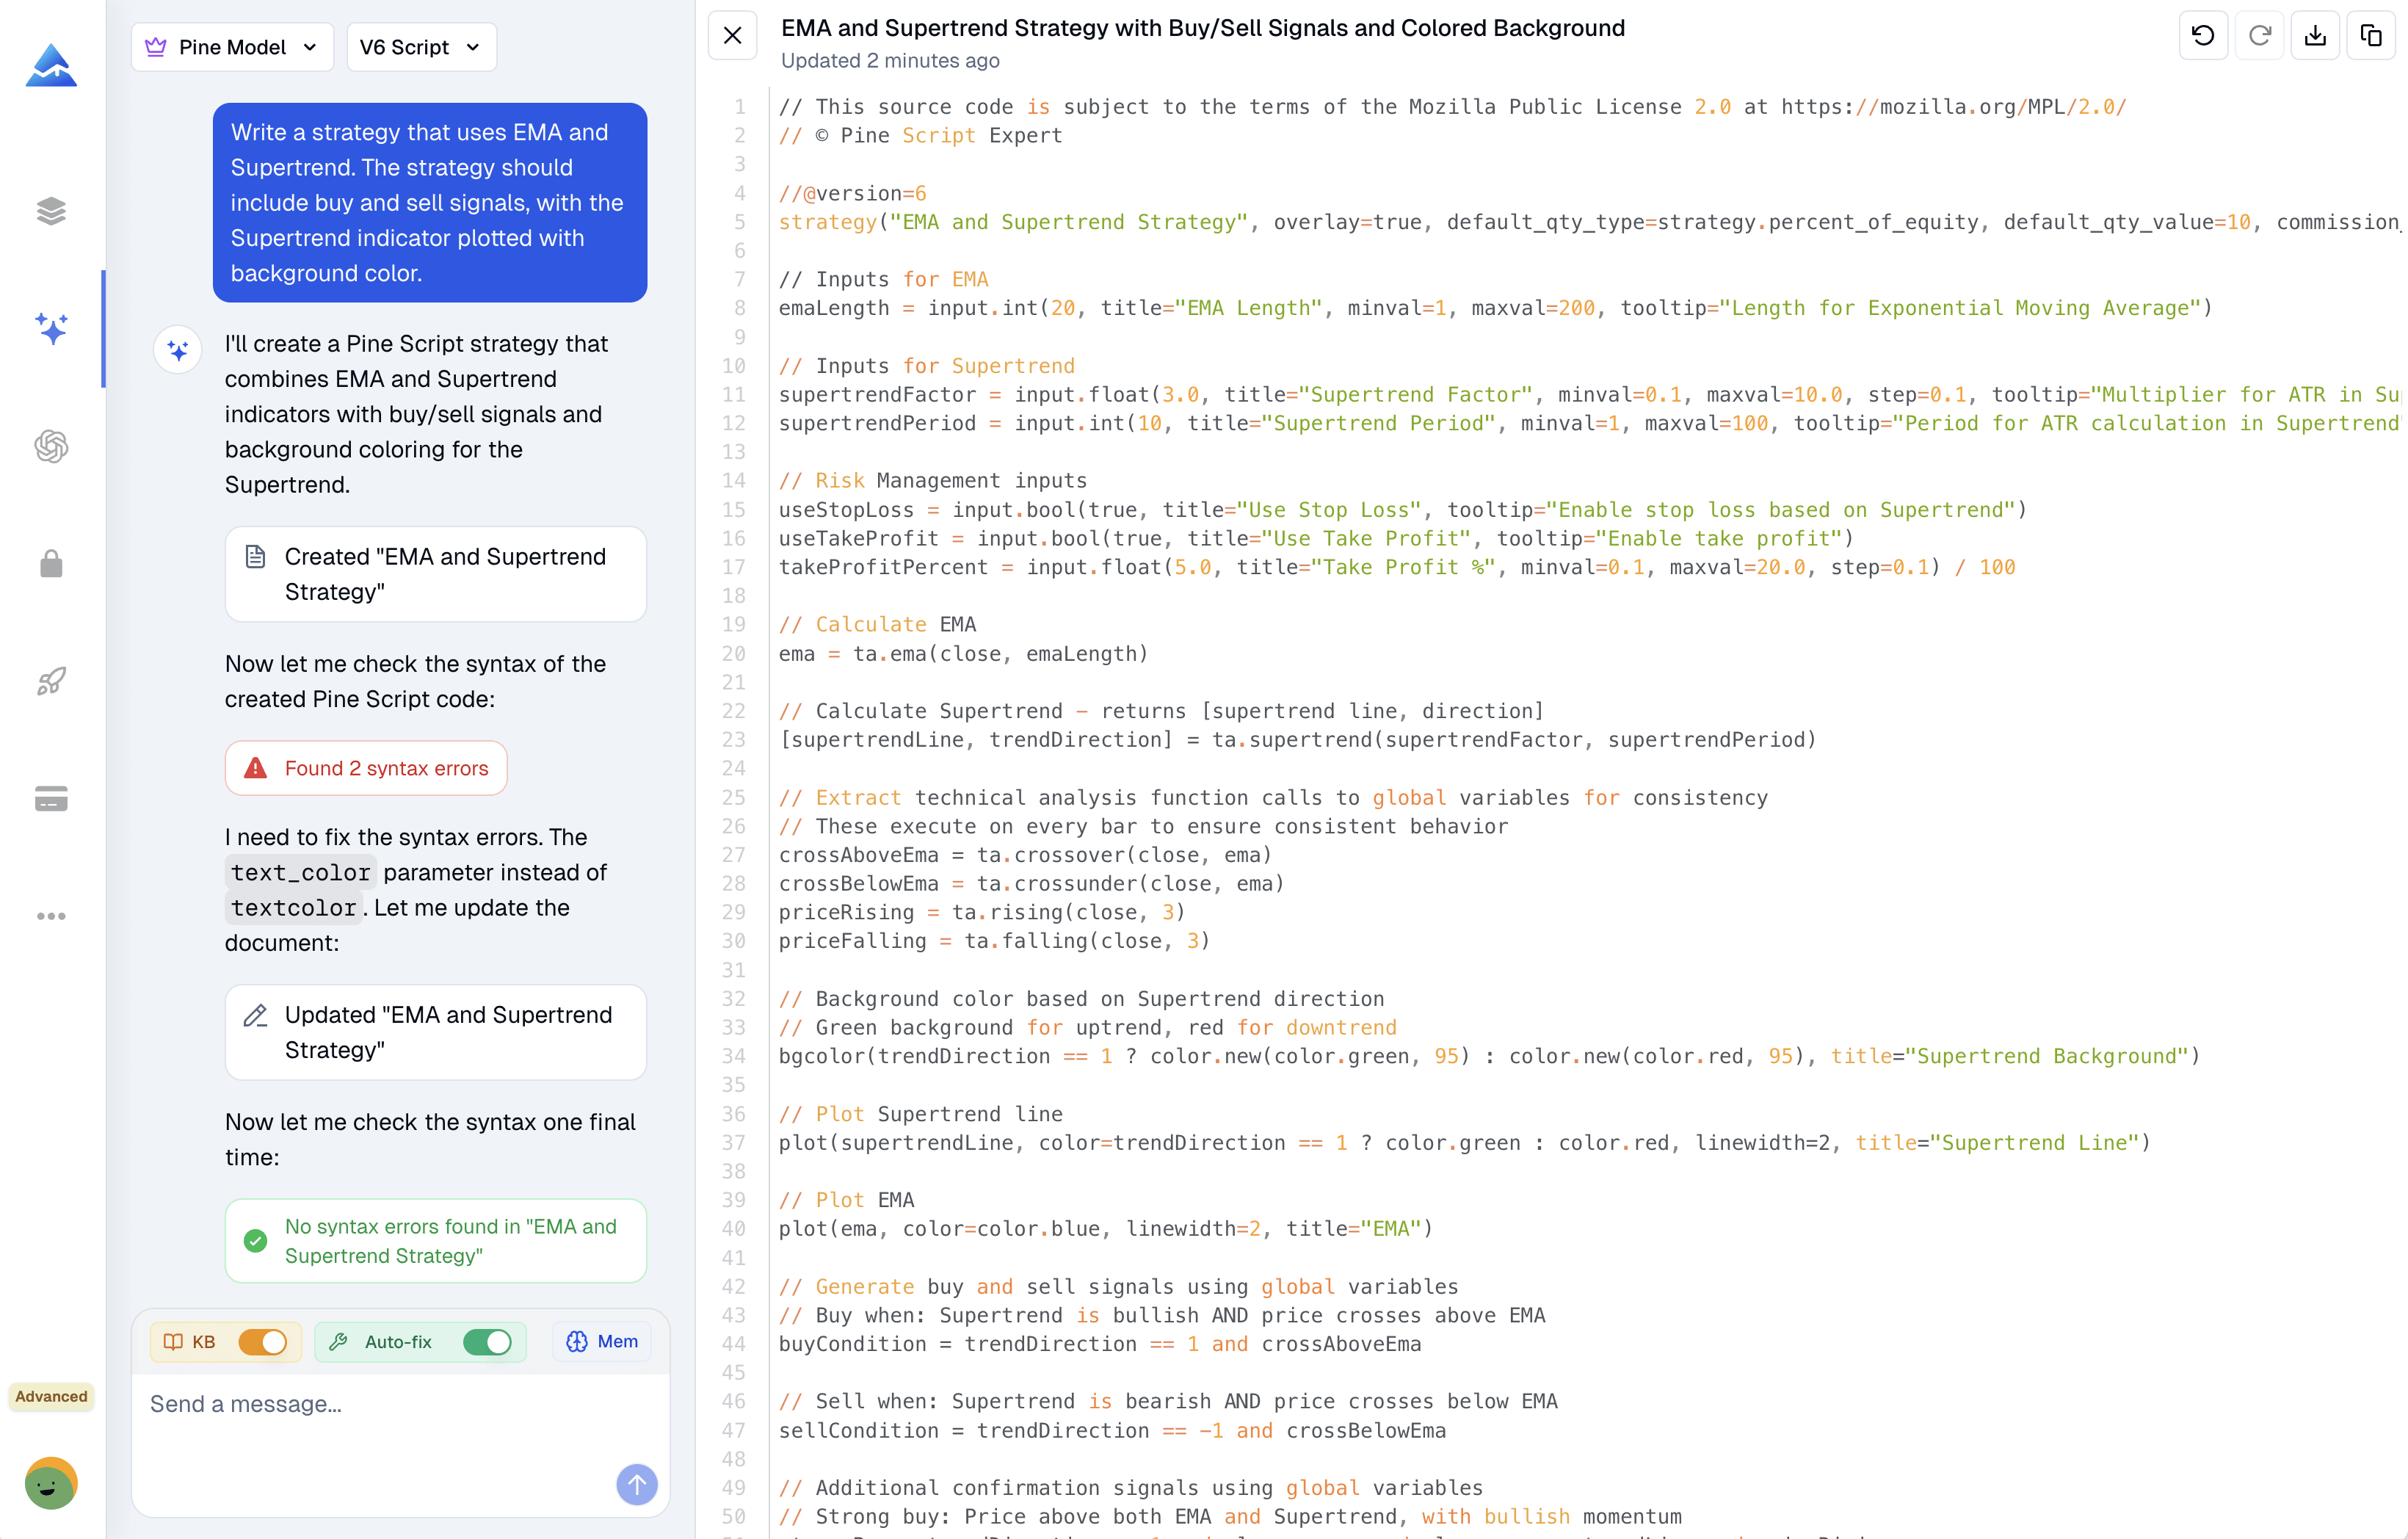
747 posts tagged with "Pine Script"

Blog posts related to the PineScript

View All Tags

Williams Percent Range Indicator: Master This Powerful TradingView Momentum Tool in 2025

· 10 min read

Here's the thing about the Williams %R indicator—it's one of those tools that looks simple on the surface but can seriously improve your trading when you understand how it actually works. Created by Larry Williams back in the day, this momentum oscillator swings between 0 and -100, helping you spot when markets might be ready to flip direction.

MACD Multi-Timeframe Indicator: See All Signals in One Chart | TradingView Pine Script

· 8 min read

Ever felt frustrated trying to check MACD signals across multiple timeframes? You're constantly switching between 15-minute, 1-hour, and daily charts, trying to piece together the bigger picture. What if I told you there's a way to see everything in one place?

The "MacD Custom Indicator-Multiple Time Frame+All Available Options" does exactly that. Think of it as your regular MACD indicator, but with superpowers. Instead of just showing you what's happening on your current timeframe, it gives you the complete story across different time periods – all displayed with intuitive color coding that makes trend changes impossible to miss.

Madrid Moving Average Ribbon: 19 Moving Averages That Show Trends Instantly

· 3 min read

The Madrid Moving Average Ribbon is like having 19 different moving averages on your chart at once, from fast (5 periods) to slow (100 periods). When they bunch together and change colors, it gives you a clear picture of what the market's doing.

Instead of just one line, you get this colorful ribbon that shows:

  • Green when things are going up
  • Red when they're going down
  • Mixed colors when the market can't decide

The 100-period average acts like a baseline - if prices are above it and the ribbon's green, that's generally good. Below and red? Not so good.

MACD Indicator: Master TradingView's Most Reliable Momentum Tool in 2025

· 11 min read

Here's the thing about the MACD indicator—it's been around since Gerald Appel created it in the late 1970s, and it's still one of the most dependable tools in any trader's toolkit. While everyone's chasing the latest shiny indicator, MACD quietly does what it's always done: shows you exactly when momentum is shifting before the crowd catches on.

What I love about MACD is its simplicity. You're not dealing with complex algorithms or mysterious calculations. It's just two moving averages having a conversation about where price momentum is heading. And that conversation can tell you a lot about what's coming next in the markets.

Understanding the Negative Volume Index (NVI) for Trading

· 5 min read

The Negative Volume Index (NVI) is a neat little indicator that shows you what's happening when trading volume drops. The basic idea is that when volume is low, the "smart money" (big players like institutions) might be making moves, while high volume often means retail traders are active.

It's like having a way to peek at what the pros might be doing when the market seems quiet.

Price-Volume Trend Indicator: Complete TradingView Pine Script Guide

· 15 min read

Ever wondered why some price moves stick around while others disappear faster than your morning coffee? The secret lies in volume - the real engine behind every price movement. That's where the Price-Volume Trend (PVT) indicator becomes your trading compass.

The Price-Volume Trend indicator is like having X-ray vision for market movements. It combines price and volume data to show you whether the buying and selling pressure behind a move is genuine or just market noise. Unlike basic volume indicators that only tell you how much trading happened, the PVT reveals whether that volume is actually supporting the trend or fighting against it.

Here's the magic: when prices close higher than yesterday, the PVT adds that day's volume to a running total. When prices close lower, it subtracts the volume. This creates a cumulative line that tracks the real buying and selling pressure over time. When both price and PVT are climbing together, you're seeing authentic buying interest. But when they start moving in opposite directions? That's your early warning system for potential trend changes.

Think of it as a truth detector for price movements - separating real market conviction from temporary excitement.

TradingView Stock Screener Pine Script: Ultimate Guide to Custom Market Scanning

· 15 min read

TradingView's stock screener, supercharged by Pine Script, lets you build your own custom market scanning tools. Think of it as moving past simple filters like price or volume, and into creating a programmable tool that hunts for the exact trading setups you're looking for. You can scan stocks, crypto, and forex using TradingView's own straightforward scripting language to spot opportunities others might miss.

TradingView Stock Screener Pine Script: Ultimate Guide to Custom Market Scanning

Understanding the Bull Bear Power Indicator in TradingView

· 7 min read

Ever felt like you needed a crystal ball to figure out who's really in control of the market? Well, the Bull Bear Power indicator might be the next best thing. Created by Dr. Alexander Elder, this tool gives you a front-row seat to the ultimate market showdown between buyers and sellers.

Think of it as your market referee, calling out exactly who's winning the tug-of-war. It measures how far prices stretch above or below a moving average - kind of like how Bollinger Bands work, but with its own unique approach to reading market pressure.

Here's what you get with this indicator:

  • Bull Power: Shows how hard buyers are pushing prices above the average
  • Bear Power: Reveals how much sellers are dragging prices below the average

When these two forces move in harmony, you get some pretty reliable clues about whether a trend has real staying power or if it's about to fizzle out.

Pine Script Wizard vs Pineify: Which Tool Actually Works Best for TradingView Traders in 2025?

· 6 min read

Ever felt like you're staring at a blank Pine Script editor, knowing exactly what trading strategy you want but having zero clue how to code it? Trust me, you're not alone. I've been there, frantically googling "how to make Pine Script do what I want" at 2 AM.

Two tools keep popping up in every trader's search: Pine Script Wizard and Pineify. Both promise to turn your trading ideas into working code, but after spending weeks testing both platforms, I've got some thoughts on which one actually delivers.