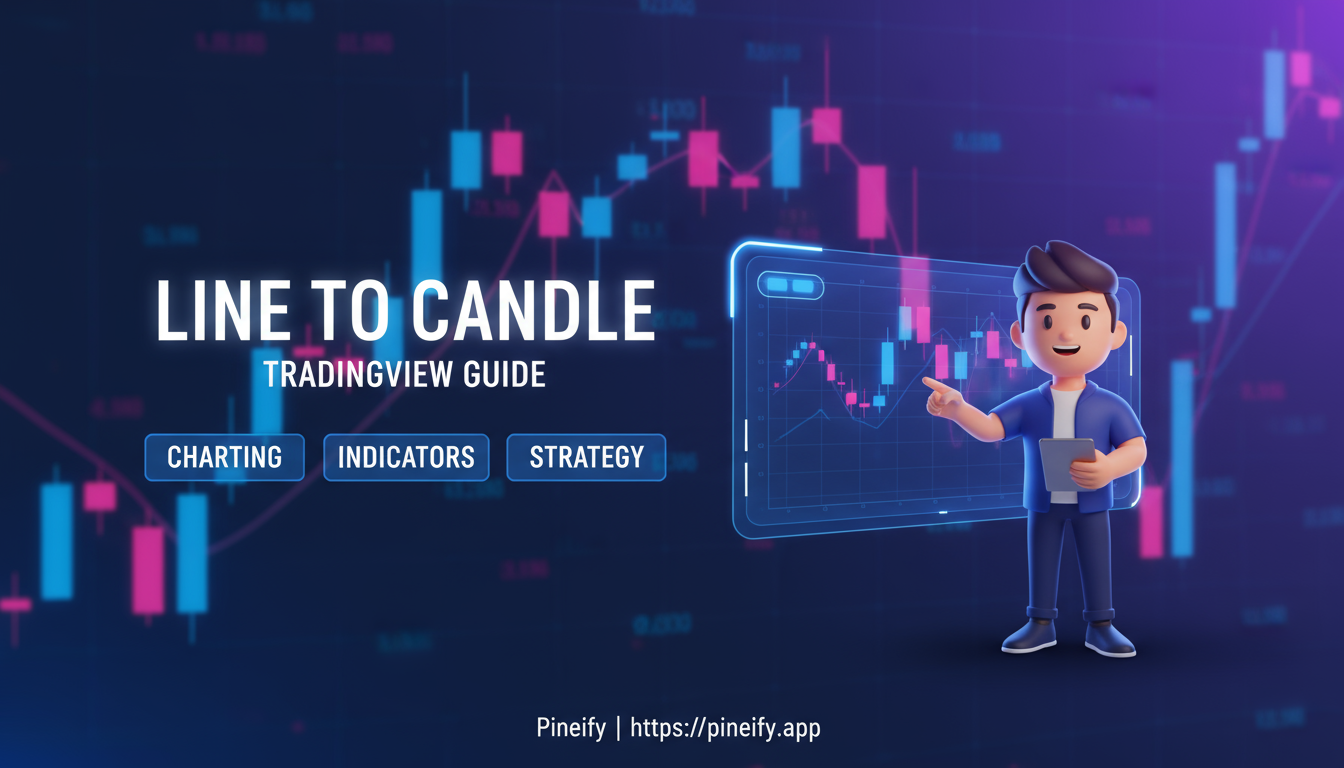
How to Change Line to Candle in TradingView
· 8 min read
Blog posts related to the PineScript
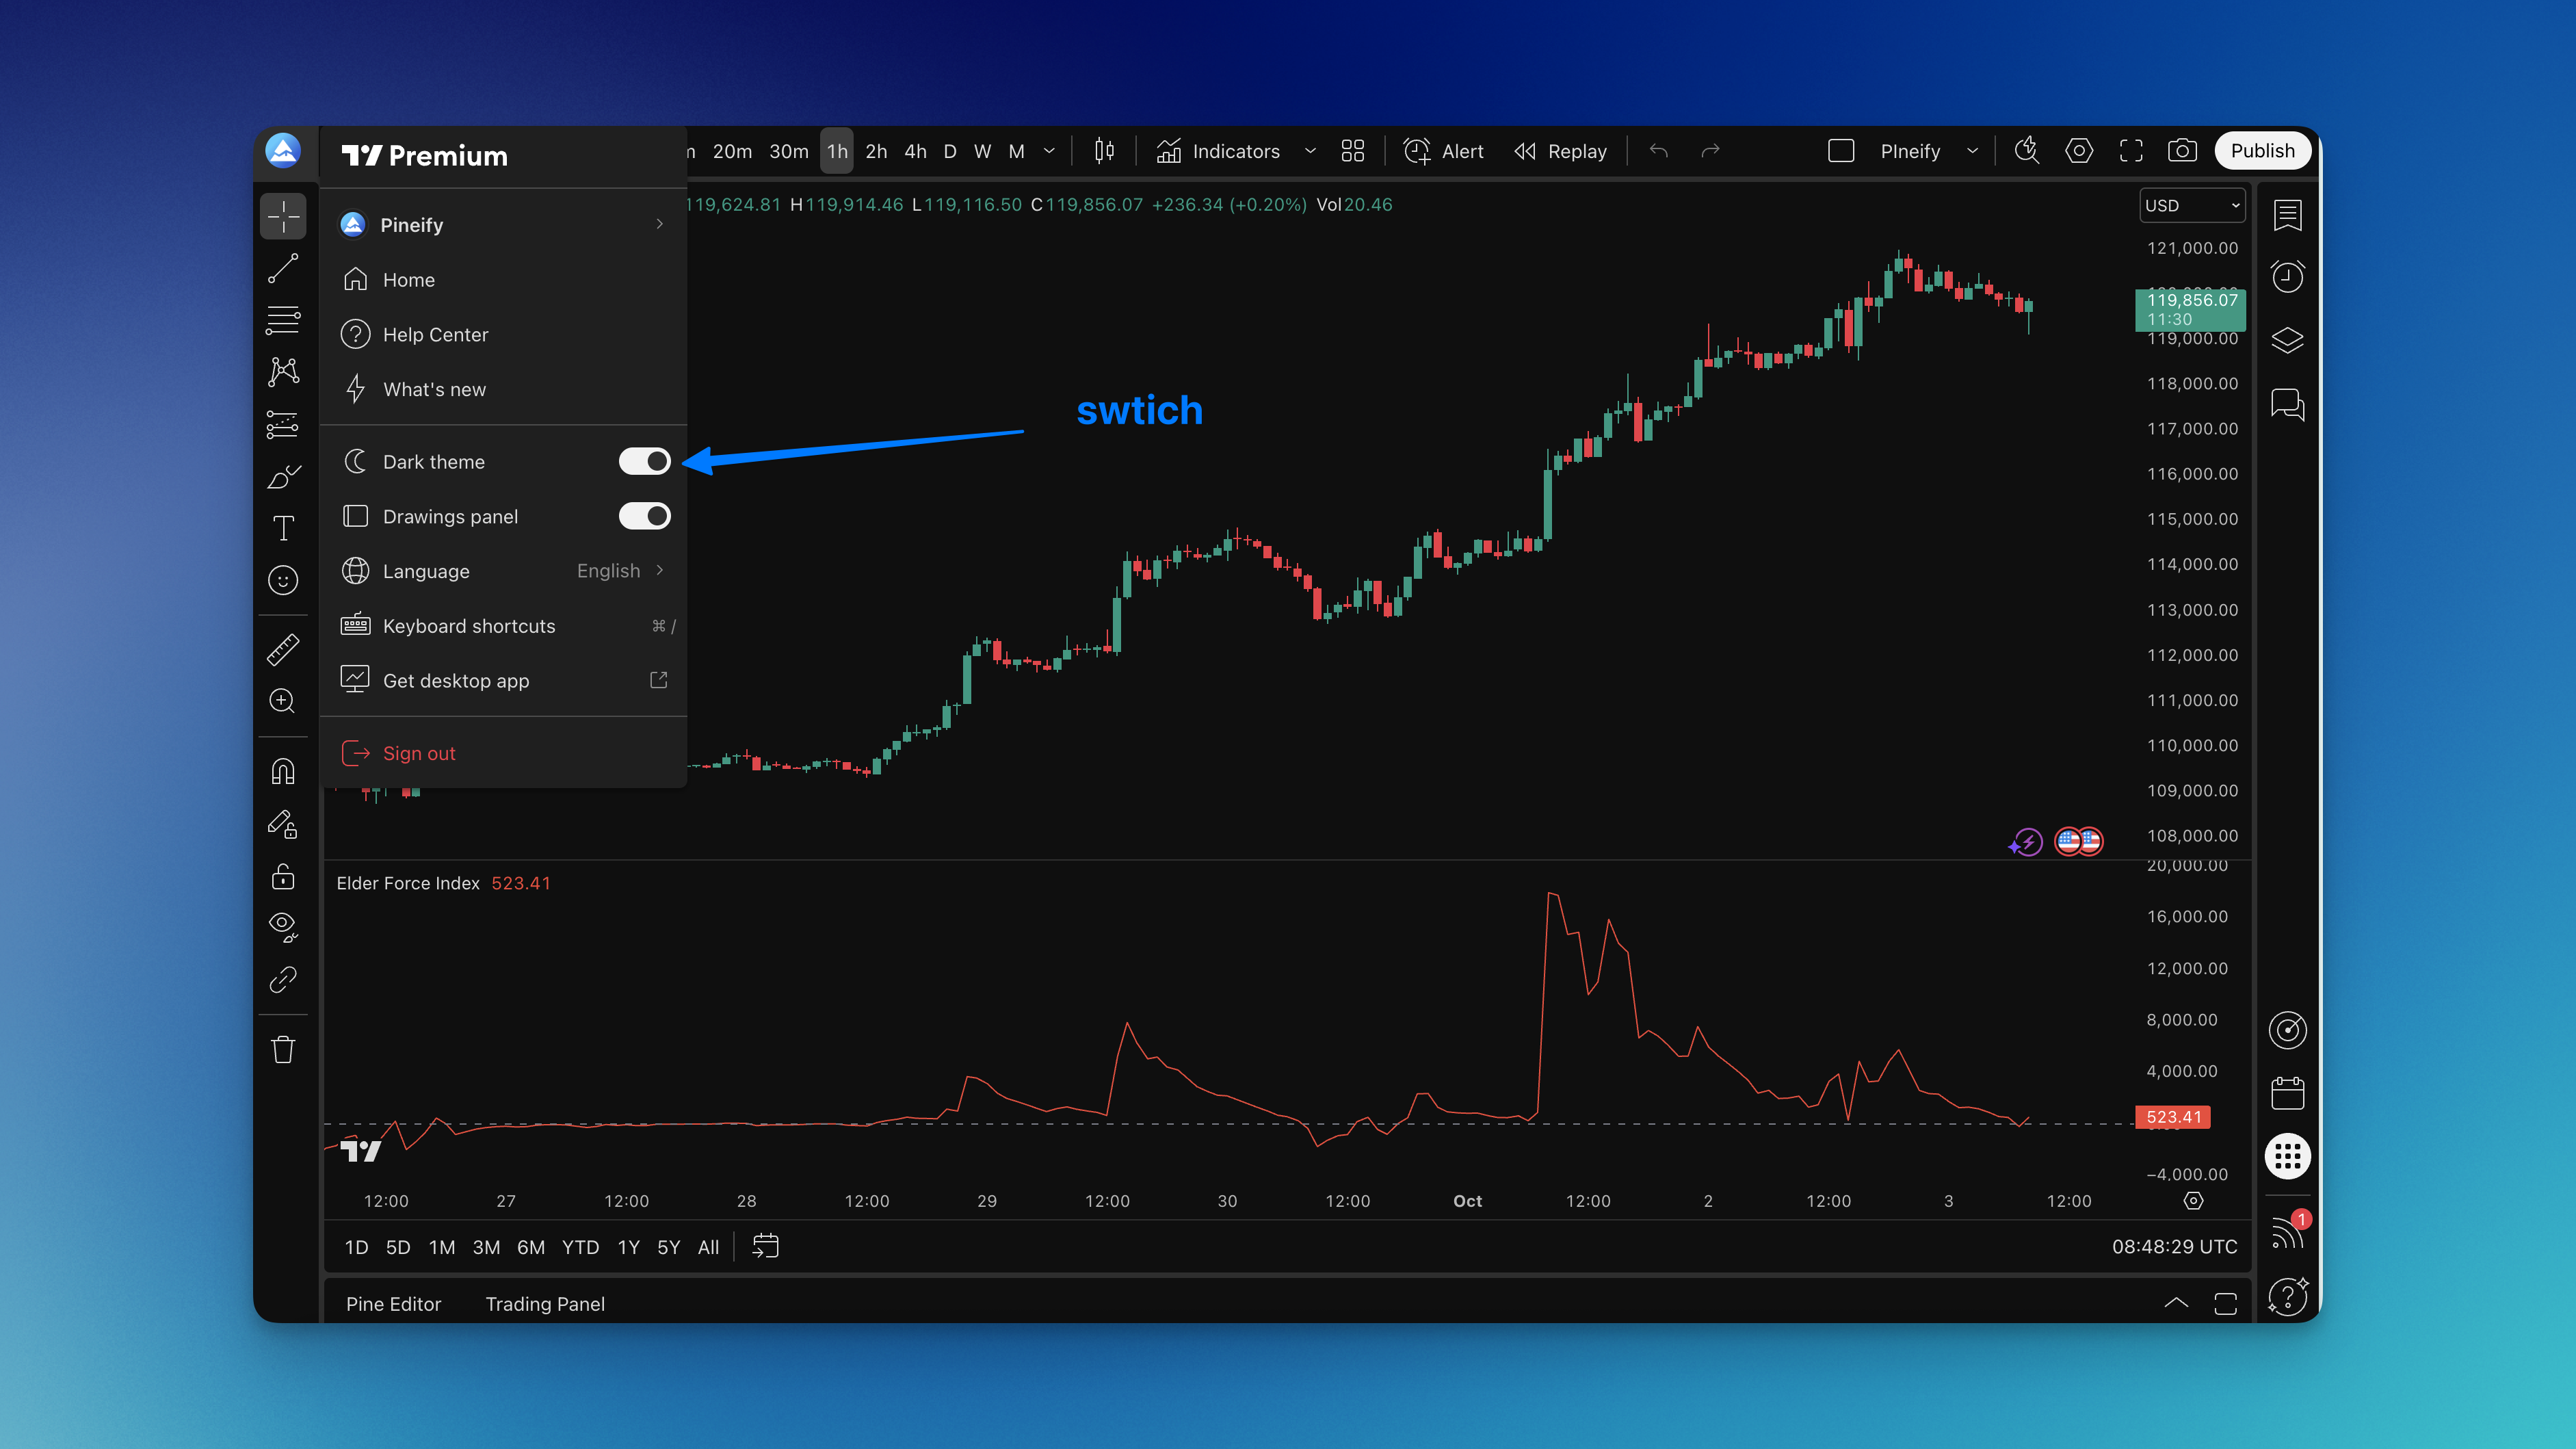
View All TagsIf you log 6-hour chart sessions like I do, TradingView dark mode changes how your eyes feel at the end of the day. TradingView dark mode is a display setting that replaces the platform's default light interface with dark backgrounds across charts, watchlists, and panels. I switched in January 2024 after a week of evening trading on my SPY 15-minute charts left me with headaches, and I haven't looked back since.
Have you ever felt overwhelmed staring at multiple indicator windows on TradingView? I get it. One minute you're watching RSI signals, the next you're tracking moving averages, and suddenly your chart looks like someone threw Christmas lights at it.
Here's what changed everything for me: Pine Script lets you combine multiple indicators into one clean script. And honestly? It's way simpler than most people think.
A combined indicator in Pine Script is a single script that calculates two or more technical indicators — like RSI and EMA — and uses their agreement to generate buy or sell decisions. In October 2025, I tested RSI + EMA on AAPL's daily chart and my false entries dropped from roughly 1 in 3 to about 1 in 8.
After years of trading and more trial-and-error than I'd like to admit, I've learned that combining the right indicators filters out the false signals that used to cost me money. I'll show you exactly how to do it, share combinations that actually work, and help you avoid the mistakes I made starting out.
Let me be straight with you — relying on a single indicator is like trying to drive while looking through a keyhole. You might see something, but you're missing the bigger picture.
Single indicators can be misleading
I used to live and die by RSI signals. When it hit oversold territory, I'd buy thinking I found a bargain. Then I'd watch the price continue dropping while my account balance did the same. Sound familiar?
Multiple indicators create confirmation
Everything changed when I started waiting for two different indicators to agree. It's like asking for a second opinion before making a big decision. Sure, you might miss some quick moves, but you'll avoid way more bad trades.
Different indicators reveal different market aspects:
When multiple types align, that's when you start seeing consistent results. Let me show you how to build this.
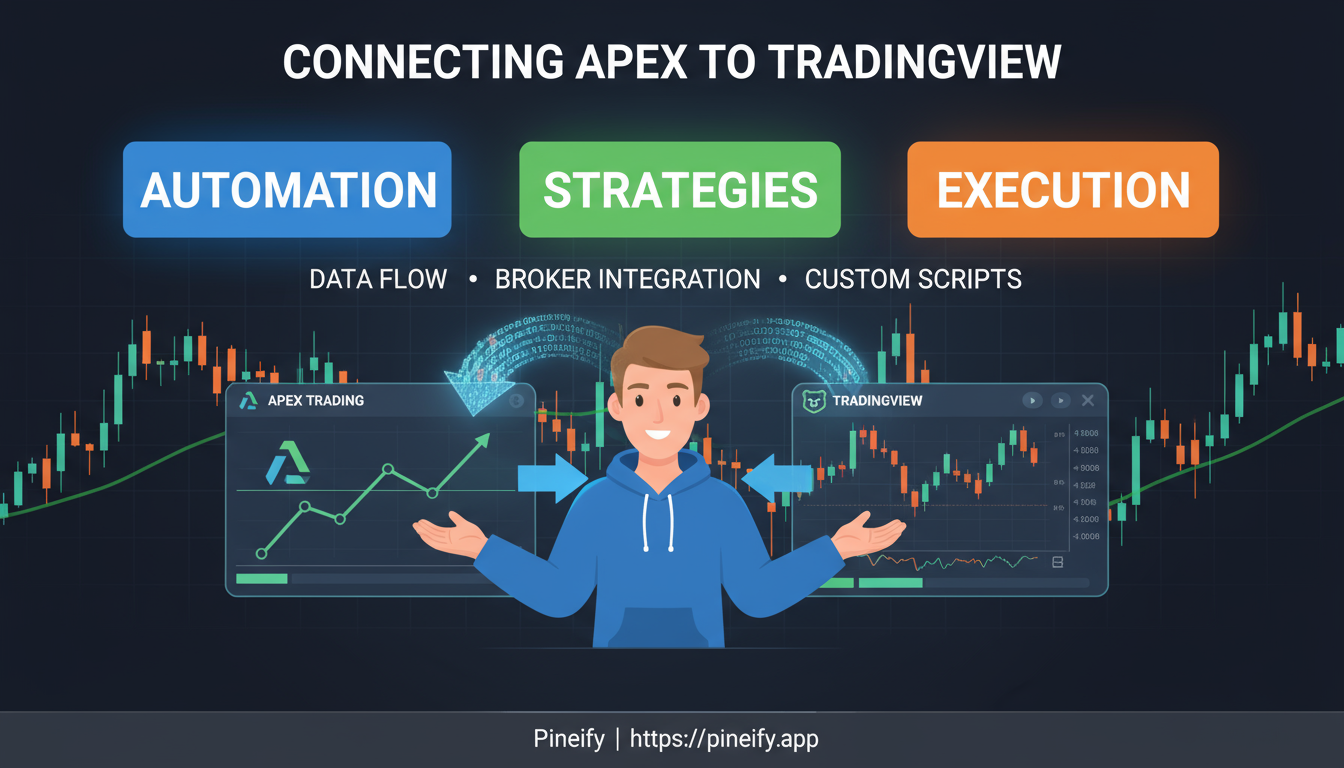
Apex Trader Funding is a prop firm that gives you a funded account after you pass their evaluation. They partner with Tradovate to handle trade execution. Connecting Apex to TradingView means you can place futures trades directly on TradingView's charts while your account runs through Apex.
I've set this up for my own ES and NQ trades, and the whole process takes about 5 minutes once you have your login details. Here is exactly how.
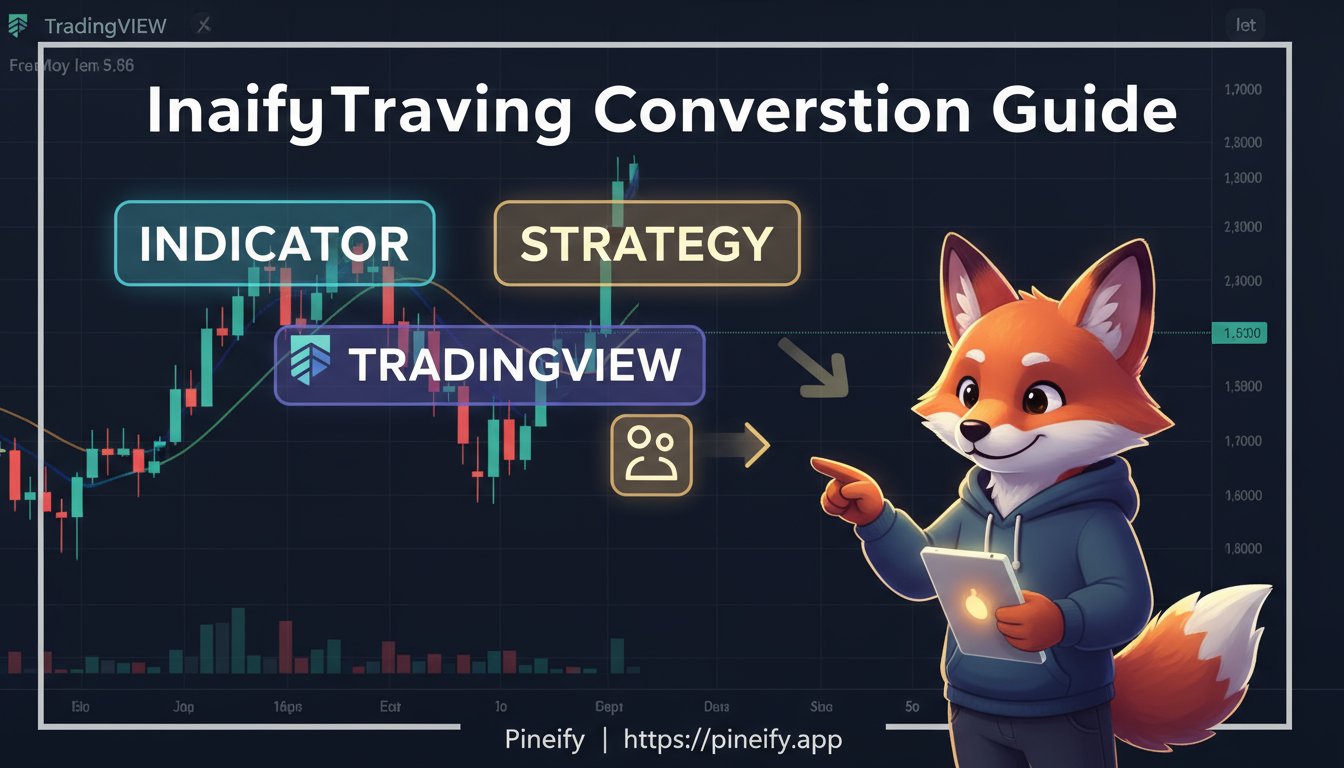
Converting a Pine Script indicator to a strategy on TradingView is the process of taking your chart-level buy and sell signals and wiring them into automated orders that the Strategy Tester can evaluate against historical data. Instead of just drawing arrows and lines, you define entry and exit rules that get simulated bar by bar.
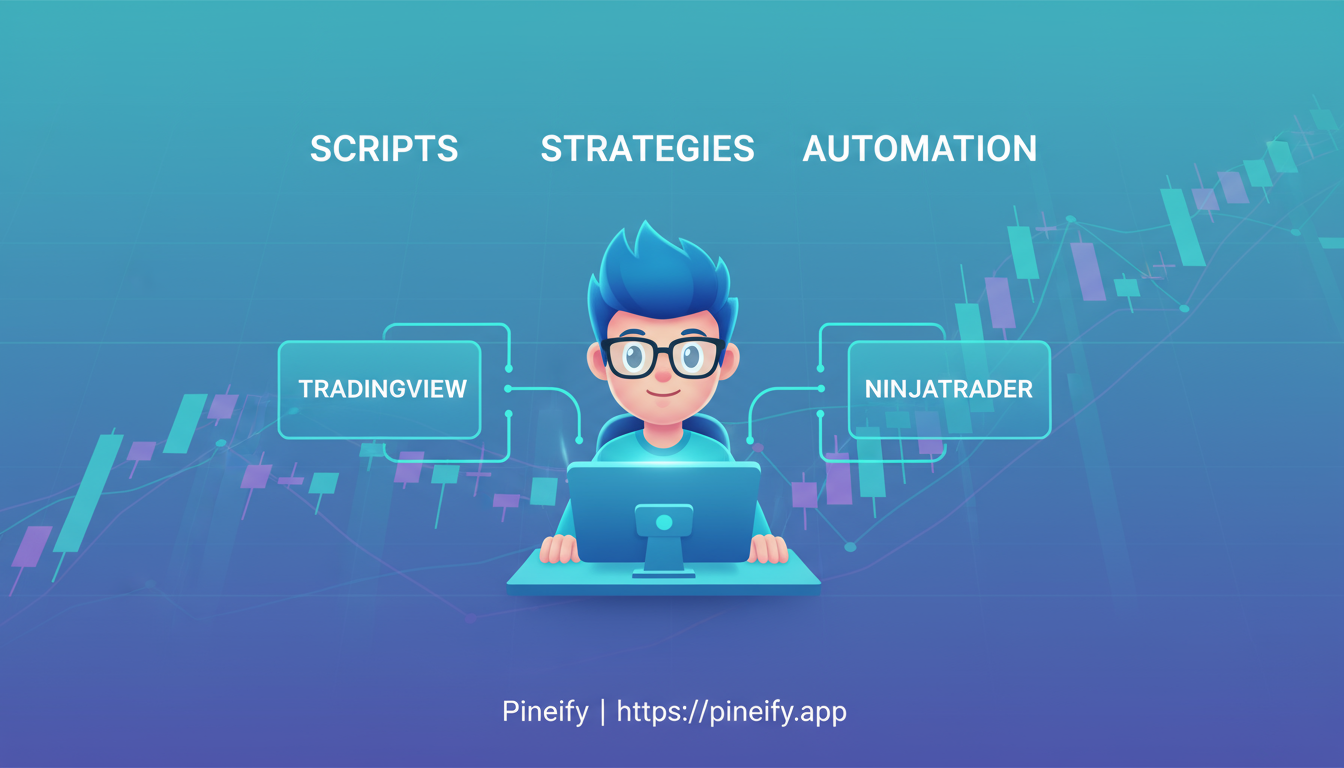
Converting a TradingView script to NinjaTrader means taking your Pine Script code and rewriting it in NinjaScript, which is C#-based. I've done this a few times -- first with a simple SMA crossover strategy for ES futures. It's not plug-and-play. You're translating logic from one environment to another, and the results won't match unless you account for the differences.
The goal is to access NinjaTrader's Order Flow tools and specialized chart types. I converted a Bollinger Bands strategy for CL crude oil contracts last year and it took three full passes before the backtest numbers lined up.
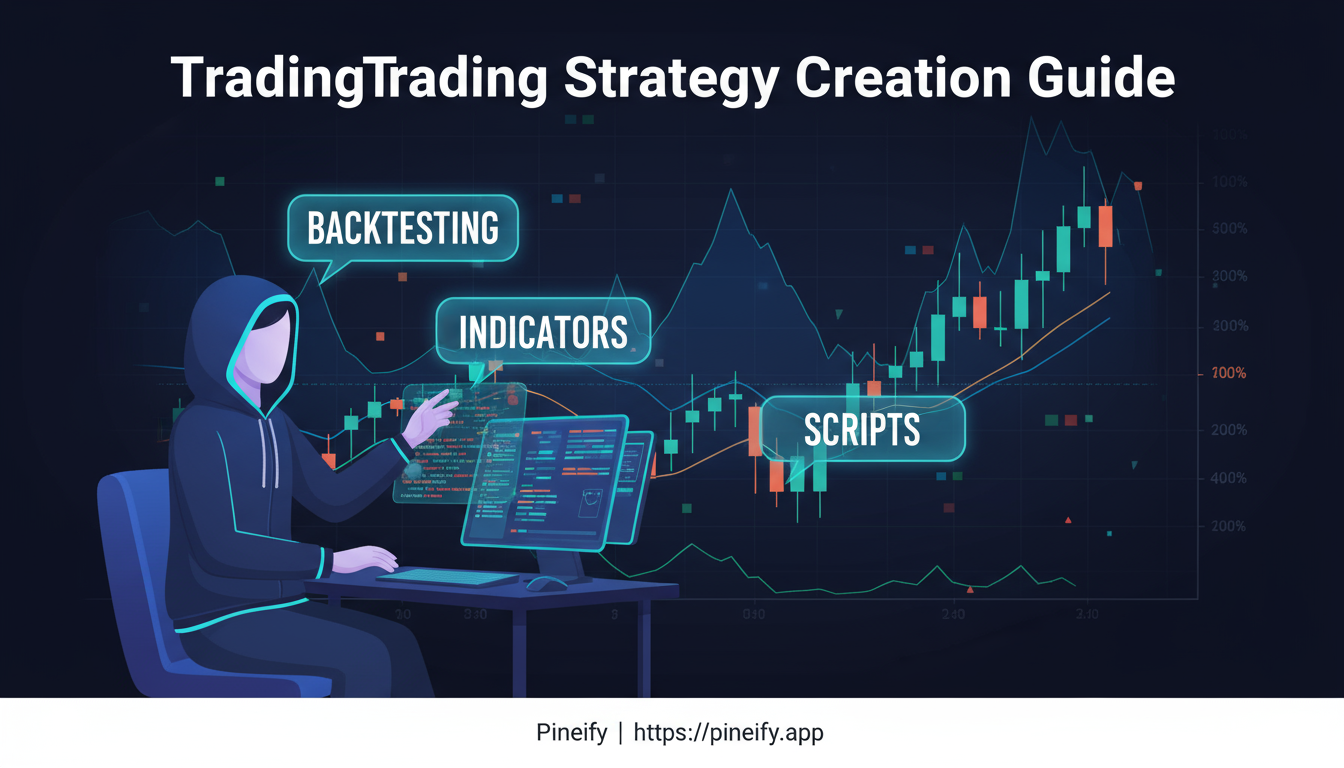
A TradingView strategy is a set of buy and sell rules you code in Pine Script and test against historical price data. You define when to enter and exit, then run the Strategy Tester to see how the rules would have performed. I've been building strategies on TradingView for about three years, and the SMA crossover I'm about to show you was the very first one I got working. When I tested it on BTCUSD on the 4-hour chart last December, it returned a 58% win rate over 200 bars.
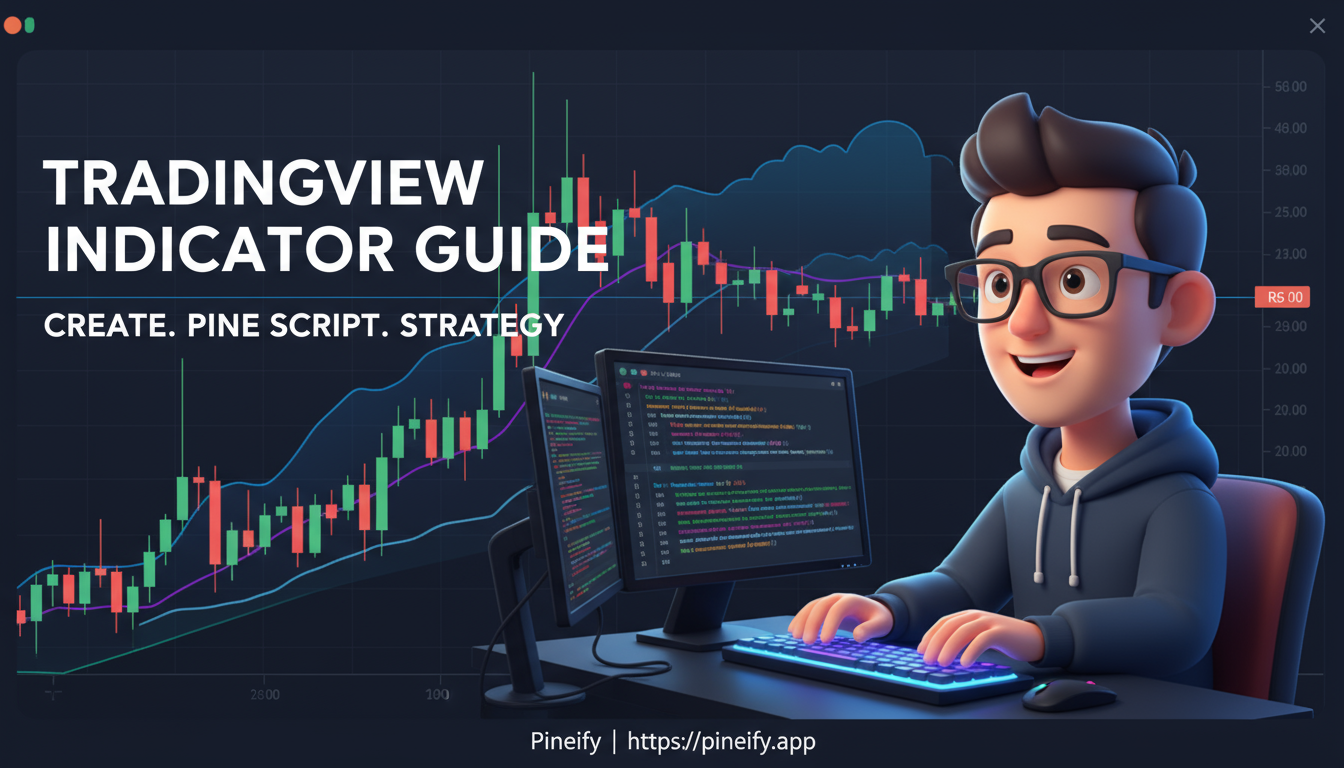
Pine Script is TradingView's programming language for creating custom indicators and strategies directly on price charts. You can calculate moving averages, detect chart patterns, or build entirely new metrics without leaving your browser. I built my first indicator back in January 2023 — a simple moving average crossover on BTC/USDT. Took about 30 minutes to get it running.
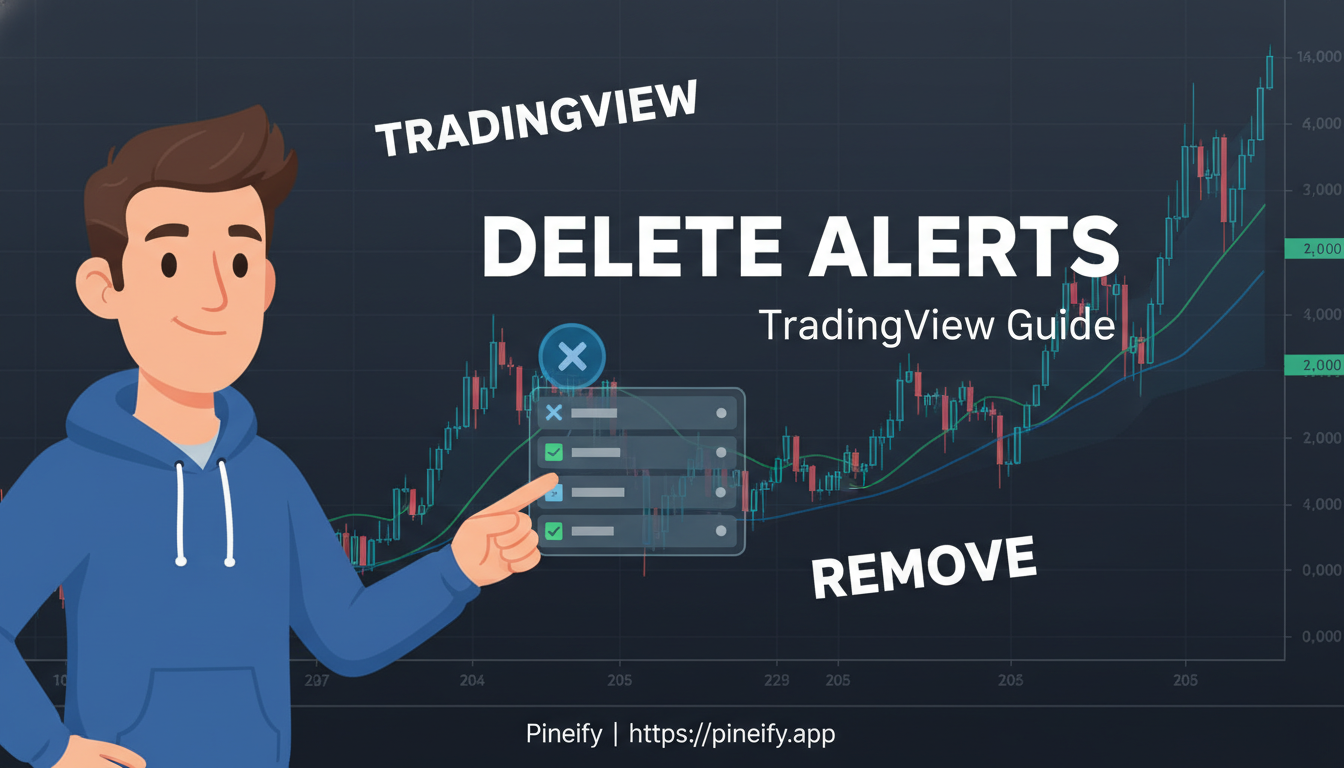
TradingView alerts are price or indicator conditions that notify you when the market hits a level you care about. I set a breakout alert on NVDA at $950 last Tuesday, then forgot about it. By Friday I had six more alerts across different tickers and could not tell which ones still mattered. Deleting old alerts clears the noise, and TradingView gives you several ways to do it.
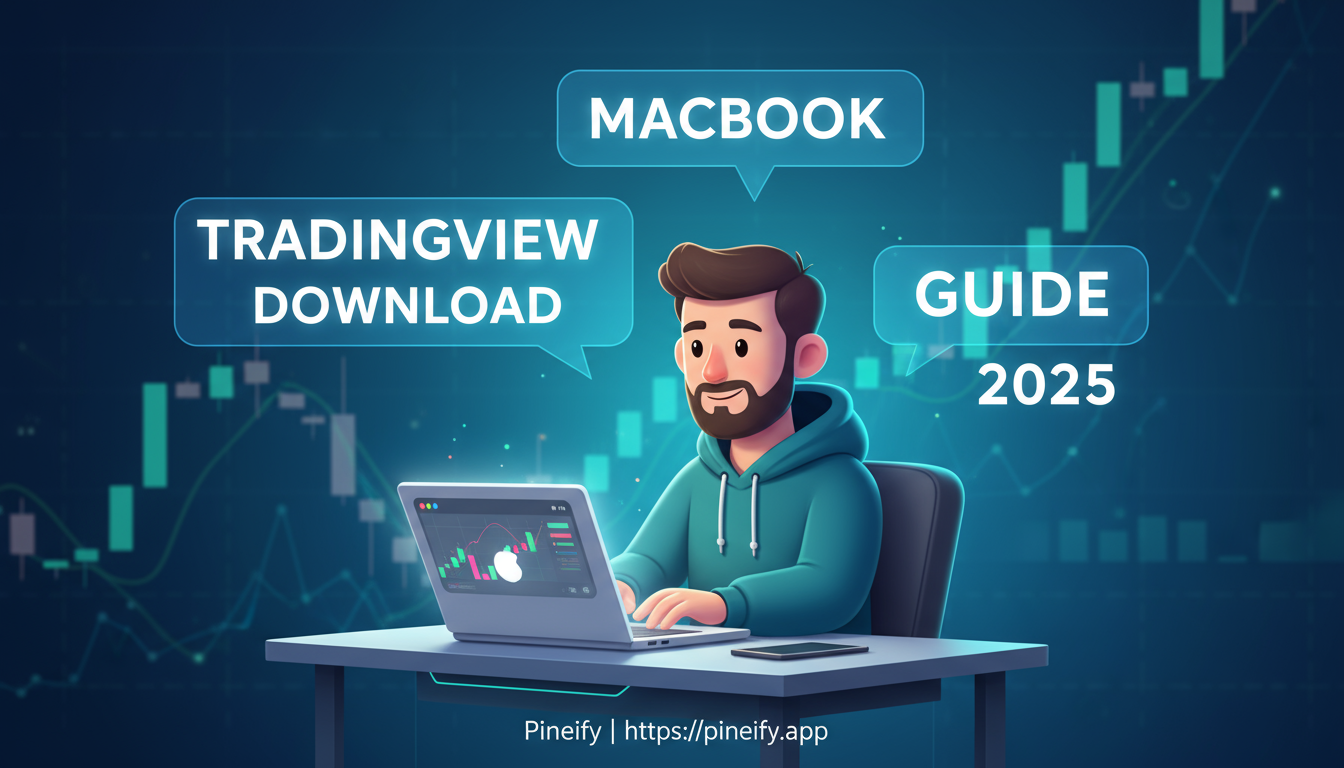
TradingView is a professional-grade charting platform used by over 50 million traders. I downloaded it on my M3 MacBook Air last week and hit a Gatekeeper block that took about 10 seconds to fix — more on that below. Here's exactly how to get it running on your Mac, whether you want the full desktop app, a Homebrew install, or just the browser version.