Pine Script Stop Loss: strategy.exit() Examples & Settings
· 12 min read


Blog posts related to the PineScript
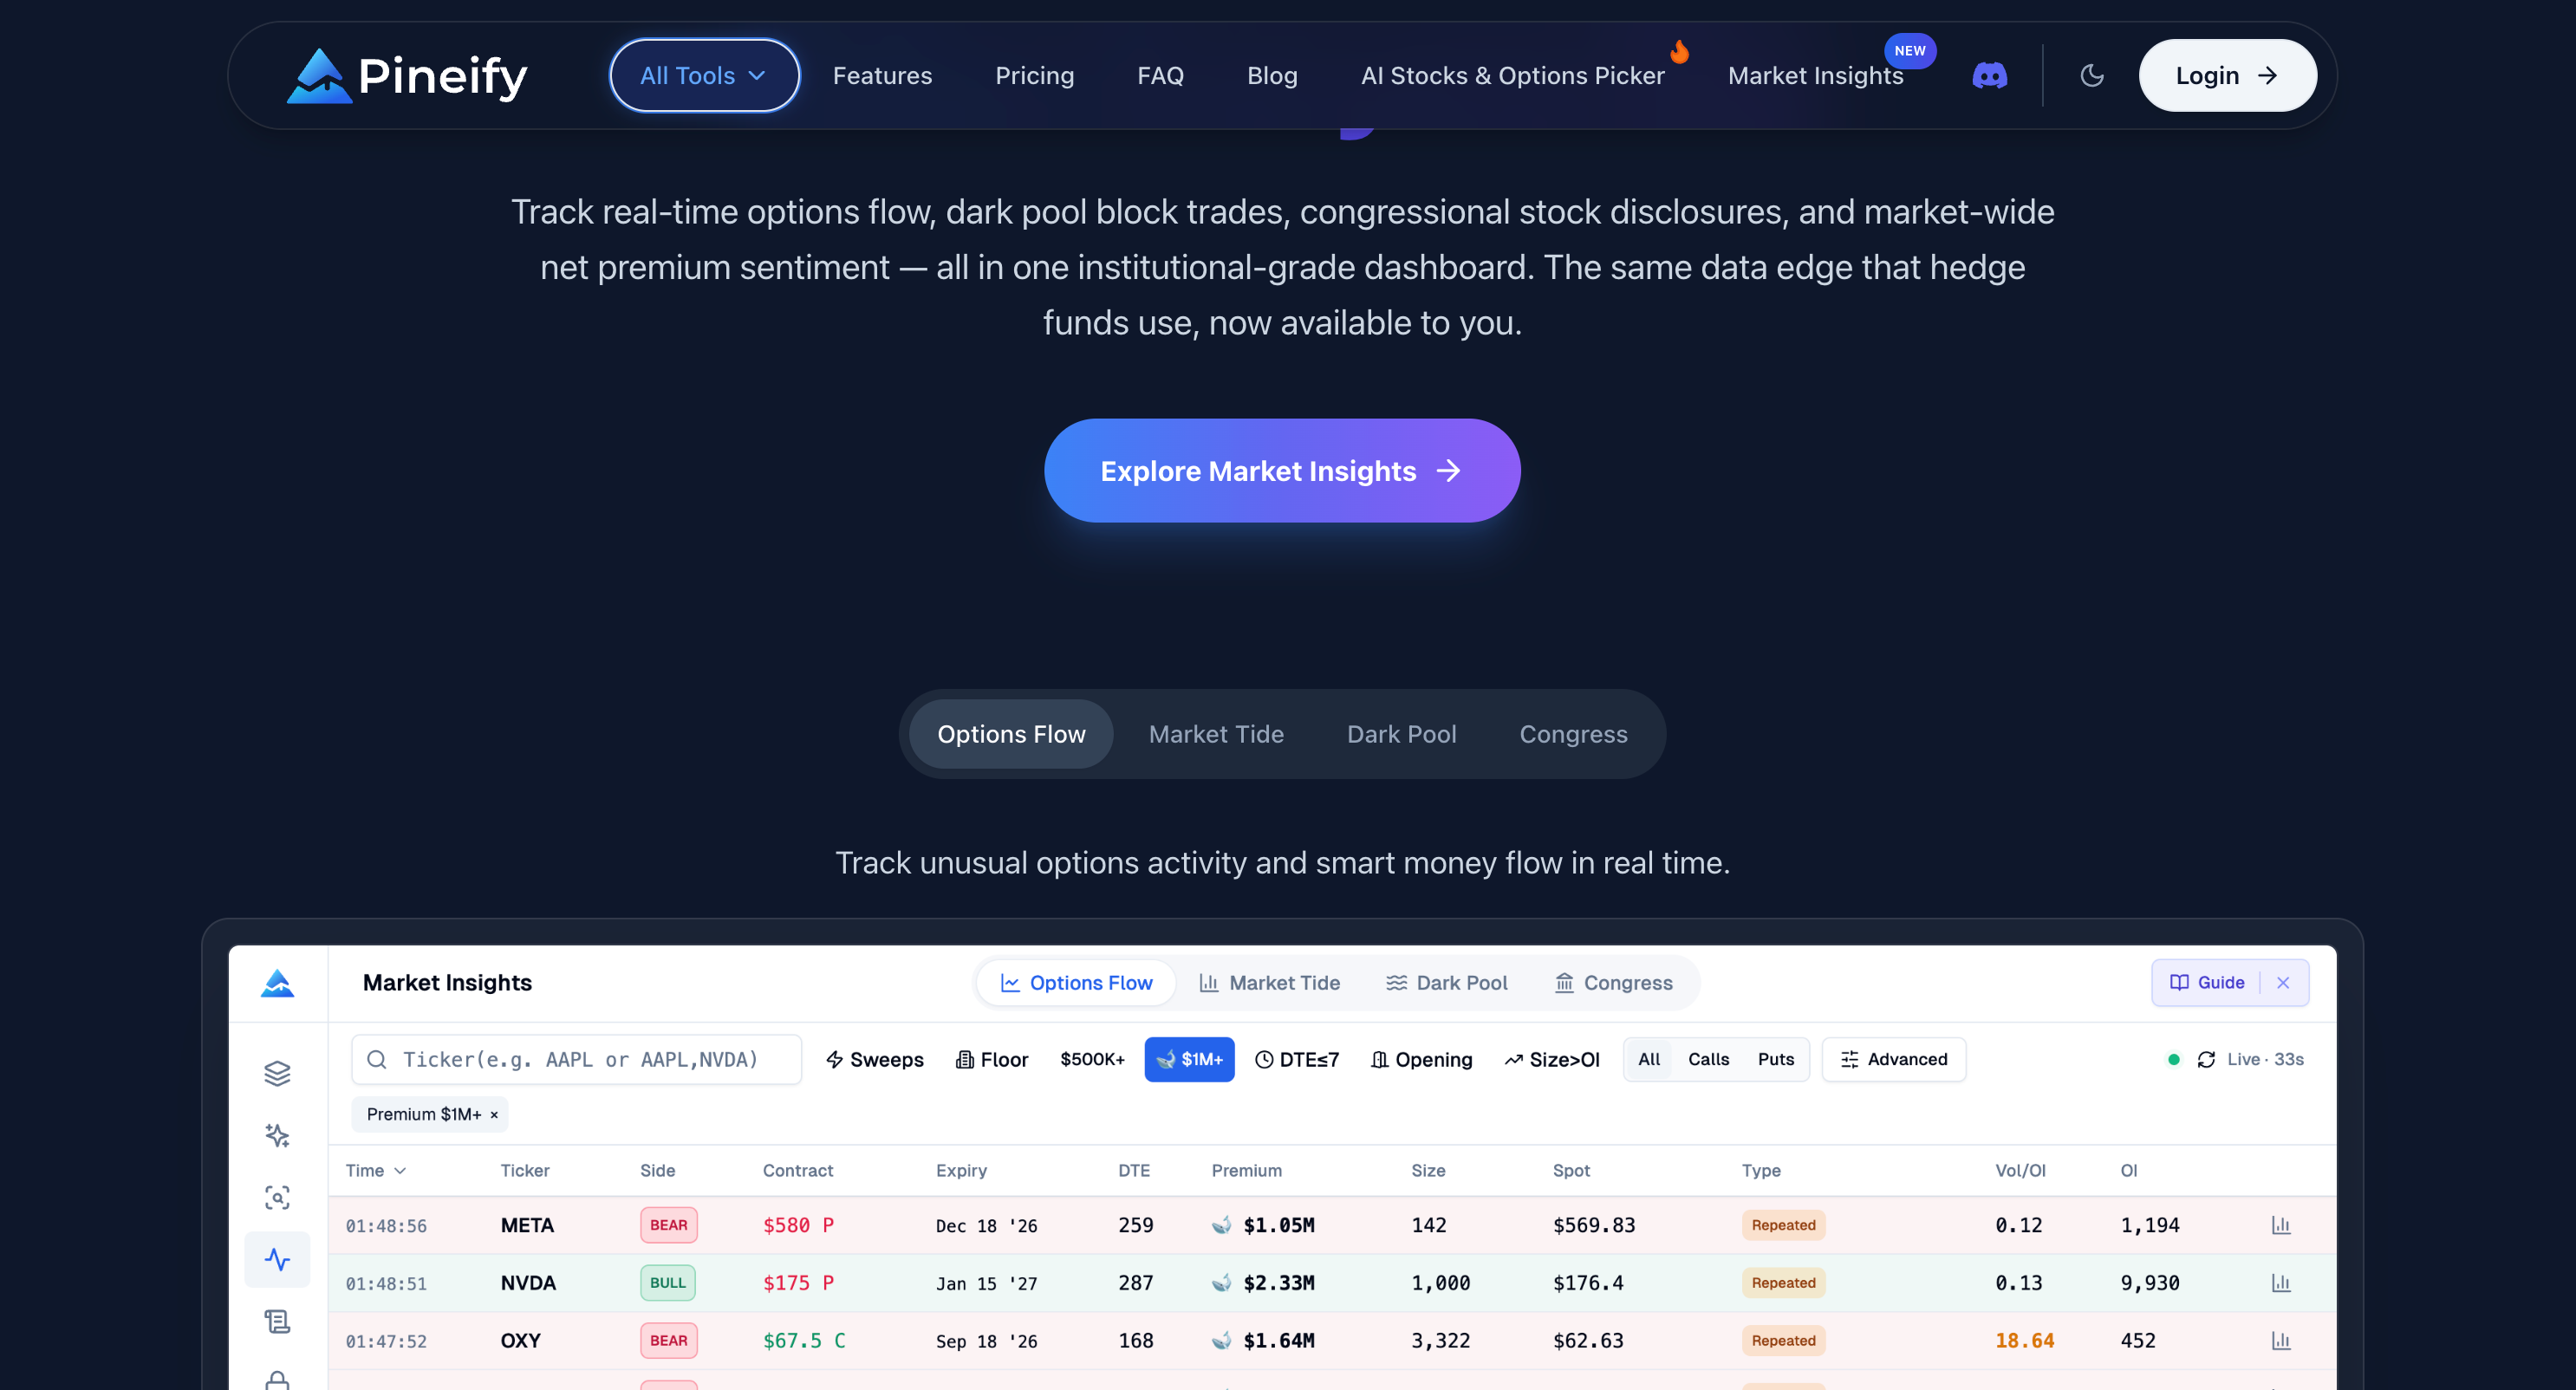
View All TagsNVIDIA is a favorite playground for big-money traders. On any given day, over 258,000 options contracts change hands on NVDA. That torrent of activity isn't just noise—it's a direct look at how hedge funds, institutions, and seasoned investors are betting on this defining AI company.
If you're trading NVDA, whether in and out in a day or planning a longer swing, learning to read this options flow can give you a serious advantage.
NVDA options flow is the live feed of big, unusual options trades happening across all the exchanges. When a major player makes a sizable bet on NVIDIA, that trade gets reported as part of the flow. This matters because institutional traders leave footprints in the options market before major price moves happen.
For NVDA this is especially important. Every single day, billions of dollars in options premiums are tied to where traders think the stock is headed next. This frenzy comes from earnings reports, new AI chip demand, and broader economic shifts.
By paying attention to this flow, you can start to piece together clues about the market's mood:
As of April 10, 2026, NVDA trades at $189.90, with over 72 million shares traded. The company's $4.6 trillion valuation is why its options activity is watched so closely by traders everywhere.
I've tested nearly a dozen AI stock analysis platforms over the past year, and one thing is clear: Danelfin isn't the right fit for most investors. Don't get me wrong—its 1-to-10 AI score is clean and useful. But after running Danelfin against Stock Rover, GuruFocus, and others on my holdings like AAPL, MSFT, and NVDA, I've found that cheaper or more specialized tools often deliver more for less.
Danelfin is an AI-powered stock analysis platform that assigns daily 1-to-10 scores to stocks based on fundamentals, technicals, and market sentiment. For traders who already rely on charting platforms, understanding your plan's features helps you allocate budget wisely between analysis tools and charting software—our TradingView Free vs Paid comparison covers the trade-offs.
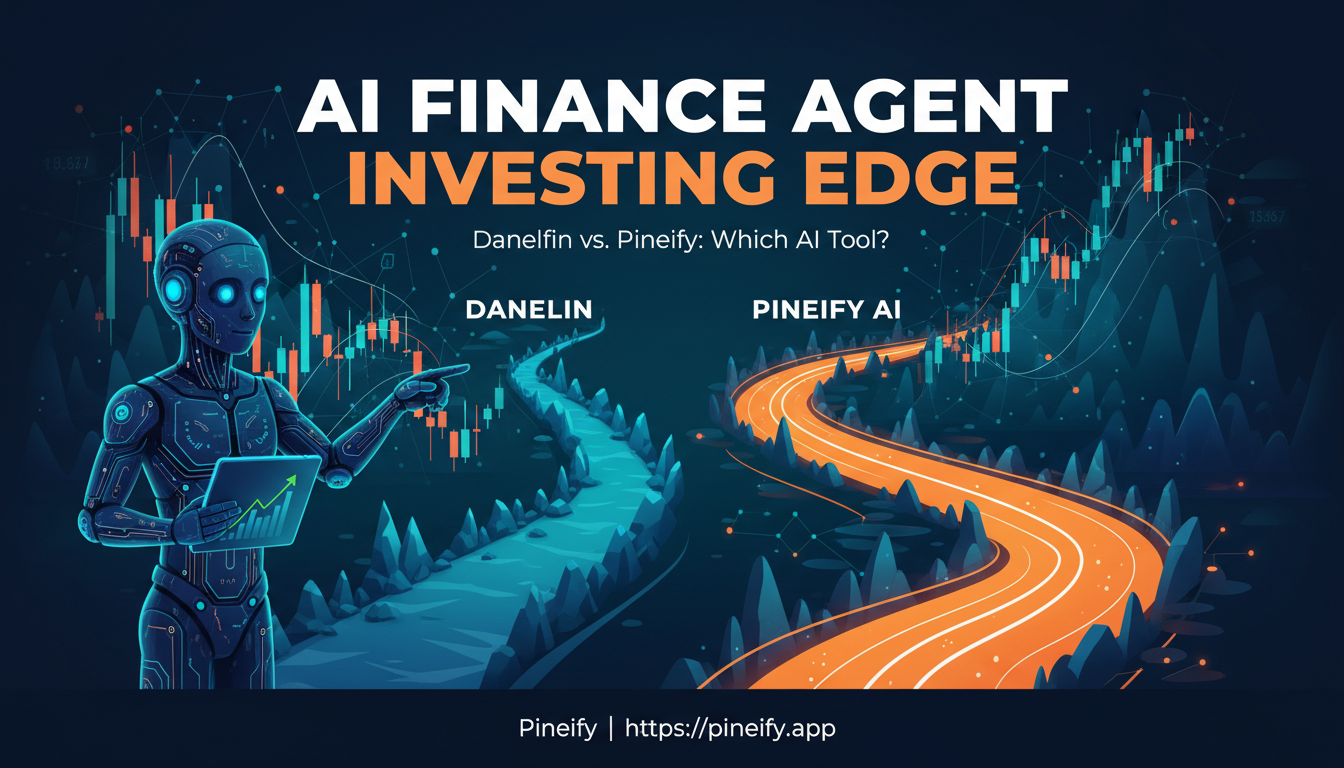
I've tested both Danelfin and Pineify AI Finance Agent over the past few months. Between the two, I believe Pineify gives most active traders a more complete toolkit. Danelfin's clean 1–10 AI scoring system has a solid track record — its top picks gained +376% from January 2017 to June 2025 versus the S&P 500's +166%. But end-of-day updates and limited asset coverage leave real gaps when markets move fast. An AI Finance Agent is a conversational assistant that pulls live market data, SEC filings, analyst reports, and news into a single chat interface. Instead of checking a dashboard, you ask a question and get a data-backed answer in seconds.
A "data point unavailable" message on TradingView is a signal that your chart or indicator can't locate the specific price data you're asking for. It happens when a bar doesn't exist in the historical record, hasn't loaded yet, or is getting filtered out by your chart settings, and it's almost always fixable with a few quick adjustments.
Every trader knows that feeling: you see a signal, act on it, and then—poof—it disappears from the chart a few minutes later. That vanishing act is called repainting, and it's one of the most misleading things you'll run into when trading. A non-repainting indicator is an MT5 tool that calculates signals exclusively from confirmed closed candle data. Once a bar closes and a signal appears, it stays locked — no disappearing, no shifting, no color changes. I've been burned by repainting indicators more times than I'd like to admit, so I put this together to help you avoid the same traps.
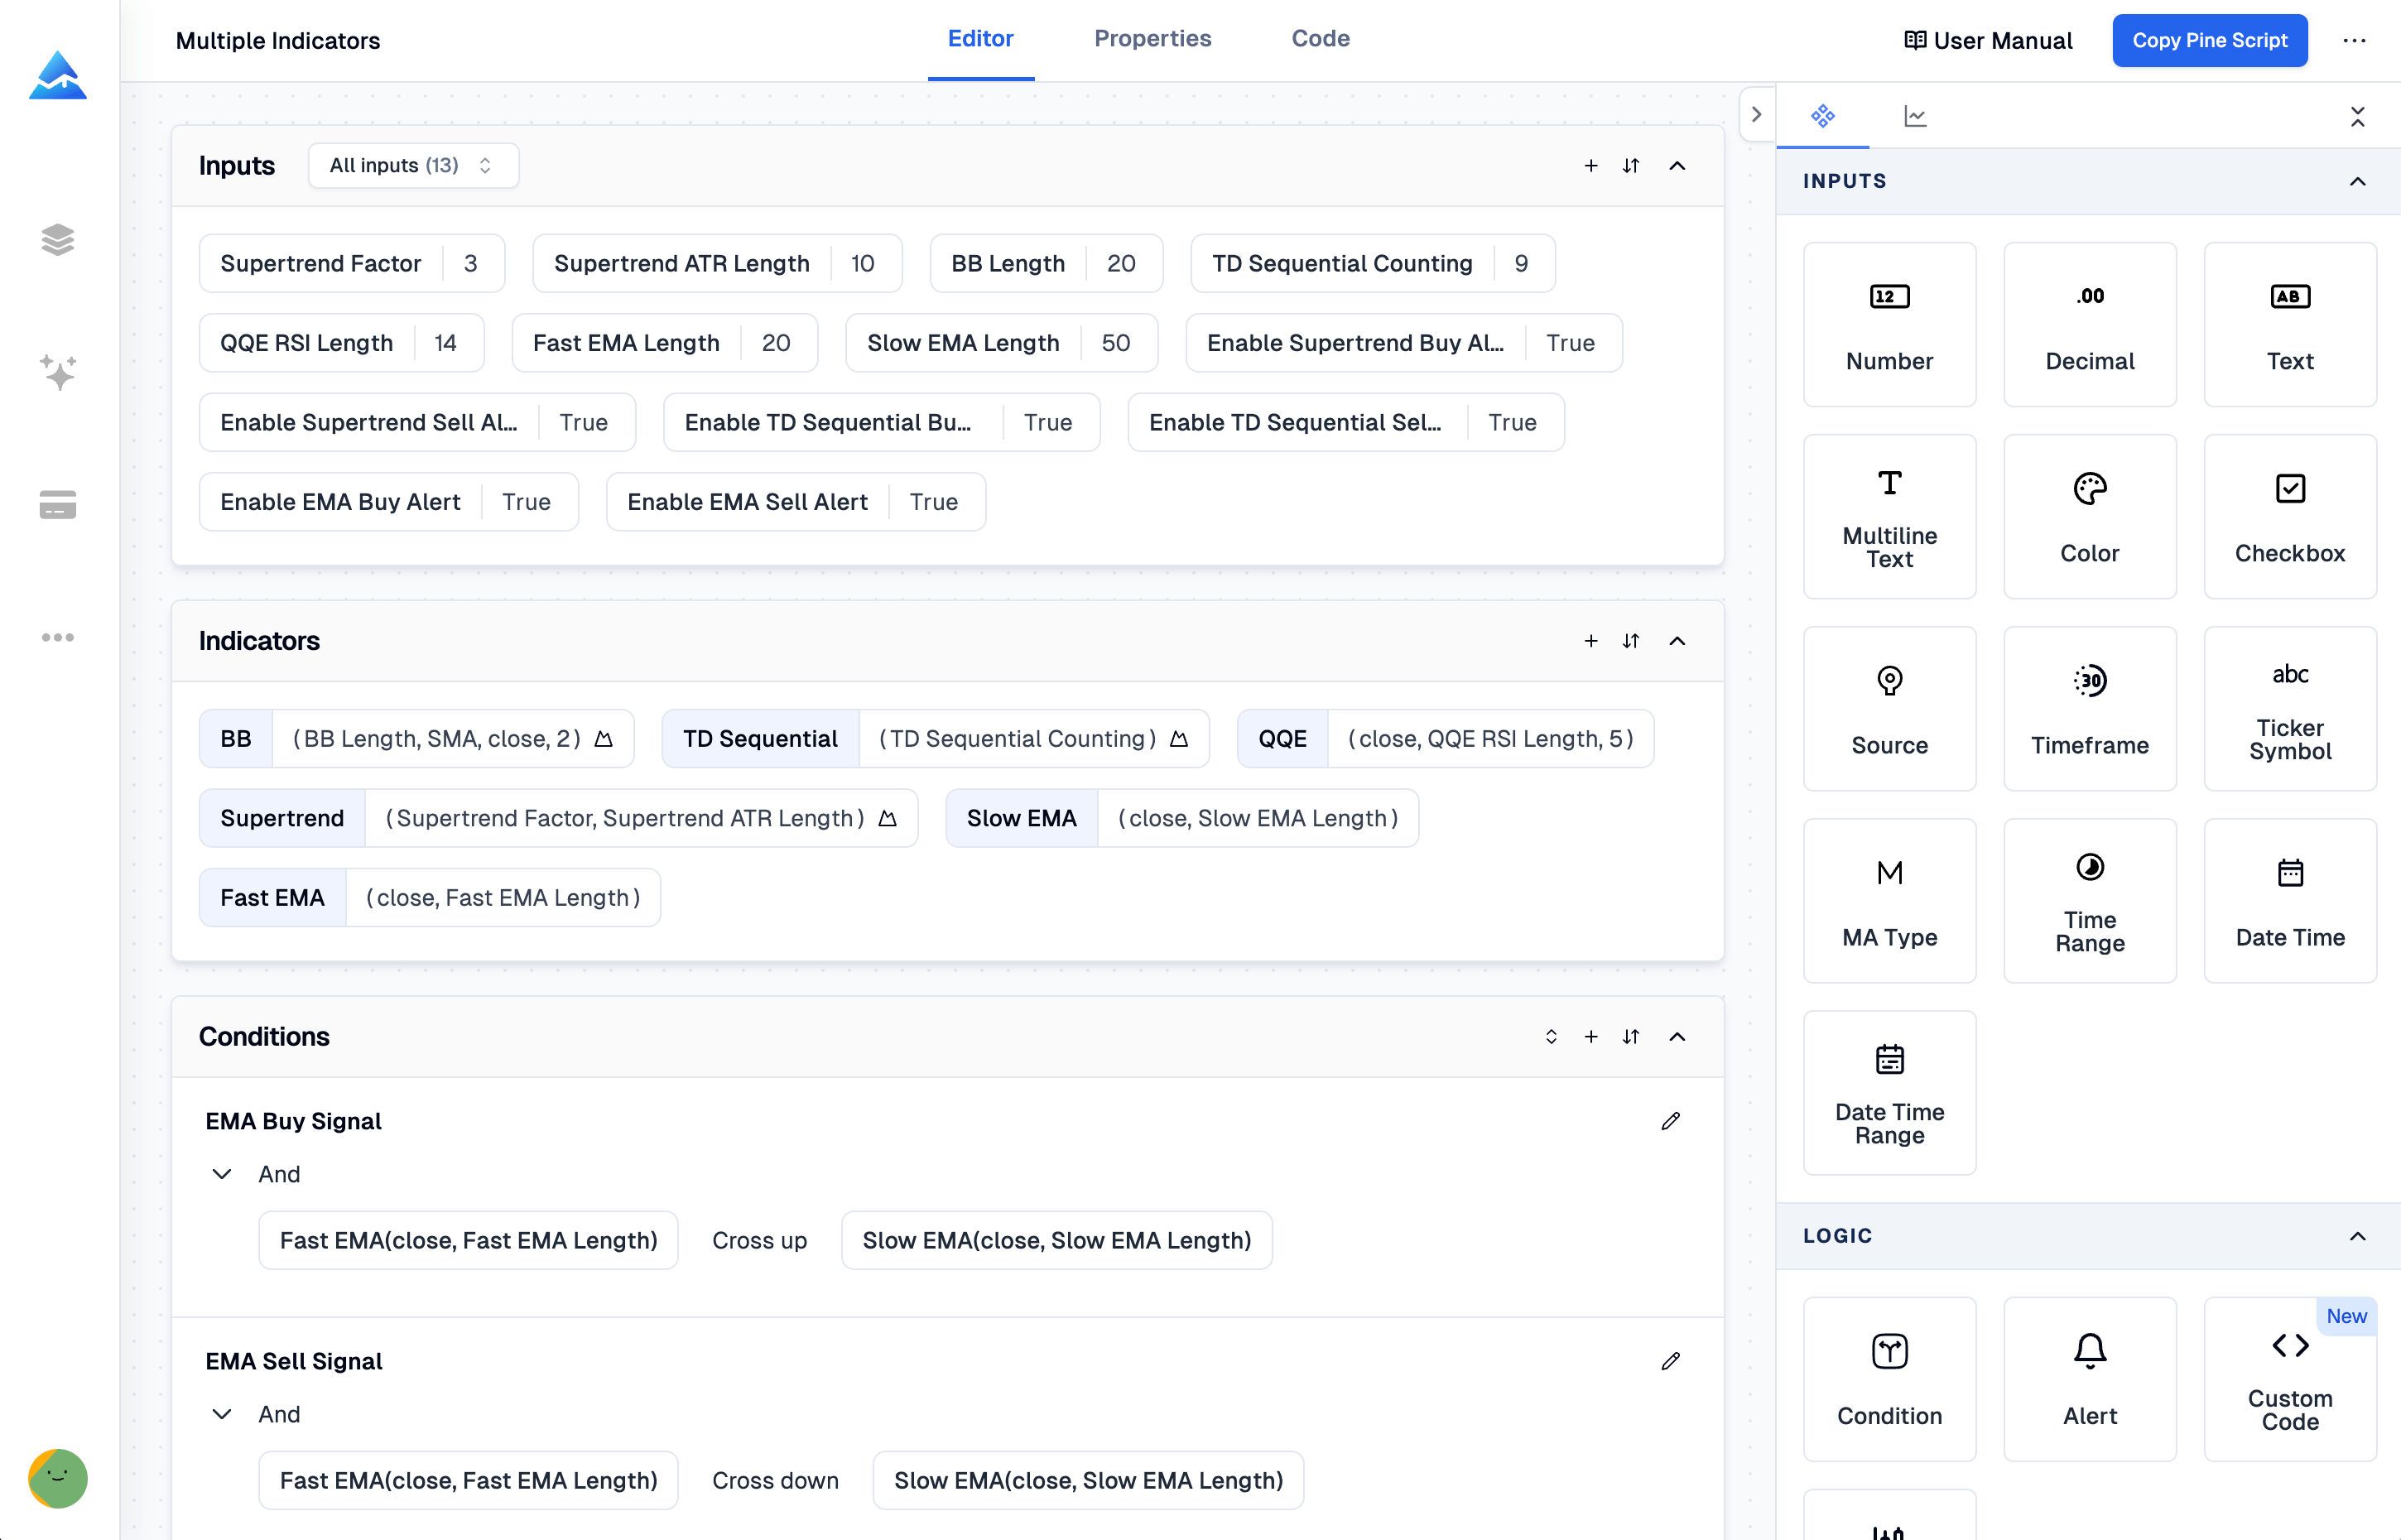
Visual Pine Script Editor is a drag-and-drop builder that generates Pine Script for TradingView automatically — zero manual coding required. EasyLanguage is TradeStation's text-based scripting language that reads like plain English but still demands real code, testing, and debugging. I tested both on AAPL daily data last quarter. For non-programmers who want working indicators fast, the visual editor wins every time. I built my first indicator in under 10 minutes with Pineify. EasyLanguage took me most of a weekend just to get a moving average crossover running without syntax errors.
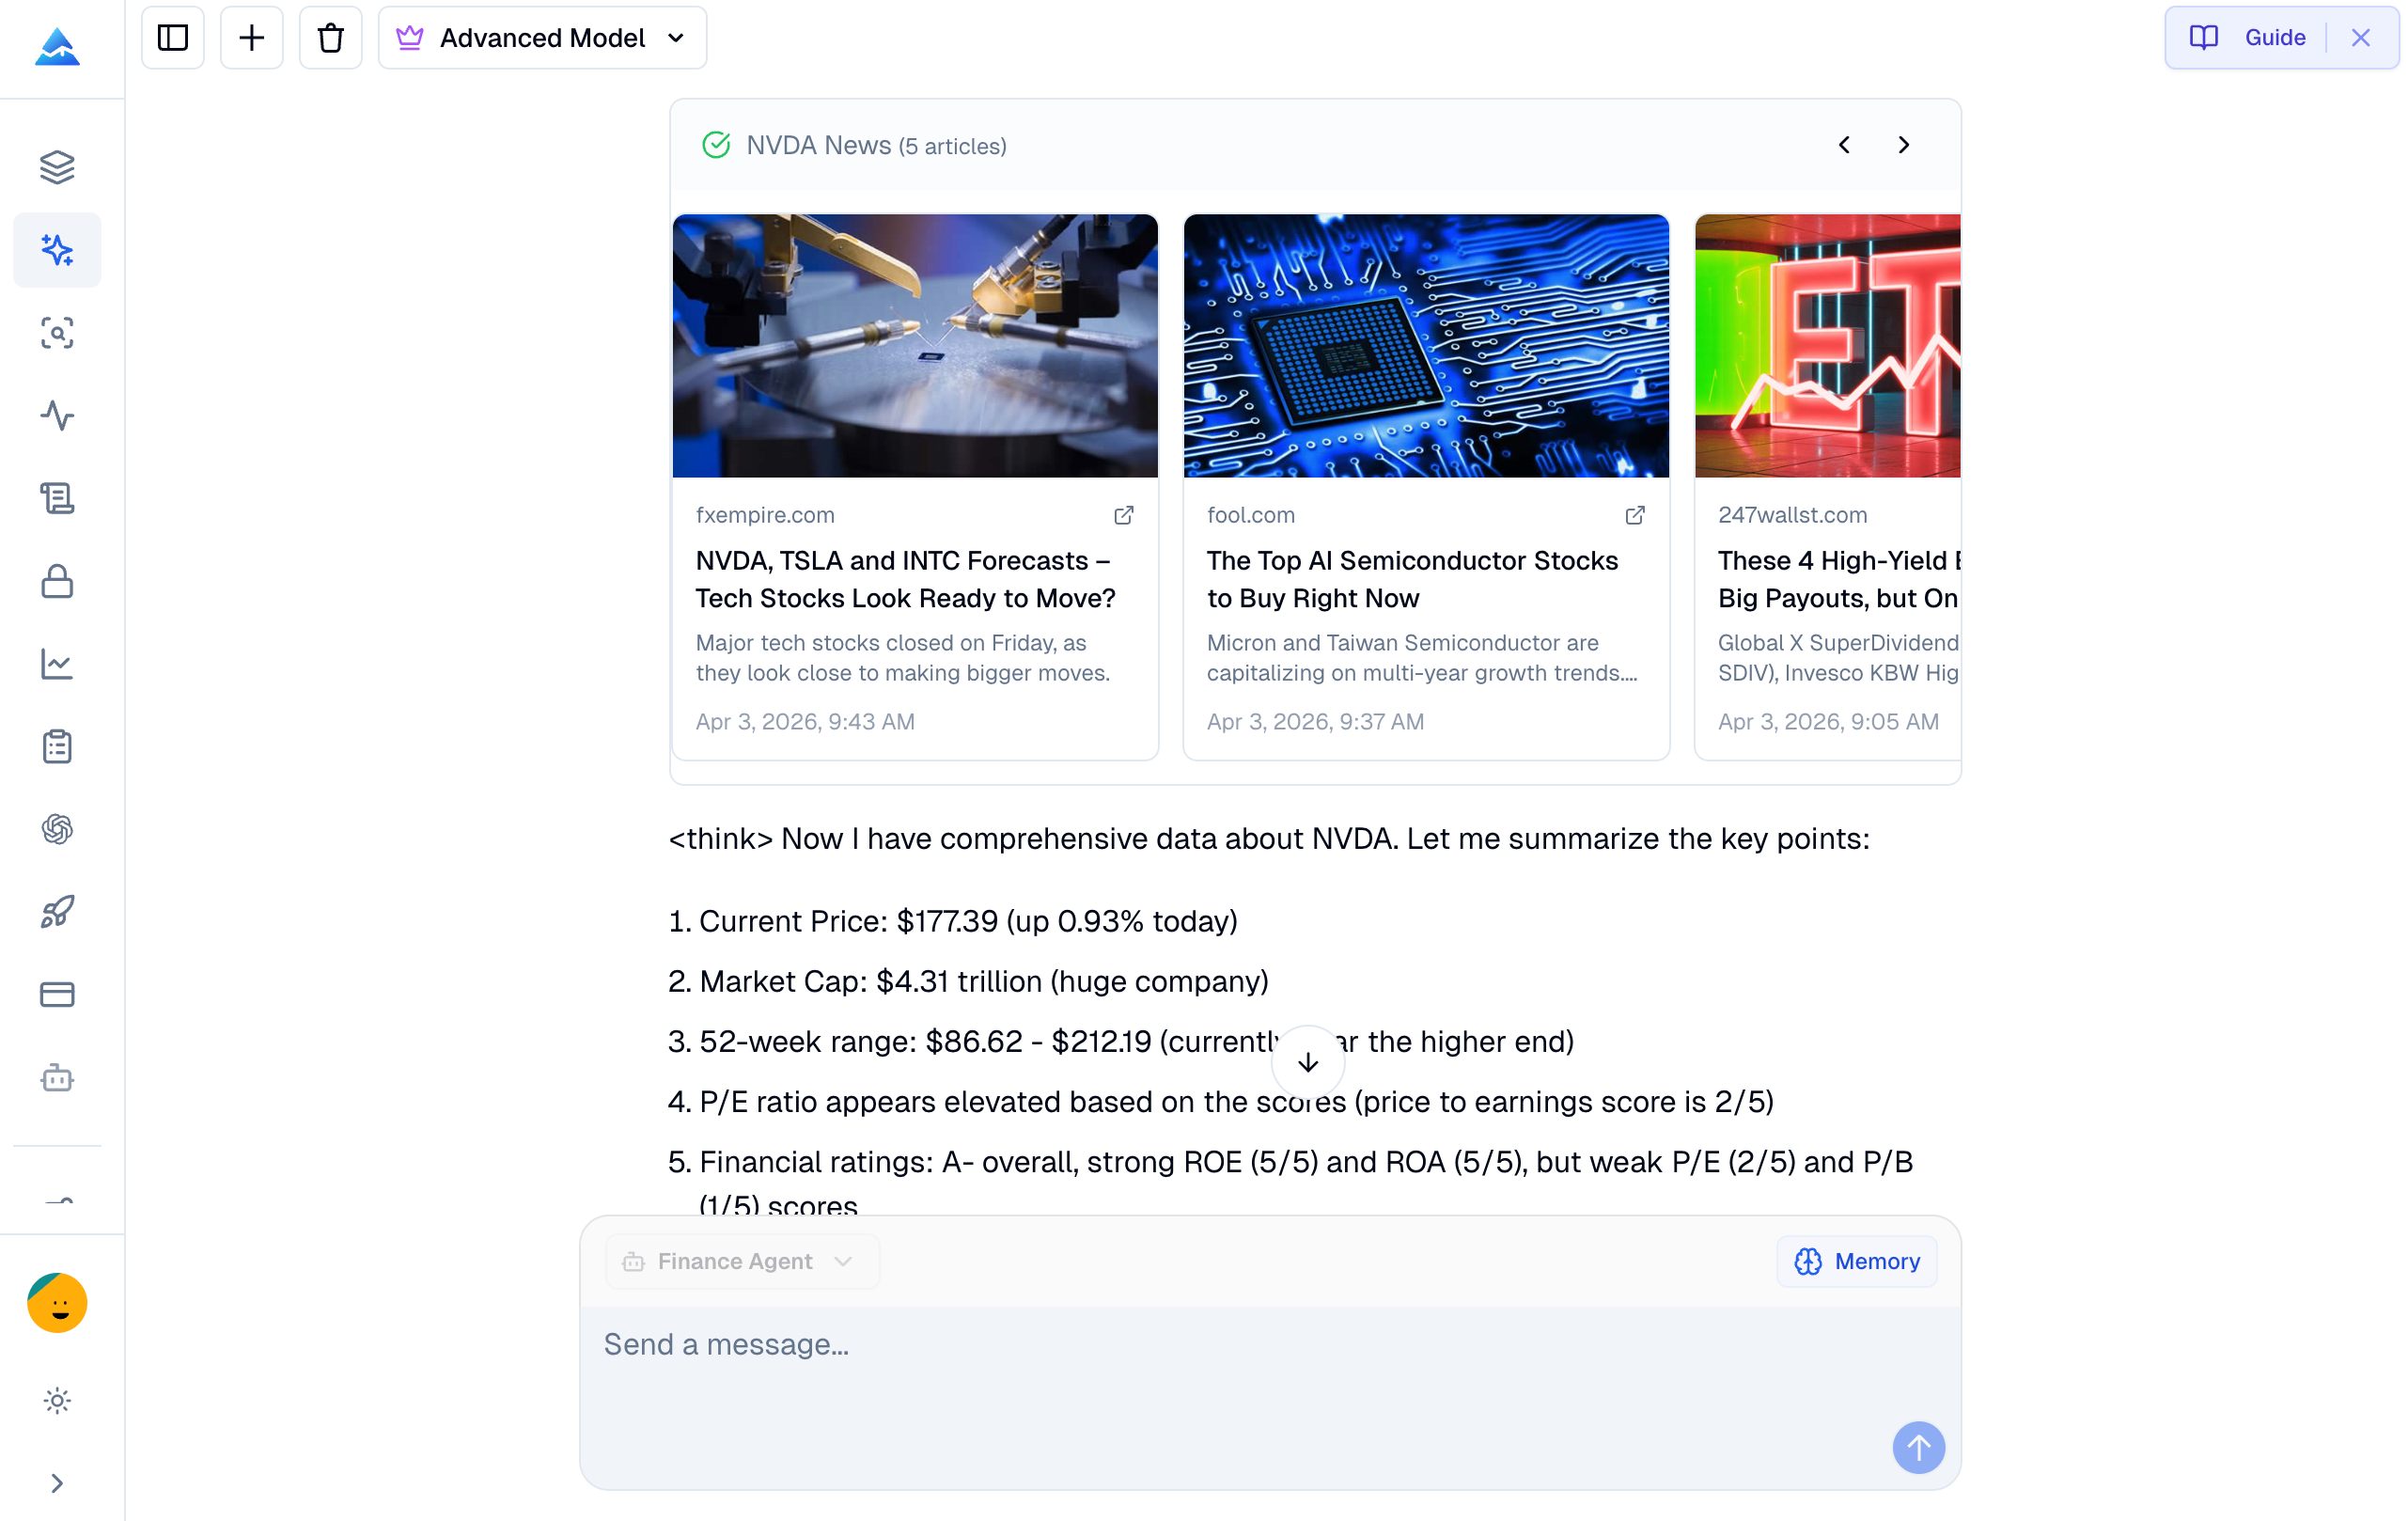
An AI finance chatbot is a conversational tool that pulls live market data to answer investment questions. I've spent months testing both Pineify AI Finance Agent and Perplexity Finance, and here's my verdict: Pineify wins for active traders who need buy/sell signals and options data, while Perplexity is better for long-term research at zero cost. When I was analyzing NVDA options last week, Pineify gave me max pain levels, IV data, and put/call ratios I could actually trade on. Perplexity helped me understand why the semiconductor sector was moving. Different tools, different jobs.
A no-code strategy builder is a tool that lets traders create custom TradingView strategies without writing Pine Script. I tested two of them — DIY Custom Strategy Builder and Pineify — for six weeks, building 20+ strategies on each. Pineify's the better pick for anyone who wants unlimited indicators and backtesting that actually catches weak strategies before you trade them.
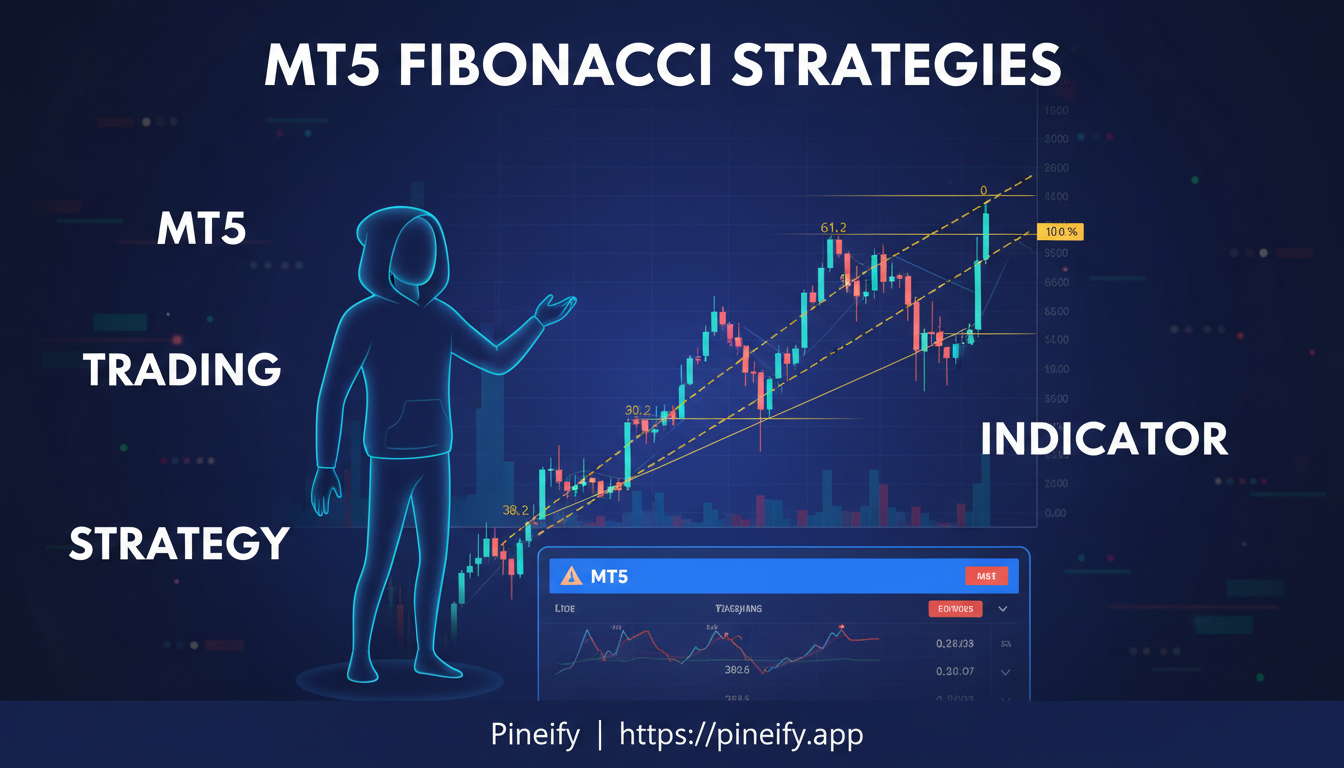
The MT5 Fibonacci indicator is a built-in MetaTrader 5 charting tool that uses Fibonacci sequence ratios to mark out potential support and resistance levels where price tends to reverse or pause. It draws horizontal lines at key percentages like 23.6%, 38.2%, and 61.8% between two selected swing points. Whether you're new to chart analysis or you've been trading for a while, knowing how to set this tool up properly can tighten up your entries and exits.