Have you ever felt overwhelmed staring at multiple indicator windows on TradingView? I get it. One minute you're watching RSI signals, the next you're tracking moving averages, and suddenly your chart looks like someone threw Christmas lights at it.
Here's what changed everything for me: Pine Script lets you combine multiple indicators into one clean script. And honestly? It's way simpler than most people think.
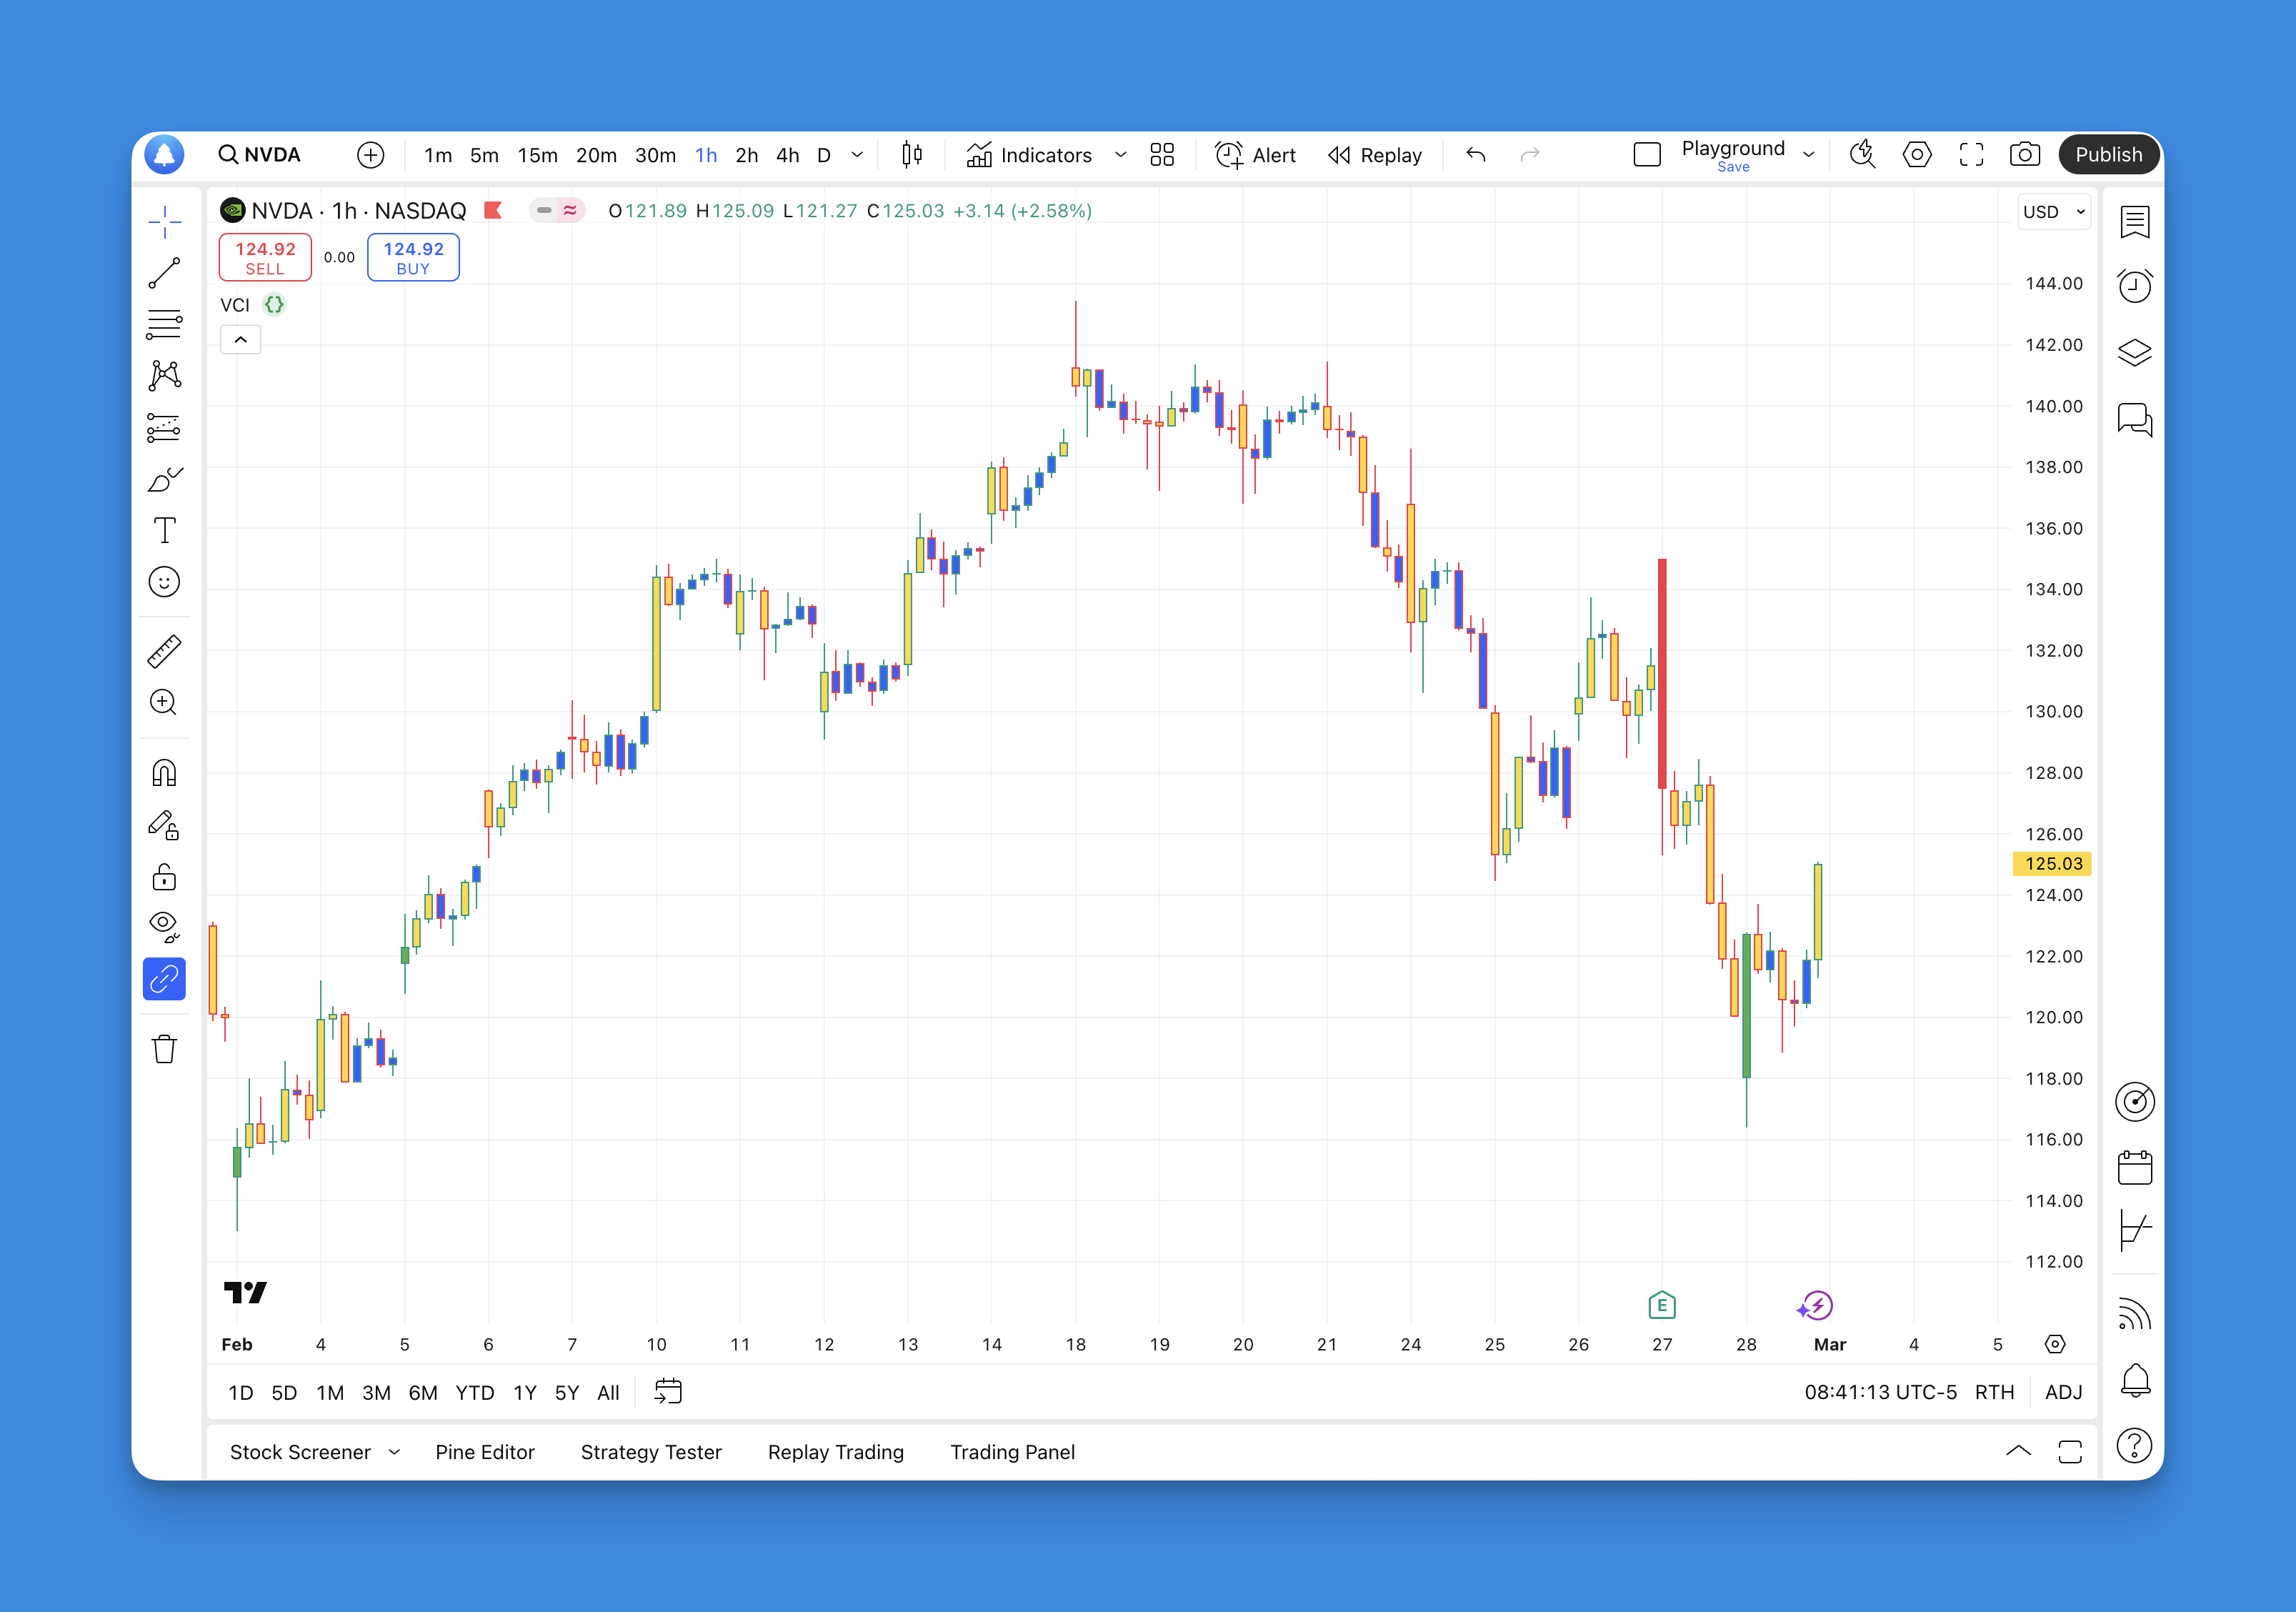
A combined indicator in Pine Script is a single script that calculates two or more technical indicators — like RSI and EMA — and uses their agreement to generate buy or sell decisions. In October 2025, I tested RSI + EMA on AAPL's daily chart and my false entries dropped from roughly 1 in 3 to about 1 in 8.
After years of trading and more trial-and-error than I'd like to admit, I've learned that combining the right indicators filters out the false signals that used to cost me money. I'll show you exactly how to do it, share combinations that actually work, and help you avoid the mistakes I made starting out.
Why Combine Two Indicators Instead of One
Let me be straight with you — relying on a single indicator is like trying to drive while looking through a keyhole. You might see something, but you're missing the bigger picture.
Single indicators can be misleading
I used to live and die by RSI signals. When it hit oversold territory, I'd buy thinking I found a bargain. Then I'd watch the price continue dropping while my account balance did the same. Sound familiar?
Multiple indicators create confirmation
Everything changed when I started waiting for two different indicators to agree. It's like asking for a second opinion before making a big decision. Sure, you might miss some quick moves, but you'll avoid way more bad trades.
Different indicators reveal different market aspects:
- Momentum indicators (RSI or Stochastic) show overbought or oversold conditions
- Trend indicators (EMA or SMA) tell you which direction things are heading
- Volume indicators confirm whether there's real conviction behind a move
- Volatility indicators (Bollinger Bands or ATR) help you understand how wild price swings might get
When multiple types align, that's when you start seeing consistent results. Let me show you how to build this.