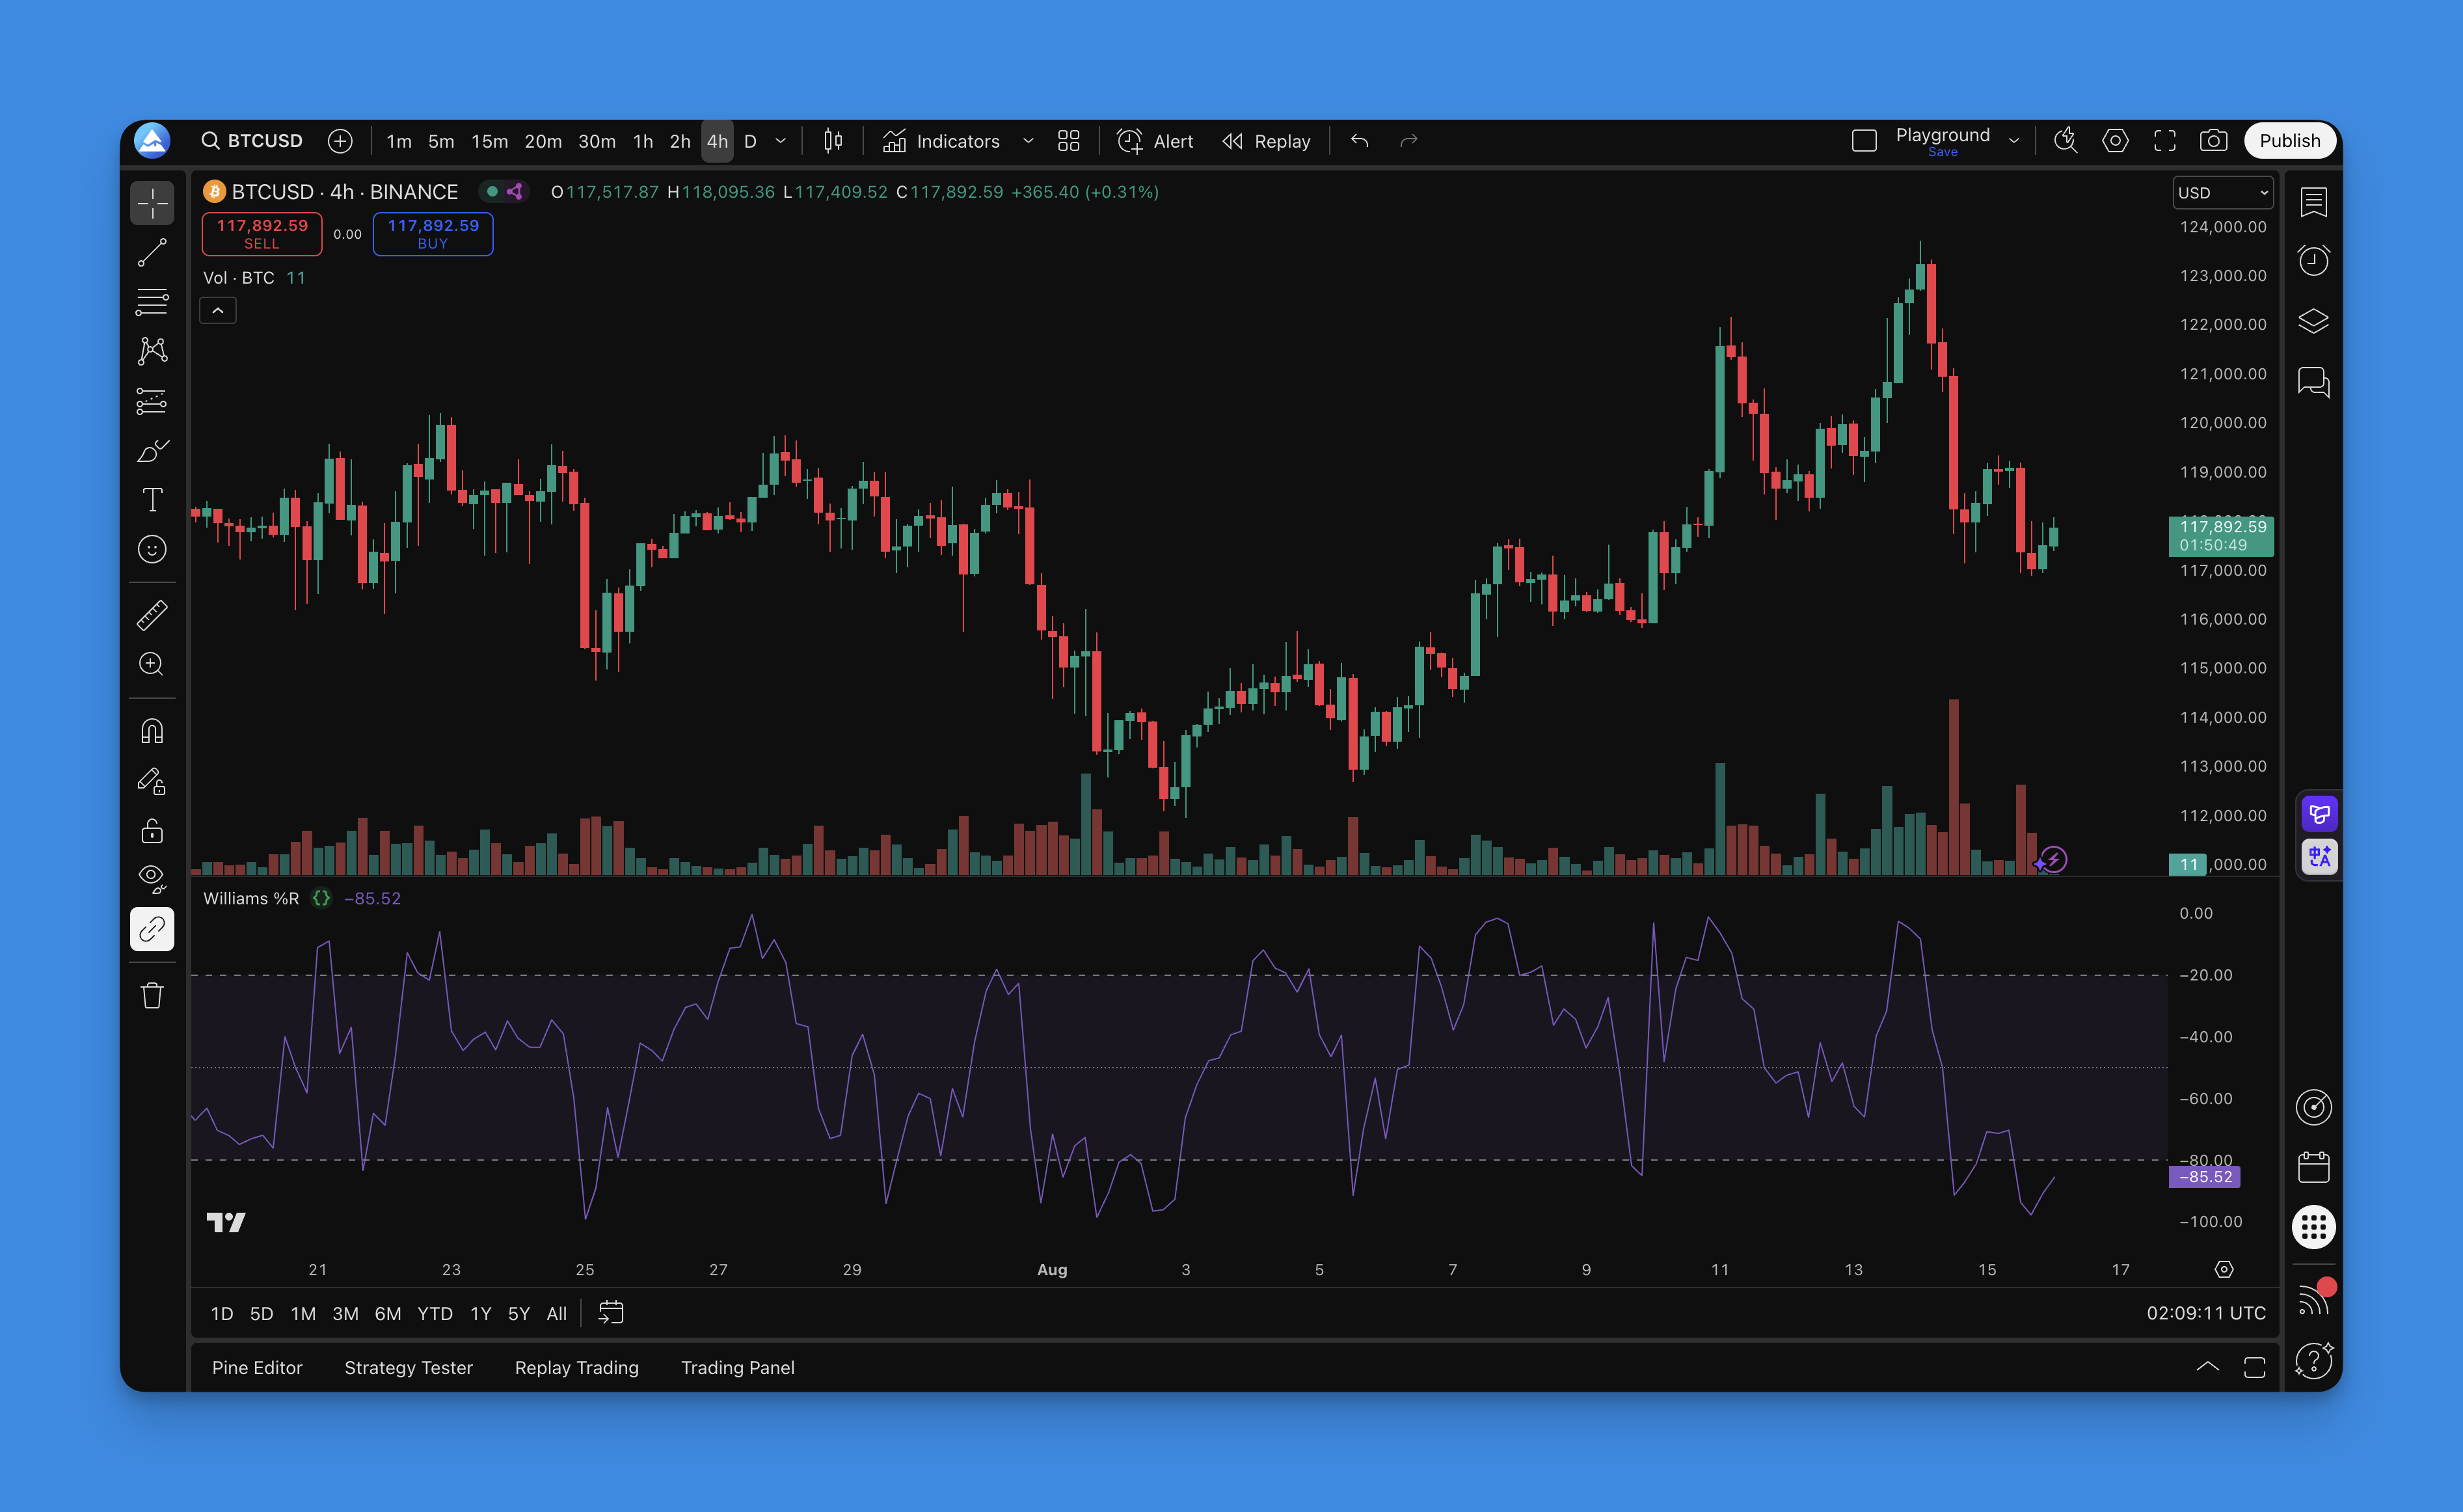
Williams %R Indicator: Williams Percent Range TradingView Settings
The Williams %R indicator has been around since the 1970s, and most people still use it backward. Williams %R (also called Williams Percent Range) is a momentum gauge that swings between 0 and -100, measuring where the current close sits compared to the highest high and lowest low over a lookback period. Larry Williams designed it to catch market reversals, and I've found it works — but only if you interpret the signals correctly.
What is Williams %R Indicator?
The math behind it is straightforward:
%R = (Highest High - Close) / (Highest High - Lowest Low) × -100
Here's what each piece means:
- Highest High: The peak price over your chosen lookback period
- Lowest Low: The bottom price during that same period
- Close: Today's closing price
Most people default to 14 periods, but I've stopped using that as my go-to. Day traders often prefer shorter periods like 5 or 9, while swing traders get better results with 21 or 30. The key levels everyone watches are -20 (overbought) and -80 (oversold). When %R crosses those lines, things get interesting.
How to add Williams %R Indicator to TradingView?

Williams %R takes about a minute to get onto your charts:
- Open Pineify: Head to Pineify.app and launch the Pine Script editor
- Search: Type "Williams %R" or "%R" in the indicator library
- Select: Pick the Williams %R option you want
- Customize visually: Adjust period, colors, and threshold levels through the interface
- Generate: Pineify produces clean Pine Script automatically
- Copy to TradingView: Paste the code into the Pine Editor
- Apply: Add the indicator to your chart
I like this approach because you can experiment with different settings without touching syntax. If you want to combine Williams %R with other tools, our collection of free TradingView indicators covers what pairs well.

How to use Williams %R?
Williams %R is all about catching market exhaustion. Here's what the levels actually mean:
- -20 to 0: Overbought — price has run up fast and might stall
- -50: Neutral — no strong directional bias
- -80 to -100: Oversold — selling might be overdone
Entry Signals I Actually Use
I've spent a year testing this indicator on different markets. Here's what I settled on:
Buy when:
- %R crosses back above -80 after sitting in oversold territory
- Bullish divergence forms — price makes lower lows but %R makes higher lows
- %R climbs above -50 after oversold conditions
Sell when:
- %R drops below -20 from overbought
- Bearish divergence appears — price makes higher highs but %R makes lower highs
- %R crosses below -50 after overbought levels
I started using a 21-period Williams %R on Tesla (TSLA) weekly charts in April 2024. The bearish divergence in July caught an 18% pullback almost perfectly. That trade made me trust divergence over simple crossovers.
On the flip side, I haven't tested Williams %R on crypto nearly enough. My 14-period setup on Ethereum (ETH) daily charts gave three false buy signals in August 2024 — all during a strong uptrend where the indicator stayed oversold for days. That's a real limitation worth knowing.
For my swing trades on Microsoft (MSFT), I prefer reading divergences over the -20/-80 crossovers. The bullish divergence in October 2024 signaled an entry that returned about 7% in three weeks. Would it work every time? No. But I'll take those odds.
Settings That Work
| Trading Style | Timeframe | Period | Overbought/Oversold |
|---|---|---|---|
| Scalping | 1-5 min | 5 | -15/-85 |
| Day Trading | 15 min | 9 | -20/-80 |
| Swing Trading | 1-4 hour | 14-21 | -20/-80 |
| Position Trading | Daily/Weekly | 21-30 | -25/-75 |
These aren't hard rules, just starting points. Volatile markets like crypto or small-cap stocks need wider thresholds like -15/-85. Slower markets like major forex pairs may need -25/-75 to filter noise.
Divergence: The Real Power Move
Divergence is where Williams %R earns its keep:
- Bullish Divergence: Price drops to lower lows, but %R prints higher lows — selling pressure is fading.
- Bearish Divergence: Price climbs to higher highs, but %R makes lower highs — buying momentum is dying.
These patterns carry more weight on higher timeframes. I've seen weekly divergences on Apple (AAPL) predict reversals weeks in advance. Daily divergences are faster but less reliable. If you're layering indicators, these Pine Script v6 strategy examples show how to combine them effectively.
Backtesting a Williams %R Strategy
Backtesting separates real setups from wishful thinking. Here's my process.
Building Your Strategy
Start with clear rules:
-
Entry signals:
- Go long when %R crosses above -80 from oversold
- Go short when %R crosses below -20 from overbought
-
Exit plan:
- Take profit at 1.5-2% (adjust for your market's volatility)
- Stop loss at 1-1.5%
- Trailing stop at 0.5-1%
-
Risk management:
- Risk no more than 1-2% per trade
- Limit open positions to avoid overexposure
- Set daily loss limits
Using Pineify to Backtest
Pineify's strategy builder handles the coding — you configure rules visually, it generates the Pine Script. I ran a 14-period Williams %R strategy on S&P 500 futures (ES) from January to December 2024. Win rate landed at 47%, profit factor was 1.35, max drawdown hit 14%. Not incredible, but solid for a single-indicator system.
When you run your own tests, focus on:
- Win rate: 40-60% is realistic
- Profit factor: Above 1.2 means you're making more than you lose
- Max drawdown: Keep it under 20%
- Sharpe ratio: Higher is better for risk-adjusted returns
Pineify lets you swap settings side by side — try 9 periods vs 21, adjust thresholds, compare results. For more on exits, check our guides on stop loss strategies and trailing stops.
Williams %R is one oscillator I keep coming back to — not because it's perfect, but because divergence on weekly charts has saved me from some bad trades. Match your settings to your market and never trade the indicator alone. Our Pine Script v6 guide covers the latest scripting features if you want to go deeper.
Frequently Asked Questions
What is the Williams %R indicator and how does it work?
Williams %R (Williams Percent Range) is a momentum oscillator Larry Williams created in the 1970s. It measures where the current close sits relative to the highest high and lowest low over a lookback period, oscillating between 0 and -100. Readings near 0 signal overbought conditions; readings near -100 signal oversold. The formula is %R = (Highest High - Close) / (Highest High - Lowest Low) × -100.
What are the best Williams %R settings for TradingView?
The 14-period default works for swing trading. For day trading on 1-15 minute charts, use 5-9 periods for faster signals. Swing traders on 1-4 hour charts get a good balance with 14-21 periods. Position traders on daily or weekly charts should use 21-30 periods. Standard overbought/oversold levels are -20 and -80, but you can push them to -15/-85 for volatile markets like crypto.
How is Williams %R different from the RSI indicator?
Both measure momentum, but they scale differently. RSI ranges from 0 to 100 with overbought above 70 and oversold below 30. Williams %R ranges from 0 to -100 with overbought near 0 and oversold near -100. Williams %R reacts faster to recent price changes because it uses the highest high directly, making it more sensitive to short-term reversals than RSI's smoothed approach.
How do I use Williams %R divergence signals on TradingView?
Divergence is the strongest Williams %R signal in my experience. Bullish divergence happens when price makes lower lows but Williams %R makes higher lows — selling pressure is fading. Bearish divergence is the opposite: price makes higher highs but Williams %R makes lower highs, telling you buying momentum is running out. Always confirm divergence with price action or volume before entering.
Can I add Williams %R to TradingView without coding?
Yes — add the built-in Williams %R indicator from TradingView's indicator search bar with zero coding. Or use Pineify's visual editor to customize settings and generate Pine Script code automatically. Either way, you don't need to write syntax manually.
What are the limitations of the Williams %R indicator?
Williams %R throws frequent false signals in strongly trending markets — prices can stay overbought or oversold for days. Like most oscillators, it performs best in ranging or choppy markets, not strong trends. Don't use it alone. Pair it with trend confirmation, volume analysis, or other momentum indicators.
How do I backtest a Williams %R strategy in Pine Script?
Define your entry rules — for example, go long when %R crosses above -80 — and set exits like take profit, stop loss, or trailing stop. Pineify's strategy builder lets you configure all of this visually and generates the Pine Script code. Paste it into TradingView's Pine Editor and run the Strategy Tester to check win rate, profit factor, max drawdown, and Sharpe ratio.