Free TradingView Indicators That Actually Work (No, Really)
So TradingView keeps jacking up their prices (I swear they change the pricing tiers every other Tuesday), but here's the thing — their free tier? Still pretty damn solid. Like, embarrassingly good for what you pay, which is... well, nothing.
Free TradingView indicators are built-in and community-made tools that cost zero dollars to add to any chart. They cover trend, momentum, volatility, and volume analysis without requiring a paid plan. I've been watching this space since 2018, maybe 2019, and I've seen traders build whole strategies on free stuff that would make your hedge fund buddy's Bloomberg terminal blush.
Here's what the free stuff can actually do for you:
- Catch momentum shifts before your coffee gets cold (speaking of which, mine's probably cold now)
- Fire alerts while you're doom-scrolling Twitter at 2 AM
- Keep your wallet fat while you're figuring out what the hell you're doing
But — and this is important — not all free indicators are created equal. Some are absolute garbage. Trust me, I've tested probably hundreds at this point. My browser history is basically just TradingView scripts and cat videos.
How I Actually Picked These (Spoiler: I Didn't Just Sort by "Most Popular")
Look, everyone and their grandmother has a "top indicators" list. Here's how I did it differently — I actually used these things. Through bull markets, bear markets, and whatever the hell 2022 was.
| What I Actually Cared About | Why Your Wallet Will Thank Me |
|---|---|
| Doesn't repaint | Because there's nothing worse than thinking you nailed a trade, then watching your "perfect" signal vanish like my motivation on a Monday |
| Real people use it | Not just bot downloads. I'm talking actual humans in Discord servers and Reddit threads saying "yeah, this thing actually works" |
| Works on everything | Crypto at 3 AM? Sure. SPY during lunch? Why not. That random forex pair your buddy won't shut up about? Go for it |
| Actually free | No "free trial" nonsense. No "upgrade to Pro" popups. Just... free. |
| You can understand it | Look, if the code comments are in broken English and the settings make zero sense, hard pass |
The "Boring" Ones That Still Kick Ass (Don't @ Me)
Everyone wants the shiny new thing. Meanwhile, these old dogs are still hunting. Been around since TradingView was basically just a fancy charting website.
RSI — Yeah, That RSI
Before you roll your eyes so hard they fall out of your head, hear me out. This thing? It's like that friend who's always late but somehow always knows where the party is. Simple, reliable, and weirdly psychic about reversals.
My settings: 14 periods because I'm basic, 70/30 because I'm not trying to reinvent the wheel here. Sometimes I'll bump it to 80/20 if Bitcoin's being particularly spicy.
Real talk: When RSI diverges from price? That's your "hey dummy, pay attention" moment. I caught a BTC/USD top on March 14, 2024 using RSI divergence alone — price made a higher high, RSI didn't. Dropped 8% in three days. I break down the specific divergence setups in another post if you want the full playbook.
MACD — The Granddaddy of Trend Following
Twelve, twenty-six, nine. Sounds like a weird locker combination, right? But somehow these random numbers catch trends better than most hedge fund managers. I don't make the rules.
Pro move: The histogram divergence on higher timeframes? That's where the magic happens. I spotted a bearish MACD divergence on AAPL's weekly chart in August 2023 — the stock dropped 12% over the next month. I've written more about MACD settings and strategies if you want to dig deeper.

Bollinger Bands — Volatility's Crystal Ball
John Bollinger probably never imagined his creation would become the backbone of every crypto trader's strategy, but here we are. Twenty-period moving average, two standard deviations. Boom. Done.
Here's what actually works: When price hugs one band, then RSI hits extreme levels? That's your "this party's almost over" signal. I've seen it work on everything from Bitcoin to TSLA. The Bollinger Band squeeze setup is a solid next read if you trade low-volatility breakouts.
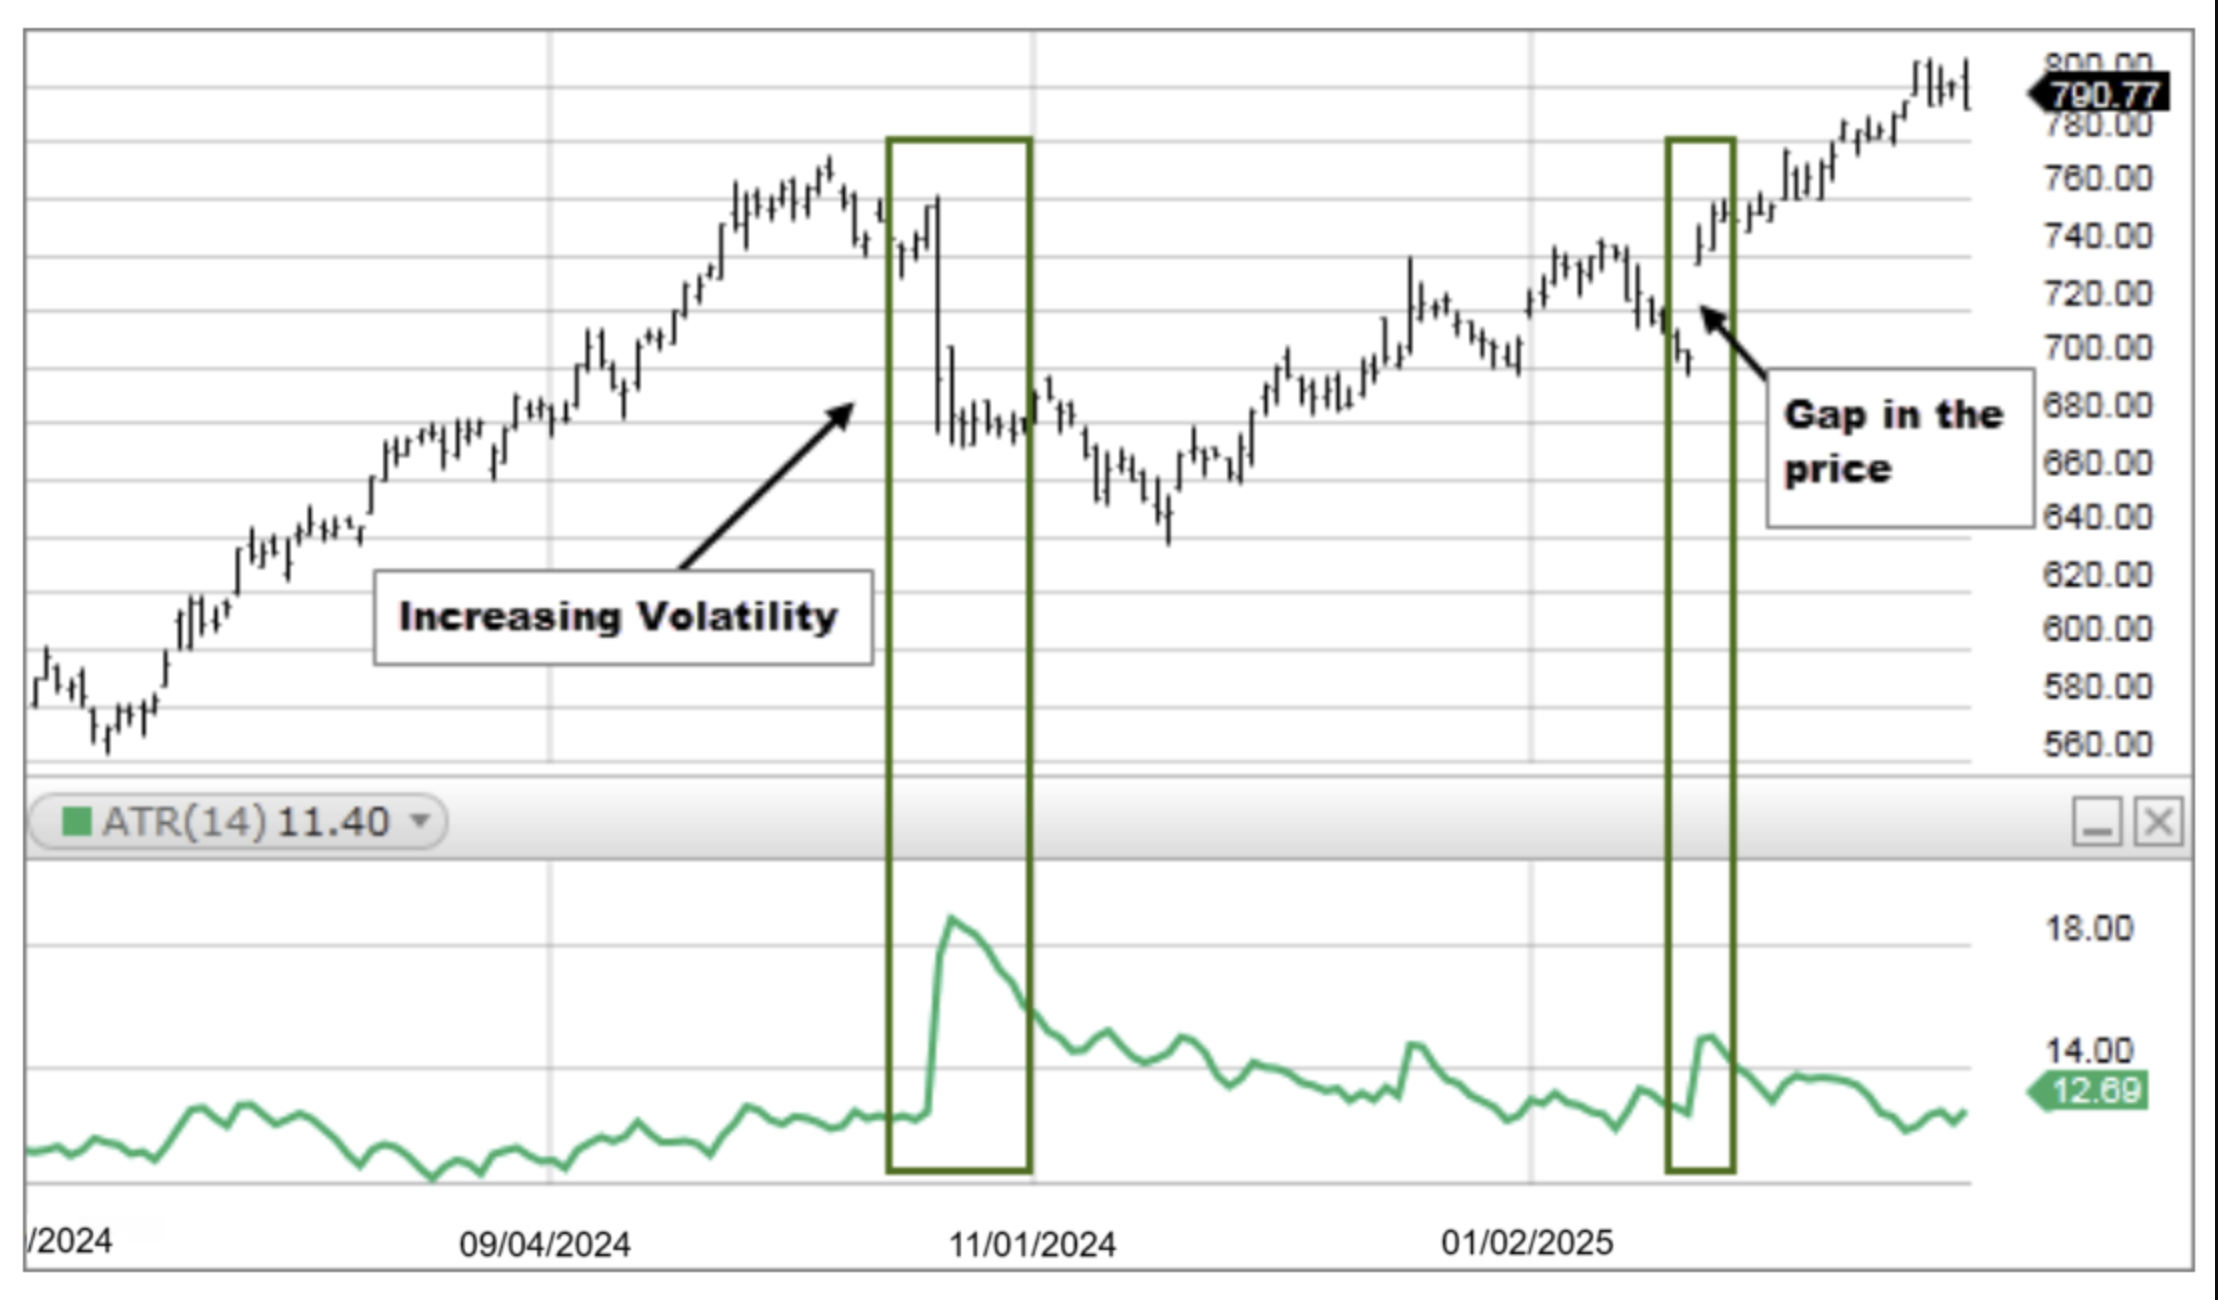
ATR — The "How Much Will This Hurt?" Meter
Average True Range sounds fancy, but really it's just asking "how much does this thing usually move?" For EUR/USD, ATR 14 on the daily sits around 70-90 pips most days. Useful for position sizing, stop losses, and answering that eternal question: "Am I being too greedy or too paranoid?"
Volume Profile — Wait, This Is Free?
Yeah, I was shocked too. One volume profile at a time for free users, but honestly? That's usually enough. Shows you where the real action happened, where the big boys placed their orders. It's like having X-ray vision for support and resistance.
The Community Scripts That Made Me Go "Holy Sh*t"
These aren't your grandpa's indicators. These are the ones that make you wonder "how is this even free?" Created by actual wizards who apparently just... give their work away? The internet's weird.
| My Actual Ranking | What It Is | Who Made It | Why I Care |
|---|---|---|---|
| 1 | %R Trend Exhaustion | upslidedown on Reddit | This thing called the top in November 2021. Like, exactly. Still gives me chills. |
| 2 | CM_Ultimate RSI MTF | Chris Moody | Multi-timeframe RSI without the usual MTF jankiness. How? Witchcraft, probably. |
| 3 | WaveTrend Oscillator | LazyBear | Sounds like a surfboard, acts like a crystal ball. Catches swings before they happen. |
| 4 | Buyside/Sellside Liquidity | Coding Nexus | Shows where stop losses get hunted. Depressing but useful. |
| 5 | TDI | Juan Ortiz | RSI + Bollinger Bands + Moving Average. It's like indicator inception. |
| 6 | Supertrend Multi-TF | KULDEEP157 | Trend direction with ATR-based stops. Simple, effective, no BS. |
| 7 | Anchored VWAP | Brian Shannon | Institutional levels without the institutional price tag. |
| 8 | Stochastic RSI | Built-in but slept on | Momentum squared. For when regular RSI isn't enough. |
Getting Started Without Losing Your Mind
- Don't add everything at once — seriously, your chart will look like a Christmas tree
- Read the source code comments — yeah, I know, reading. But the good ones actually explain what the hell is happening
- Test on historical data first — nothing worse than realizing your "perfect" indicator repaints like cheap paint in the rain
- Start small — one indicator, one timeframe, one asset. Master it before you go full ADHD mode
How to Not Overload Your Chart (Learn From My Mistakes)
I once had a chart with so many indicators I couldn't even see the price. Looked like a Jackson Pollock painting. Here's what actually works:
The "One From Each Bucket" Rule:
- Trend: Supertrend or MACD (pick one, not both)
- Momentum: RSI or WaveTrend (again, choose your fighter)
- Volatility: ATR or Bollinger Bands (you get the idea)
- Volume: VPVR or those liquidity zones
- Confirmation: Anchored VWAP for that "where should price be?" vibe
Two to four indicators max. Your eyes (and your wallet) will thank you.
Finding the Next Big Thing (Before Everyone Else)
The featured scripts page? Solid starting point. But here's where the real gems hide:
- Sort by "trending" — shows what's gaining traction right now
- Reddit's r/TradingView — actual humans sharing actual results (and actual failures)
- Discord servers — some of these indicator creators hang out in niche servers, dropping hints like breadcrumbs
- Compare function — overlay multiple scripts to see which one actually called the move
- Read the Pine code — even if you're not a coder, comments tell the story
When Free Won't Cut It
I've hit this wall more times than I can count — an indicator that's 85% there but missing one filter. Maybe it needs an ATR-based stop. Maybe the alerts fire at weird hours when I'm actually asleep.
Pineify lets you describe what you want in plain English and it generates the Pine Script. "Add a 21 EMA crossover alert to this." Done. 23,000+ traders have used it to create 90,000+ custom indicators so far.
Fair warning — the AI-generated code still needs real testing. I've had outputs that looked great in theory but fell apart during certain market regimes. You won't escape backtesting. But it beats paying a freelancer who might disappear mid-project.
Frequently Asked Questions
▶What is the best RSI setting for day trading?
14-period with 70/30 works for most day traders I've talked to. If the market's trending hard, bump it to 80/20 — everything's relative. Honestly though, RSI divergence against price has been way more reliable for me than waiting for overbought lines to cross.
▶How do I install community scripts on TradingView?
Open the indicators panel, hit Community Scripts, type the name, click Add to Chart. WaveTrend by LazyBear and Supertrend by KULDEEP157 are both free. One thing I'd recommend — skim the source code comments before you trade off it. Some of these scripts have quirks the description won't tell you about.
▶Can I use Bollinger Bands and RSI together?
Yeah, that's one of my favorite combos. When price kisses a Bollinger Band and RSI hits extreme levels at the same time? I've seen that reversal signal hold up on crypto, stocks, and forex. Not every time, but enough that I still watch for it.
▶What is the difference between Supertrend and MACD?
Supertrend plots buy/sell arrows right on your chart using ATR math — dead simple, great for clean trends. MACD tracks momentum with crossovers and histogram bars. I'd pick Supertrend when the market's clearly trending one direction, and MACD when I want to catch momentum shifts early. They do different jobs.
▶Are free TradingView indicators really free forever?
Built-in stuff like RSI, MACD, and Bollinger Bands — yep, free, no catches. Community scripts too. One limit I've hit: free accounts only get one Volume Profile at a time. But everything I listed here? Actually free. I wouldn't waste your time listing stuff that expires after a trial.
▶How many indicators should I put on one chart?
Two to four, seriously. I learned this the hard way — my chart looked like a rainbow exploded on it. Pick one from each bucket: trend (Supertrend or MACD), momentum (RSI or WaveTrend), volatility (ATR or Bollinger Bands), and volume (Volume Profile). More than that and you're just watching noise.
These free indicators won't make you a millionaire overnight. Nothing will. But they'll give you a fighting chance without emptying your bank account. The best indicator is the one you actually understand — everything else is just expensive wallpaper for your charts.