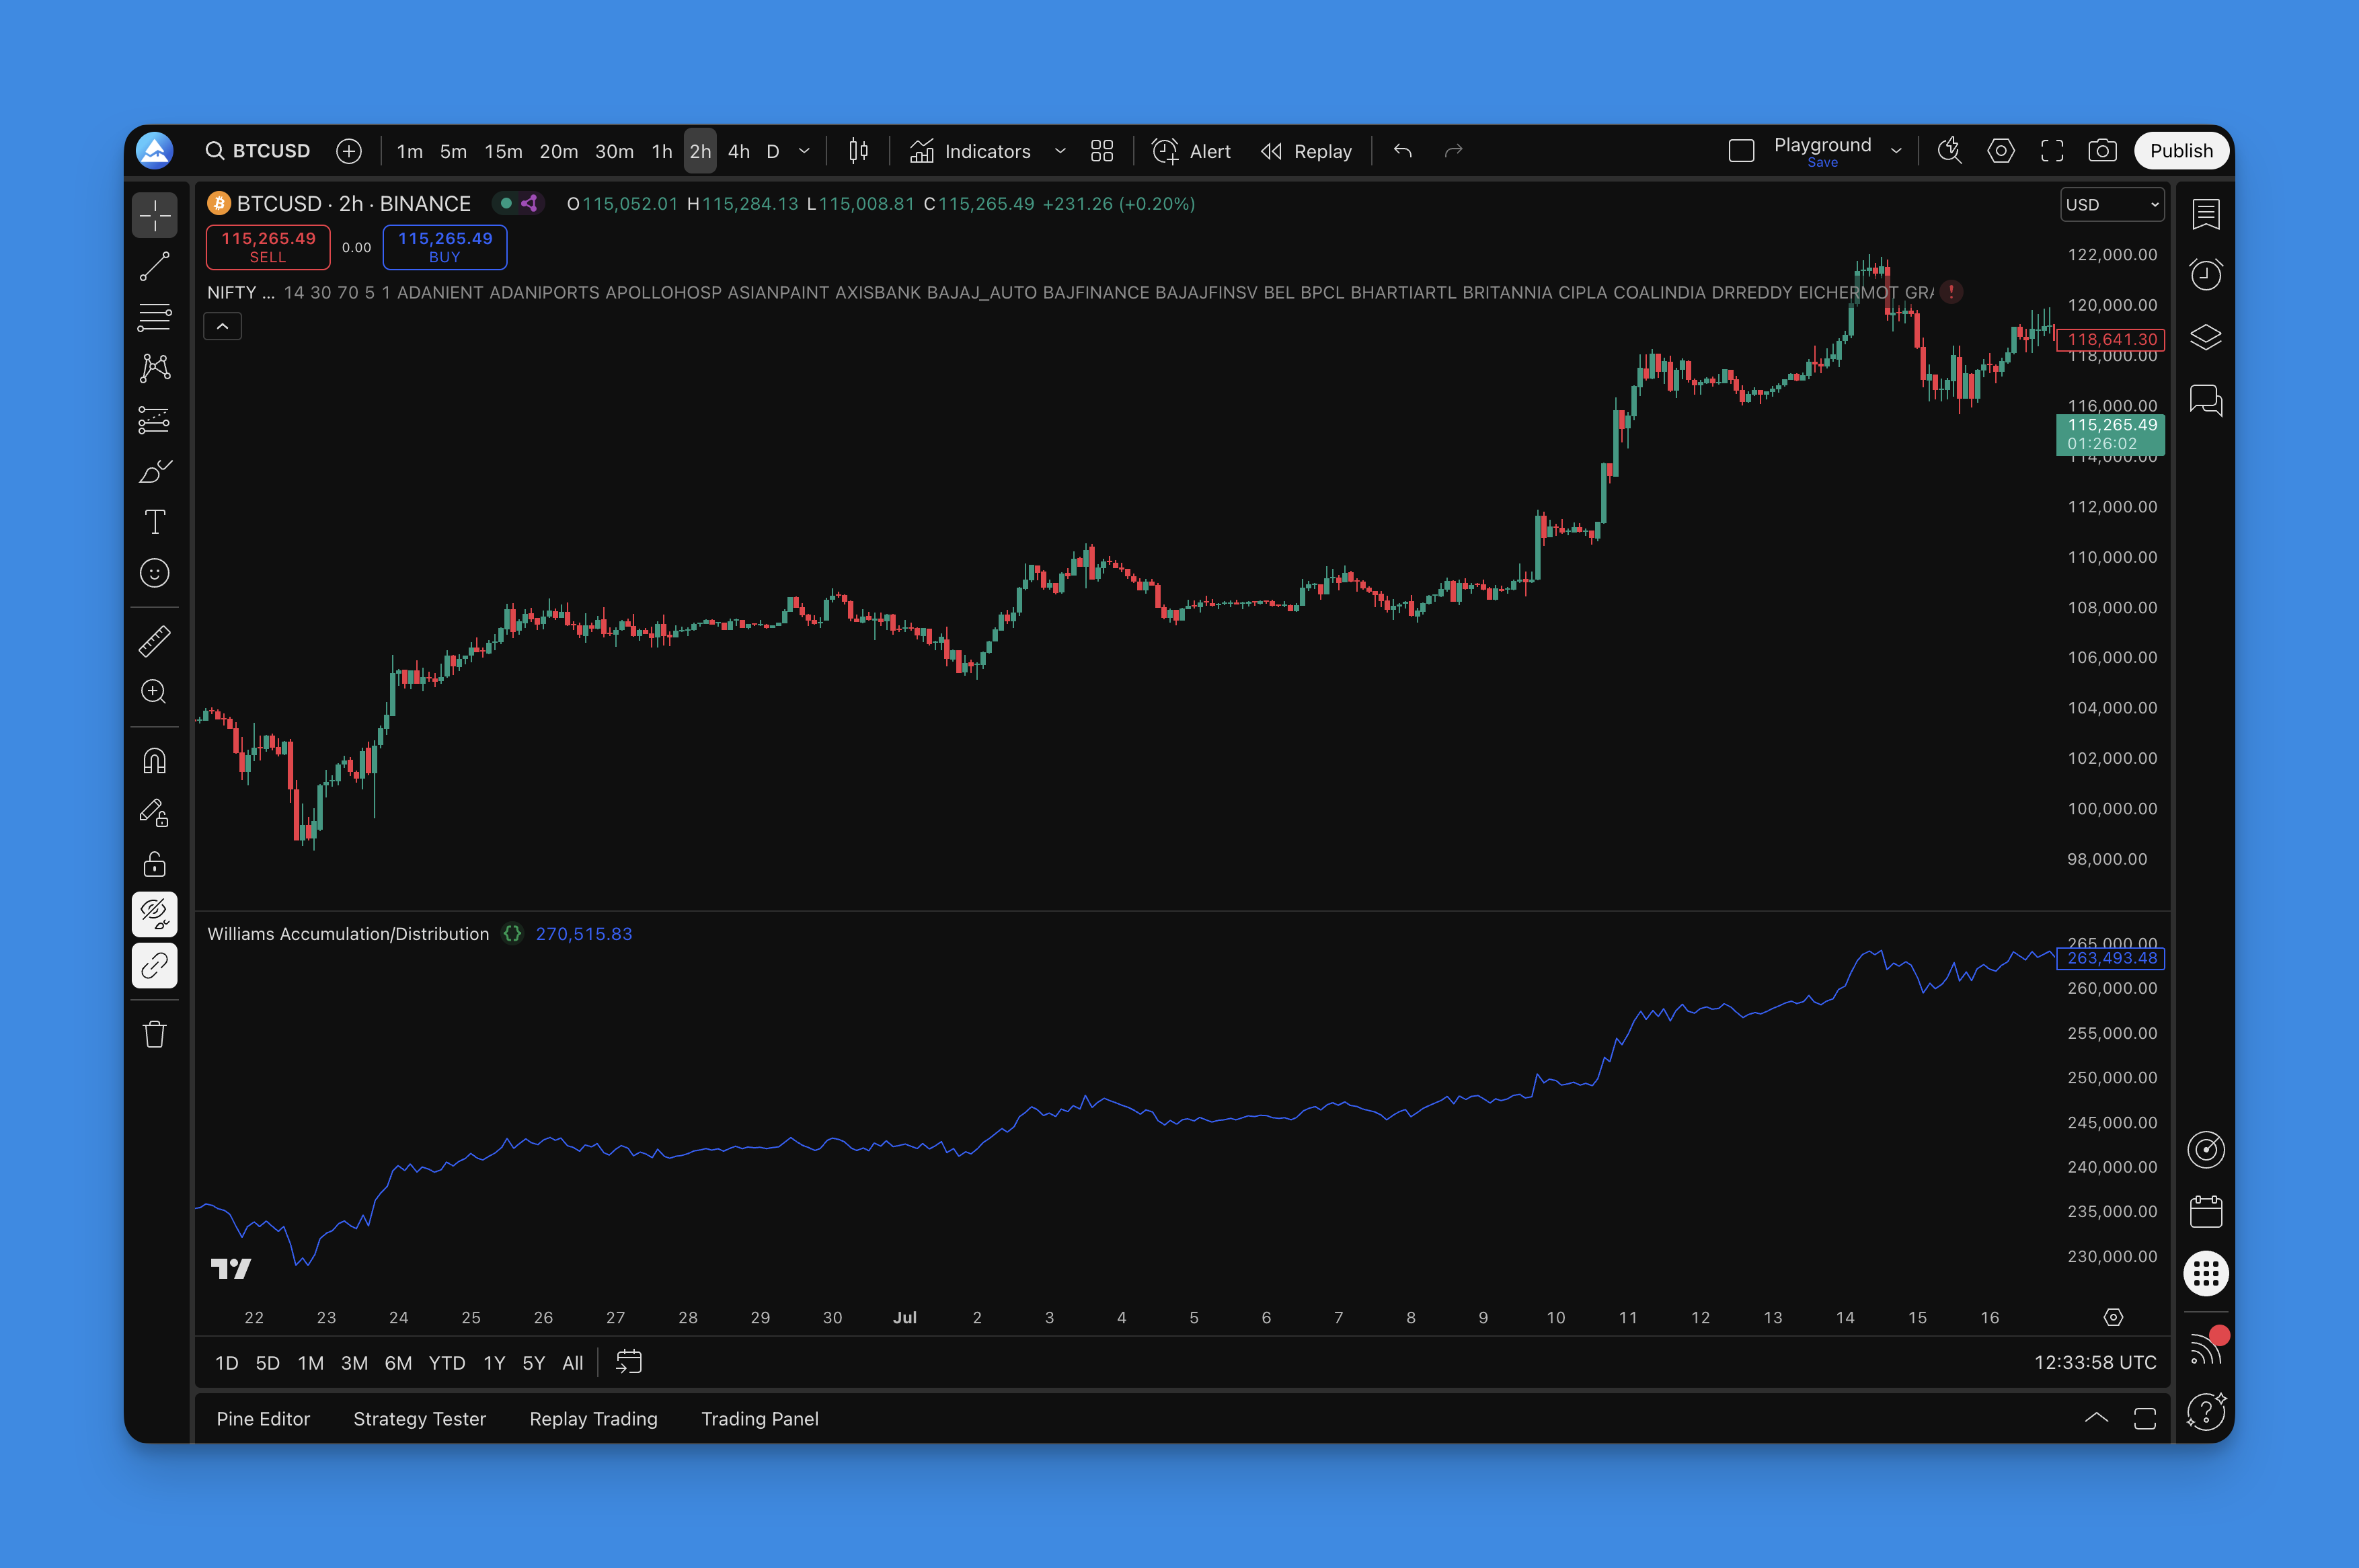
Williams Accumulation Distribution Indicator for TradingView
The Williams Accumulation Distribution (WAD) indicator is a price-action-based tool that reveals institutional buying and selling pressure without requiring volume data. Here's something most traders don't realize: you can spot smart money accumulation just by how price closes relative to its true range.
Created by Larry Williams—the same trader who turned $10,000 into over $1 million in the World Cup Trading Championship—WAD strips away noise and focuses on one question: are professionals accumulating or distributing?
Unlike volume-dependent indicators that fail in forex and crypto, WAD works everywhere. Bitcoin at 3 AM or blue-chip stocks during market hours—price tells the real story, and WAD knows how to listen.
How the WAD Formula Works (It's Simpler Than You Think)
Here's what I love about WAD. Larry Williams designed it to be bulletproof simple. No fancy math, no confusing parameters. Just pure logic.
The calculation breaks down like this:
- True Range High (TRH): The higher value between today's high or yesterday's close
- True Range Low (TRL): The lower value between today's low or yesterday's close
- When Price Closes Higher: Add (Close - TRL) to the running WAD total
- When Price Closes Lower: Subtract (TRH - Close) from the running WAD total
- When Price Closes Unchanged: WAD stays the same
Think of it as a running scorecard. Each day the market either adds points for accumulation or subtracts for distribution. Over time a clear picture of smart money activity emerges.
What makes this approach brilliant is it sidesteps volume data problems entirely. No worries about thin after-hours volume, no concerns about algorithmic trade spikes. Just pure price action.
I remember watching AAPL in October 2024. Price kept dropping to new lows, but WAD was already climbing. That bullish divergence caught a 12% rally in three weeks. Without WAD I'd have been selling into accumulation just like everyone else.
Getting WAD on Your TradingView Charts
Getting WAD on your charts shouldn't take longer than your morning coffee. You've got two routes, and one is way easier.
The Smart Way: Using Pineify
- Open the Pineify editor and search for "Williams Accumulation Distribution"
- Adjust the display settings to match your preferences (colors, line thickness, alert levels)
- Hit generate and clean Pine Script code appears
- Copy the code and paste it into TradingView's Pine Editor
- Apply to your chart

The Hard Way: Coding from Scratch You could spend hours learning how to write Pine Script and building WAD manually. But unless you're planning to become a Pine Script developer, why make life harder?
With Pineify you get professional-grade code that's been tested. No syntax errors, no debugging headaches. Just working code you can customize and deploy in minutes.

How to Read WAD Signals Without Getting Faked Out
Here's where most traders mess up with WAD—they try to trade every little wiggle instead of waiting for signals that actually matter. After watching countless traders chase noise, let me show you what to look for.
Divergence Signals
Bullish Divergence (The "Smart Money" Signal) Price keeps dropping, making new lows, but WAD starts climbing. This is institutional money quietly accumulating while retail traders panic-sell. It's like watching Warren Buffett buy while everyone else runs for the exits.
I've seen this pattern on BTC/USD during the March 2020 crash. WAD showed accumulation at $4,000 while the crowd was panic-selling. Three months later Bitcoin was at $10,000. The divergence told you before the price did.
Bearish Divergence (The "Distribution" Warning) Price hits new highs, everyone's celebrating, but WAD is declining. That's distribution. Smart money takes profits while retail buys the top.
This signal saved me from a bad TSLA trade in December 2023. Bearish divergence formed at $260, and price dropped to $215 within two weeks. I should have trusted the signal even more aggressively.
Trend Confirmation
Healthy Trends: Both price and WAD moving in the same direction. These moves have real conviction and are worth riding.
Weak Rallies: Price climbs but WAD stays flat or drops. These rallies are built on hope, not conviction. They rarely last.
Confirmed Breakdowns: Both price and WAD declining together. The trend is real. Don't try to catch falling knives.
Pro tip: Combine WAD with other momentum tools like RSI Candles or the Madrid Moving Average Ribbon for stronger confirmation signals.

WAD Settings That Work (Skip the Endless Tweaking)
Here's what I learned after years of messing with WAD settings: Larry Williams got it right the first time. The indicator works best when you stop overthinking it.
Timeframe Recommendations
| Timeframe | Signal Quality | Best For |
|---|---|---|
| Weekly | Excellent | Position traders willing to wait |
| Daily | Best overall | Most traders, cleanest signals |
| 4-hour | Good (more noise) | Active traders who need more setups |
| Below 4-hour | Poor | Not recommended |
Daily charts are the sweet spot. You'll catch moves that matter while avoiding fake-outs that destroy accounts. Weekly signals are rarer but incredibly valuable for position trading.
Skip everything below 4-hour. I've tested WAD on 1-hour and 15-minute charts for ES futures. The noise-to-signal ratio is terrible. I haven't found a reliable way to make lower timeframes work with WAD.
Visual Setup
Line Color: Bright blue or orange. You want to spot divergences at a glance, not play "Where's Waldo" with your indicator. I prefer a 3-pixel blue line.
Zero Line: Always display it. It's your reference point for understanding long-term accumulation versus distribution.
Advanced Tips
Smoothing Trick: Add a 5-period moving average to your WAD line if you're getting whipsawed. It filters noise while keeping important signals.
Multi-Timeframe Confirmation: Check WAD on your trading timeframe AND one higher timeframe. When both agree, confidence goes way up. I like checking daily WAD before taking signals on a 4-hour chart.
For more advanced Pine Script techniques, consider combining WAD with other momentum indicators.
Testing Your WAD Strategy
Here's the truth: most traders skip backtesting and wonder why they blow up their accounts. Don't be that trader.
Step 1: Pick Your Testing Period
Minimum 2 years of data. You need to see how WAD handles trending markets, choppy sideways action, and everything in between.
Include a crisis. Test through 2008-2009 or 2020. If WAD can't handle extreme volatility, you need to know now, not when your account is bleeding.
Step 2: Define Clear Rules
Entry Signals:
- Bullish divergence + price breaks above recent resistance
- Bearish divergence + price breaks below recent support
- No "maybe" trades—either the setup is there or it isn't
Exit Strategy:
- Target: 2:1 risk-reward minimum
- Stop loss: Recent swing high/low
- Time stop: Exit if divergence fails within 5-10 bars
Position Sizing: 1-2% risk per trade. Period.
Step 3: Track What Matters
Win Rate: 40-60% is realistic. If you're hitting 80%+ in backtesting, you're probably curve-fitting.
Risk-Reward Ratio: Average winner should be 1.5x your average loser, minimum.
Maximum Drawdown: If you can't handle a 20% drawdown psychologically, reduce position size.
Profit Factor: Total profits divided by total losses. Above 1.3 is solid, above 2.0 is excellent.
Step 4: Paper Trade
Backtesting is theory. Paper trading is practice. Do at least 30 paper trades before risking real money. You need to feel the emotional pressure of watching trades move against you.
Backtesting Traps
Curve Fitting: Stop optimizing until your results look perfect. That's not trading—that's self-deception.
Ignoring Slippage: Add 0.1% slippage minimum. Real markets aren't as clean as your backtest.
Cherry-Picking Periods: Test the ugly periods too. If WAD only works in trending markets, you need to know that.
Forgetting Commissions: Include realistic trading costs. They add up.
For more backtesting strategies, check out our guide to building solid trading systems.
The WAD indicator is available on TradingView right now. With Pineify, you can have it running on your charts in minutes instead of spending hours coding it yourself.
Frequently Asked Questions
▶What is the Williams Accumulation Distribution (WAD) indicator?
The Williams Accumulation Distribution (WAD) indicator is a momentum-based tool created by Larry Williams. Unlike traditional accumulation/distribution indicators, WAD uses only price action—no volume data—to measure whether smart money is accumulating or distributing a security. It calculates a running total based on how the closing price compares to the True Range High and True Range Low each session. I'd argue it's one of the most reliable volume-free indicators on TradingView.
▶How is WAD different from the standard Accumulation/Distribution Line?
The main difference: WAD does not use volume at all. The standard Accumulation/Distribution Line multiplies price movement by volume, making it unreliable in markets with inconsistent volume data like forex or crypto. WAD relies purely on price relationships—where the close falls relative to the true range—so it works across all asset classes and timeframes. I prefer WAD for crypto specifically since exchange volume data is notoriously unreliable.
▶How do I add the Williams Accumulation Distribution indicator to TradingView?
You've got two options. The quickest: use Pineify. Search for "Williams Accumulation Distribution" in the editor, customize the display, generate the Pine Script code, and paste it into TradingView's Pine Editor. The alternative: manually code it in Pine Script using the True Range High/Low formula. Using Pineify eliminates coding errors and saves setup time. I've gone both routes and Pineify is significantly faster.
▶What does a WAD divergence signal mean in trading?
A WAD divergence happens when price and the WAD line move in opposite directions. Bullish divergence—price making lower lows while WAD makes higher lows—signals smart money is quietly accumulating even as retail sells. Bearish divergence—price making higher highs while WAD declines—warns that institutions are distributing into strength. Divergences are WAD's most powerful signal but work best when confirmed with a price action breakout or breakdown. I don't trade divergences without price confirmation.
▶What are the best timeframes to use the Williams Accumulation Distribution indicator?
Daily charts are the sweet spot. They provide clean, low-noise signals that reflect genuine accumulation or distribution cycles. The 4-hour chart works if you need more frequent setups, though false signals increase. Weekly charts offer the highest-quality signals for position traders willing to wait. I skip everything below 4-hour—the noise isn't worth it.
▶Can I use Williams Accumulation Distribution in forex and crypto markets?
Yes. WAD's volume-free design makes it one of the few accumulation/distribution indicators that works reliably in forex and crypto. Since forex doesn't report centralized volume data and crypto volumes vary wildly across exchanges, volume-dependent indicators can mislead. WAD sidesteps this by measuring only where price closes relative to its true range. I've used it on BTC, ETH, and EUR/USD with consistent results.
▶What Pine Script settings should I use for the WAD indicator on TradingView?
Larry Williams designed WAD without input parameters—there's no period length to set. The main customizations are visual: a bright line color (blue or orange) at 2-3 pixels thickness, and display the zero line as reference. If you get choppy signals, add a 5-period SMA overlay on the WAD line to smooth noise. Multi-timeframe confirmation further improves reliability. I haven't tested WAD on tick data or ultra-low-liquidity markets, so I can't vouch for those scenarios.