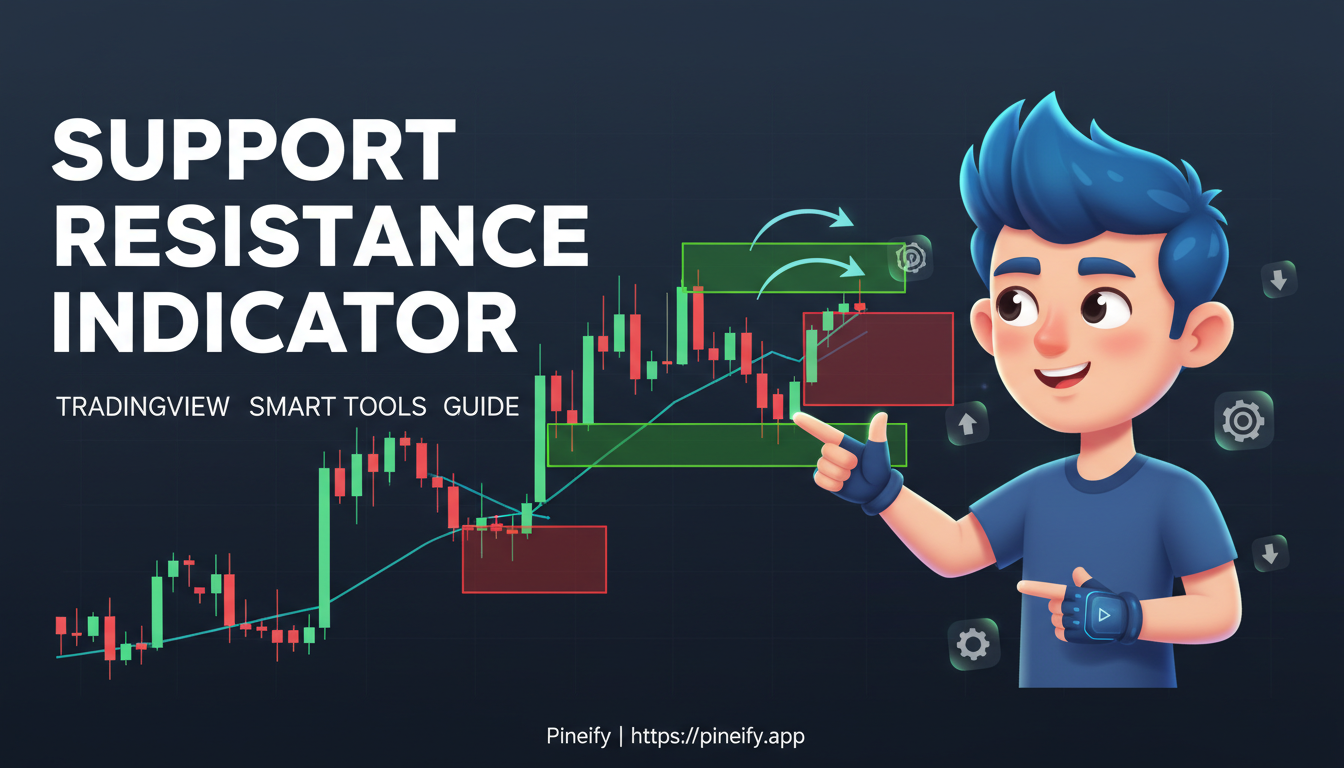
Best Support and Resistance Indicators for TradingView
Support and resistance levels are price zones where a market has historically reversed or stalled. They're not magic—just areas where enough buyers or sellers stepped in before. On TradingView, automatic indicators can surface these zones in seconds. I've tested dozens of S/R tools across AAPL, BTCUSD, and EURUSD, and after testing them all, most traders only need two or three.
What Makes a Support or Resistance Level Reliable
Not every line on your chart matters. A level becomes useful when price has touched it multiple times, when volume spiked near it, or when it aligns with another indicator. I've watched AAPL bounce off the $150 zone four times this year. That repetition gives the level weight, not the tool that drew it.
Most S/R indicators on TradingView use one of four methods: pivot detection, horizontal clustering, Fibonacci ratios, or volume weighting. Each has strengths and blind spots.
Pivot Points High Low: The Built-In Standard
TradingView's Pivot Points High Low marks swing highs and lows using a simple rule. You set a length N (default 10). For a bar to be a pivot high, it needs N lower bars on the left and N lower bars on the right. Same logic for pivot lows, reversed.
Formula:
- Pivot High: High[i] > max(High[i-N...i-1]) and High[i] > max(High[i+1...i+N])
- Pivot Low: Low[i] < min(Low[i-N...i-1]) and Low[i] < min(Low[i+1...i+N])
Where N is the length setting.
| Timeframe | Pivot Length | Best For |
|---|---|---|
| 1–5 min | 5–8 | Scalping |
| 15–60 min | 8–12 | Day trading |
| Daily | 10–15 | Swing trading |
| Weekly | 15–20 | Position trading |
I prefer this tool as a starting point because the criteria are transparent. A length of 5 on BTCUSD's 15-minute chart catches short-term reactions but also produces false signals. A length of 20 on SPX's daily chart filters down to levels that hold for weeks.
The limitation: it generates nothing during sideways consolidation. When EURUSD traded in a tight 20-pip range last month, Pivot Points drew almost no useful lines. I had to switch to manual horizontal levels.
Auto Support/Resistance Levels: Set and Forget
This indicator scans price action and draws horizontal lines where price has reversed multiple times. It ships with three modes for different timeframes: scalping, day trading, and swing trading.
What works: it auto-removes old levels as fresh ones form, keeping your chart clean. The color coding—lines switch color when price crosses them—gives an instant read.
The downside: on TSLA during high volatility, it draws too many lines. I dialed the sensitivity from the default down by two notches and got a cleaner chart. Start with the mode labeled for your timeframe and adjust from there.
I haven't tested this on crypto long-term. I can't say how it behaves on Bitcoin's multi-year ranges. For daily equity and forex work, it's dependable.
Fibonacci Retracement: Projecting Where Price Will Go
Fibonacci tools don't just show where price has been—they project where it might go next. You mark a swing high and swing low, and the tool draws horizontal lines at 23.6%, 38.2%, 50%, 61.8%, and 78.6% of that range.
The 61.8% level is the one I watch most. On EURUSD, I've watched price touch 61.8% in an uptrend and reverse upward the same session, three times in two weeks. That's not coincidence—it's self-fulfilling because enough traders watch that level.
The weakness: it's useless in sideways markets. I've stopped using Fibonacci entirely during consolidation. It only earns its place when the trend is clear.
VWAP and Volume Profile: Following the Volume
VWAP (Volume Weighted Average Price) is the average price weighted by volume, recalculated bar by bar. Institutional traders track it. When price holds above VWAP, buyers are in control. Below it, sellers are.
Volume Profile shows traded volume as a horizontal histogram. The tallest bar is the Point of Control (POC)—the price where the most shares changed hands. POC levels frequently act as support or resistance on the next test.
I use Volume Profile on every SPX swing trade. The POC from last week is often this week's reaction level. The catch: it needs liquidity. On a low-volume stock, the histogram is too flat to read. I haven't found Volume Profile useful on micro-cap stocks at all. For a similar dynamic approach, check out the Envelope Indicator, which creates moving S/R bands around price.
Combining Tools for Confluence
I run a three-step check on every new setup:
| Step | Tool | What It Tells Me |
|---|---|---|
| 1 | Pivot Points High Low | Where are the automatic pivot zones? |
| 2 | Volume Profile | Does the zone have real volume confirmation? |
| 3 | Fibonacci Retracement | Where could price go after reacting? |
When all three agree—say a pivot high aligns with the POC from Volume Profile and the 61.8% retracement sits nearby—I treat that zone as high conviction. I don't trade against it without a strong reversal signal.
I cap my S/R tools at three per chart. Beyond that the lines contradict each other and you freeze.
I also pair these levels with the ATR indicator to set stop distances that sit beyond the market noise.
Manual Drawing: When You Know Something the Auto Tools Don't
Auto detection is fast, but it doesn't know what you've been watching for weeks. I still draw a horizontal line on AAPL at $150 because I've seen it react there across multiple timeframes since last year.
Manual lines don't expire. That's good for tracking long-term levels and bad because stale lines pile up. I review my drawn levels every Sunday and delete anything price has clearly broken. If a level is broken with momentum and doesn't retest, it's gone.
For trend lines: connect at least two swing points and wait for a third touch. Two touches is a guess. Three is a signal.
Mistakes I've Made So You Don't Have To
I've been doing this long enough to make all the classic errors.
Indicator overload. I once had seven S/R tools running on one chart. The lines formed a tangled mess and I couldn't make a single clear decision. Now I run max three.
Equal weight to every level. A pivot that formed on quiet Tuesday volume is not the same as one on Fed-day volume. Context matters more than the line.
Stale levels. A support zone from three months ago on TSLA is useless after a stock split or an earnings gap. I review every level weekly.
Wrong timeframe settings. Pivot length 5 on a weekly chart marks almost nothing. Pivot length 20 on a 1-minute chart marks almost everything. Match the settings to your timeframe, not your preferences.
Your Action Plan
Add Pivot Points High Low to TradingView with length 10. Watch a market you trade daily for one week. Note where levels form and how price reacts.
Then add one more tool. Volume Profile if you trade liquid markets like SPX or EURUSD. Fibonacci if you follow clear trends. Don't add both at once or you won't know which one helps.
Paper trade this setup for two weeks. Log every trade: the level used, whether it held, and what the next candle did. You'll see quickly which tool fits you.
The right S/R setup is personal. What works for my daily EURUSD trades won't help someone scalping BTCUSD on a 3-minute chart. Build slowly and cut anything that adds noise without adding signal.
Frequently Asked Questions
What is the most accurate support and resistance indicator on TradingView?
Pivot Points High Low is my default because the math is objective: N bars higher on both sides or it's not a pivot. But accuracy jumps when you pair it with volume. A pivot that lines up with a high-volume node from Volume Profile is much more likely to hold than one that doesn't.
How do I set up automatic support and resistance on TradingView?
Open the Indicators panel, search for "Pivot Points High Low" or "Auto Support Resistance," and click to add. Open settings and adjust sensitivity. Lower number means more levels and more noise. Higher number means fewer, cleaner levels. I start at the default and nudge by one until the chart looks right.
Can I use multiple support and resistance indicators at the same time?
You can, but I'd keep it to two or three. A clean combo: Pivot Points for automatic detection plus Volume Profile for volume confirmation. Avoid stacking two auto-drawing indicators that both draw horizontal lines from different logic. The result is visual noise. If you want dynamic bands, custom plot styles help keep multiple indicators readable.
What is the difference between static and dynamic support and resistance indicators?
Static levels stay at a fixed price—horizontal lines, classic pivot points. Dynamic levels shift with every new bar—VWAP, moving averages. Static works in ranges. Dynamic works in trends. I use VWAP as my dynamic anchor and Pivot Points for static confirmation. Picking the wrong type for the market conditions is one of the fastest ways to lose confidence in your levels.
How often should I update my support and resistance levels?
Auto tools update every bar, so those take care of themselves. For manual lines, I review Sunday night for the week ahead. Day traders should scan daily. The hard rule: if price breaks a level with momentum and doesn't come back, delete the line. Keeping broken levels on your chart is how you talk yourself into bad trades.
Do support and resistance indicators work for all markets?
Yes, because the psychology is universal. Buyers and sellers react to price levels in stocks, forex, crypto, and commodities. Settings need to adjust though. I use shorter pivot lengths for crypto (5–8) because moves are faster, and longer lengths for indexes (10–15) where price action is smoother. Clear chart setups also help—check Pine Script plot styles for making levels more readable.
