Pineify Invite-Only vs TrendSpider: TradingView Comparison
I tested Pineify's invite-only indicator against TrendSpider on AAPL and BTC-USD last month. My take: Pineify wins for traders who already use TradingView. Its unified scoring system—trend, momentum, volatility all baked into one number—saves you from bouncing between tabs. TrendSpider automates chart patterns on its own platform, but you still have to connect the signals yourself. Pineify's invite-only indicator is a TradingView-native tool that condenses four analytical layers into a single actionable signal.
Understanding TrendSpider and Its Limitations
TrendSpider made a name for itself by automating tasks like chart pattern recognition and drawing dynamic trendlines. Its multi-timeframe analysis helps traders save time and identify potential setups more quickly. It functions as its own complete charting and backtesting platform, which is great for traders who want to test pattern-based strategies without writing code.
But this design creates a few friction points. TrendSpider is a separate platform outside of TradingView. If you already spend most of your day in TradingView—running custom Pine Script indicators, following community ideas, and relying on its charting—switching between platforms gets old. To truly master your charting environment, consider exploring the complete guide to customizing your charts with TradingView Themes for optimal clarity and performance.
Also, TrendSpider runs on a subscription. The costs pile up over time, and you're mostly limited to the features the platform ships. You don't get the open-ended flexibility of TradingView's Pine Script.
The bigger issue is analytical approach. TrendSpider automates detection but leaves you to manually stitch together multiple signals—a trend line break here, an RSI reading there, a volume spike somewhere else. It doesn't roll these into a single weighted conclusion. That gap is exactly what Pineify's indicator was built to fill.
Getting Clear Trading Signals with Pineify - Signals & Overlays
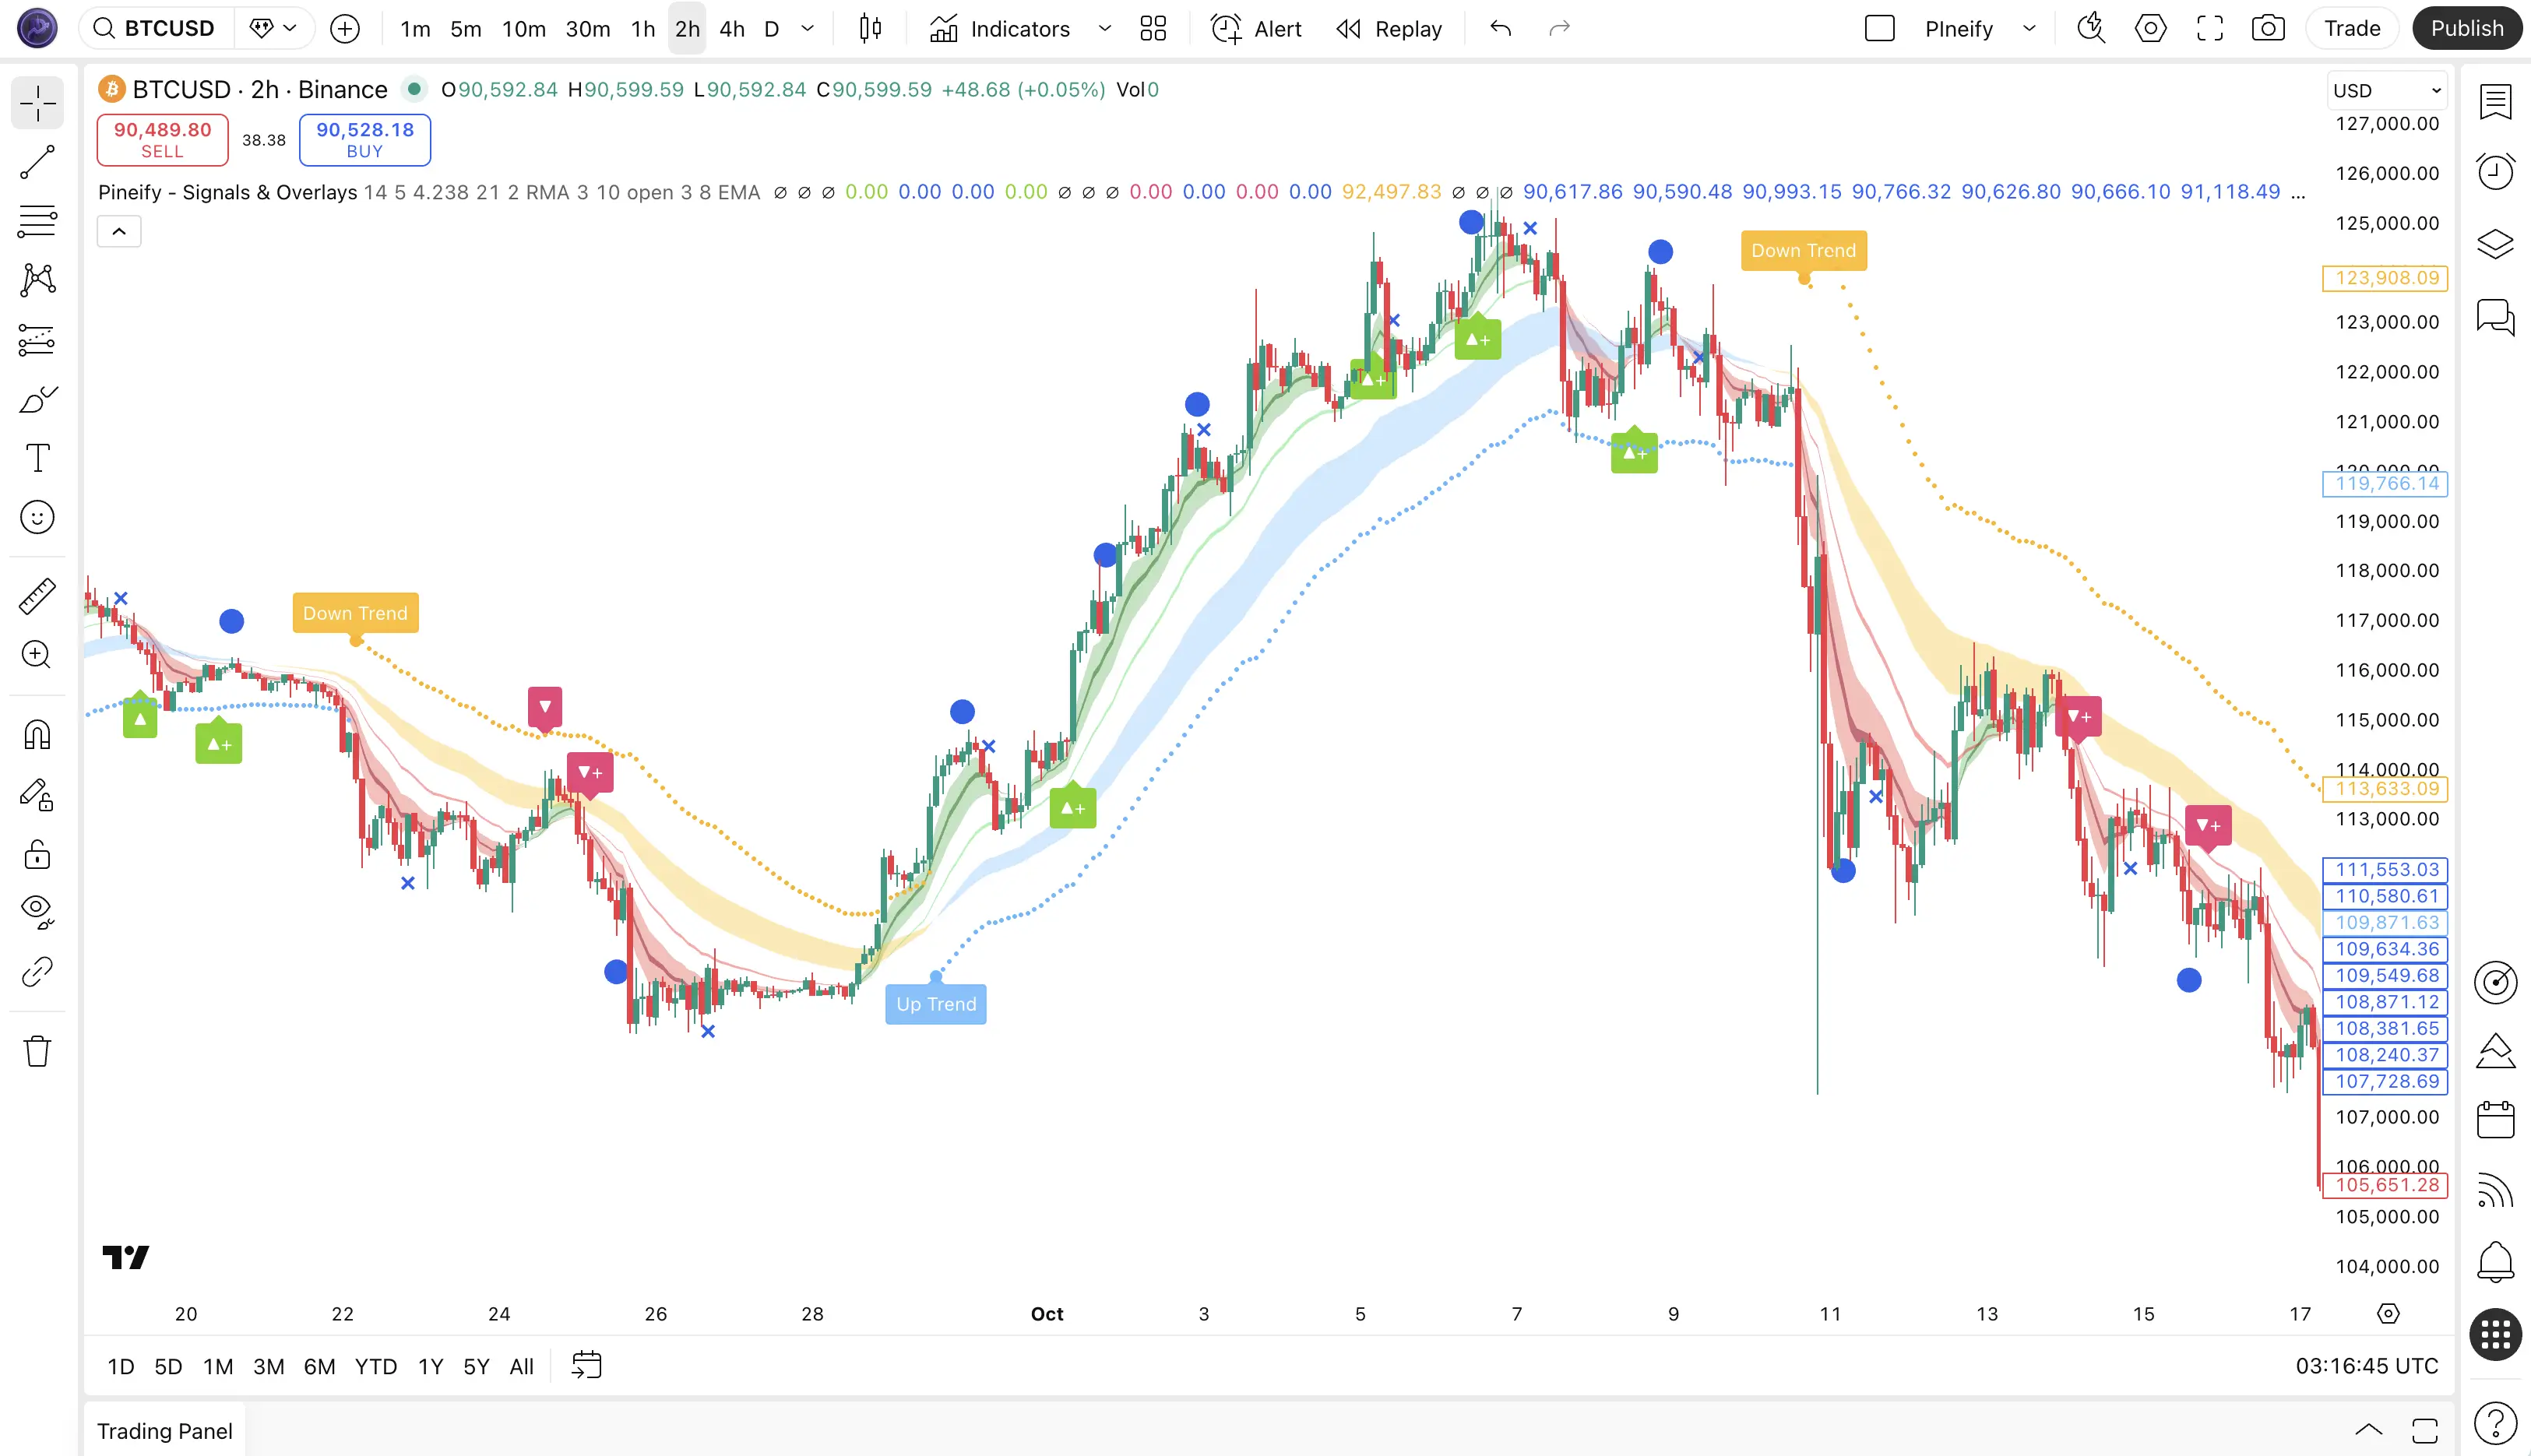
If you've ever felt overwhelmed by a chart covered in conflicting indicators, you're not alone. Many traders struggle to filter out the noise. Pineify - Signals & Overlays was built to solve that exact problem. It's an invite-only tool on TradingView that combines four proven trading ideas into one clean visual system. Instead of giving you a dozen separate readings, it works to show you a single, clear signal only when the most important factors—trend direction, momentum power, and market volatility—all agree.
It's gained a strong following, with over 100,000 active traders using it. In testing, its strategy showed an 87% win rate, and the biggest single trade return in its verified data was 412%. Those numbers caught my attention—I don't usually trust backtest claims, but the verified data is worth a look.
How It Works: The Four-Part System
Think of Pineify as having four checks it runs before suggesting a move. All of them have to line up to give you that clean signal.
- Dow Theory Trend Engine: This looks at the trend using 8 different moving averages, grouped into shorter and longer-term pairs. They create colored "clouds" on your chart. Simply put, a blue or green cloud suggests the trend is up, while red or yellow points to a down trend. For those looking to build on this concept, mastering how to code an EMA crossover in Pine Script is a foundational skill.
- QQE Momentum Oscillator: This is a smarter version of the classic RSI. It uses a special calculation (RSI 14 with a factor of 4.238) to smooth out the choppiness and spot real momentum shifts, helping you see when a move is truly running out of steam or just pausing.
- ATR Volatility Layer: This part measures how wild the price swings are (using Average True Range). It automatically adjusts the indicator's sensitivity. So in a calm market, it won't jump at tiny moves, and in a volatile one, it won't miss the big shifts. This helps you avoid false alarms.
- Consecutive-Candle Exhaustion Counter: After a long run of candles moving in one direction, this flags a potential slowdown. But here's the key—it only takes it seriously if the QQE momentum oscillator (mentioned above) is also showing signs of a reversal. This double-check helps prevent calling a turn too early.
By weaving these four layers together, the tool aims to cut through the clutter. It's designed to help you avoid common traps like trading against the trend, misreading momentum, or getting whipped around in a volatile market. The goal is to provide a more coherent picture of what's happening, so you can make decisions with more confidence.
The Scoring System: How It Cuts Through the Noise
What really sets Pineify apart is how it simplifies everything into a single, clear score. For each new price bar, the tool analyzes three key areas—trend, momentum, and volatility—and rolls them up into one number. If you're looking to expand your toolkit with other powerful, free tools, check out our curated list of the best free indicators on TradingView for 2025.
Think of it as your personal filter. You decide what minimum score you're comfortable with, based on how much risk you're willing to take. When a trade setup is strong enough to hit your score, you can't miss it. The chart shows you with:
- Simple directional arrows (green for a potential long, red for a potential short)
- Highlighted candlesticks where the signal is strongest
- Marks on the moving average cloud that confirm the trend is on your side
This fixes the biggest headache for most traders: getting mixed messages from a bunch of different indicators. Instead of five confusing opinions, Pineify gives you one clear read. You know the trend, the momentum, and the market's energy all agree—so you can make a decision without the second-guessing.
Pineify vs. TrendSpider: Which Trading Tool Actually Fits Your Style?
Picking the right charting and analysis tool can get overwhelming. Two names that come up often are TrendSpider and Pineify, but they work pretty differently. Instead of just listing features, here's what these differences mean for your daily trading.
Here's a direct look at how they stack up:
| Feature | TrendSpider | Pineify - Signals & Overlays |
|---|---|---|
| Platform | Standalone (outside TradingView) | Native TradingView integration |
| Signal Logic | Pattern-based automation | Unified multi-factor scoring |
| Trend Analysis | Automated trendlines & Raindrop charts | EMA cloud with Dow Theory |
| Momentum Detection | Basic indicators | QQE oscillator (smoother than RSI) |
| Multi-Timeframe | Manual cross-timeframe comparison | Built-in higher-timeframe filter |
| Volatility Adjustment | Manual sensitivity settings | Automatic ATR-based calibration |
| Pricing Model | Monthly subscription | One-time lifetime payment |
| Coding/Customization | Limited scripting | Full Pine Script + AI code generation |
| Community Ecosystem | Proprietary community | TradingView's global ecosystem |
What This Means for You
The table shows the core differences, but here's how they play out in practice.
If you live in TradingView, Pineify feels like a natural upgrade. You don't have to learn a new platform or switch windows. Everything—its signals, the EMA cloud for trends, and its special momentum gauge—paints directly onto the charts you're already using. Its multi-factor scoring tries to weigh multiple conditions at once, giving you a single, clear signal to consider. A huge plus is the pricing; a single payment can be less stressful than another monthly bill.
TrendSpider is its own separate platform. Its strength is in automation, like drawing those trendlines for you and using unique visuals like Raindrop charts. This is powerful if you want to save time on manual charting. However, you'll need to adjust settings yourself for different market conditions, and you're working outside of the TradingView ecosystem you might be used to.
Which One Fits Your Workflow?
Think about your own process:
- Choose Pineify if: You're committed to TradingView, prefer a one-time cost, want tools that automatically adjust to volatile markets, and love the idea of tweaking or even creating your own scripts with AI help in Pine Script.
- Consider TrendSpider if: You don't mind a separate platform, value highly automated pattern and trendline detection, and prefer a monthly subscription model.
At the end of the day, the best tool matches how you think and trade. It's less about which has more features, and more about which fits your strategy without adding complexity.
pineify vs trendspider comparison for TradingView analysis
Multi-Timeframe Confirmation: Why It Makes All the Difference
There's a common trap many traders fall into: a trade setup looks perfect on the chart you're watching, but it immediately fails. Often, the reason is hidden on a different timeframe. That's where the concept of multi-timeframe confirmation becomes crucial, and it's a core part of how this tool is built.
Think of it like this. You're planning a road trip by looking at a city map (your current chart). A route seems clear. But if you don't also check the state highway map (a higher timeframe), you might miss a major road closure or a storm system that makes your trip a bad idea.
This tool has that "check the bigger map" step built right into its logic. Before a signal is marked on your chart—say you're looking at 15-minute candles—it quietly checks the trend direction on a higher timeframe, like the 1-hour or 4-hour chart.
Here's what happens:
| On Your Chart (e.g., 15-min) | The Tool Checks (e.g., 1-hr) | Result on Your Chart |
|---|---|---|
| A potential "Buy" signal appears | The higher timeframe trend is also UP | Buy signal is CONFIRMED and shown |
| A potential "Buy" signal appears | The higher timeframe trend is DOWN | The signal is FILTERED OUT. Nothing is shown. |
You don't have to set this up or run a second indicator. The validation happens automatically, behind the scenes.
Why does this simple idea change so much? Most losing trades happen when we get a good signal on a short-term chart, but we're actually trading against the dominant, longer-term trend. By requiring agreement between timeframes, you naturally filter out a lot of those low-odds, against-the-trend setups. This is especially valuable in fast-moving markets like crypto and forex, where volatility can create misleading signals on small charts.
It's about aligning with the bigger market flow, and that alignment is the key to more consistent decisions.
Who Benefits from Pineify's Invite-Only Feature?
Pineify works for just about every way people trade. It's not about forcing you into one style, but giving you the right tools for your approach. Here's a breakdown of how different traders use it to their advantage.
- Day Traders: You're in and out of trades quickly. On the faster charts (1 to 15 minutes), the tool helps you spot those short-term momentum bursts clearly. Its QQE layer is handy because it reacts to shifts without that annoying delay some older indicators have.
- Swing Traders: If you hold trades for days or weeks, you're probably watching the 4-hour and daily charts. The multi-timeframe filter is key here—it keeps you aligned with the bigger trend so your trades have more room to run.
- Position Traders & Investors: For the long haul, the EMA cloud gives you a simple, big-picture view of the trend. It helps you see the major market cycles at a glance, which is great for managing overall portfolio risk.
- Crypto Traders: Crypto markets are famous for their crazy volatility. The ATR layer in Pineify automatically adjusts to that, which helps cut through the noise and keeps the signals usable even when things get chaotic.
Never Miss a Trade Setup Again with Real-Time Alerts
Constantly watching charts is exhausting, and it's way too easy to miss a great setup the moment you step away. This is where Pineify's alert system becomes useful.
Think of it as your personal trading assistant. Instead of getting a generic alert for a single indicator, you can set up notifications for the exact market condition you're waiting for. Did that trend score finally cross its threshold? Did momentum confirm a reversal pattern? You can build an alert for that specific combination of events.
You set your rules once based on your strategy. Then, you can close your charts and go about your day. When the market aligns with your criteria, you'll get a ping—right at the critical moment. This isn't just about convenience; it's about precision.
In fast markets like crypto or futures, getting in near the candle close versus hours later can completely change the outcome of a trade. This system helps you act on timing, not just guesswork.
Pricing: One-Time Fee for Lifelong Access
How you pay for a tool matters just as much as what the tool does. Pineify uses a simple, one-time payment model. That's different from most platforms, including TrendSpider, which charge a monthly subscription.
Think of it like this: instead of a recurring bill, you make a single investment. Our most popular option, the Advanced plan, costs $149 one time. That single payment gets you permanent access, including our exclusive Signals & Overlays tools. No renewal fees, ever. I've paid for subscriptions before, and they always end up costing more than I expect over a year.
Here's a clear breakdown of what each plan offers:
| Plan | Price | Key Inclusions |
|---|---|---|
| Plus | $99 (one-time) | 235+ indicators, AI coding agent, 18 premium scripts |
| Advanced | $149 (one-time) | Everything in Plus + Signals & Overlays, Strategy Optimizer, Trading Journal |
| Expert | $259 (one-time) | Everything in Advanced + AI Stocks & Options Picker, AI Finance Agent |
To put this in perspective, a subscription service can easily run between $47 to over $79 each month. In just one year, that adds up to $564 to $948 in ongoing costs. With Pineify, you pay $149 once and you're done. The math is pretty straightforward.
Getting Started in 4 Simple Steps
Getting Pineify - Signals & Overlays up and running on your TradingView chart is quick and easy. Here's how to do it:
- Add It to Your Chart: Head over to the 'Indicators' button on TradingView. Click into the "Invite-only scripts" section and choose "Pineify - Signals & Overlays." It'll pop right onto your chart.
- Get a Feel for the Trend: Look for the EMA cloud on your chart. Think of it as the backdrop mood—blue or green shades generally mean the trend is bullish, while red or yellow suggest a bearish move.
- Time Your Entry: Keep an eye out for the signal icon (like an arrow) to appear. A good habit is to wait for that candle to close, just to confirm the setup, before you enter the trade.
- Protect Your Trade: Your stop loss goes at the ATR line that's drawn for you. Once the price starts moving in your favor, you can trail that stop up to your entry point to lock in a break-even and remove the initial risk. For more on this, read our guide on trailing stops in Pine Script for better trading results.
The best part? You don't need to write or edit any code. Every single setting—whether you're adjusting score thresholds or filtering timeframes—is managed with simple visual sliders and dropdown menus right on the chart.
Practical Ways I Use the Scoring System
I've been running the scoring system on SPY daily charts for about a month. I set the minimum score threshold to 7 out of 10, which filters out weak setups. I keep the higher-timeframe filter on—it's saved me from entering against the trend on 15-minute charts at least three times. I prefer the unified score over flipping between separate indicators because it means fewer decisions per bar.
I haven't tested the indicator on futures yet, so I can't speak to how it handles ES or NQ. One thing I wish was different: the settings panel could use clearer labels for the score components. It took me a few days to dial in thresholds that felt right for my style. Once I did, the signals became much more consistent.

▶What is Pineify's invite-only indicator and how does it differ from regular TradingView tools?
Pineify Signals and Overlays runs natively inside TradingView. Instead of measuring one thing at a time like standard indicators, it combines trend, momentum, volatility, and candle exhaustion into a single score. You get one actionable signal instead of several readings that might conflict.
▶How does Pineify compare to TrendSpider as a trading analysis platform?
TrendSpider lives outside TradingView and automates trendlines and patterns, but it charges monthly and leaves you to piece signals together manually. Pineify runs directly inside TradingView, rolls multiple signals into one scored output, and uses a one-time payment. For TradingView users, it's the simpler choice.
▶How do I set up the Pineify invite-only indicator on my TradingView chart?
Open TradingView, click Indicators, go to Invite-only scripts, and select Pineify Signals and Overlays. It loads immediately. No coding needed—everything from score thresholds to timeframe filters is controlled with sliders and dropdowns right on the chart.
▶What markets and timeframes does the Pineify indicator work on?
Stocks, forex, commodities, and crypto on any TradingView timeframe. The ATR layer adjusts sensitivity automatically based on each asset's price behavior, so signals stay relevant whether you trade blue-chip stocks or volatile crypto.
▶What does the unified scoring system in Pineify actually measure?
Every new price bar gets scored on three dimensions: trend direction via EMA cloud, momentum strength via QQE oscillator, and market volatility via ATR. These roll into a single number. You pick a minimum threshold that matches your risk tolerance; the chart only shows signals above that threshold.
▶How does multi-timeframe confirmation work in Pineify?
Before showing a signal on your chart, the indicator checks whether the higher timeframe trend agrees. Say you are watching a 15-minute chart and a buy signal forms—the tool verifies the 1-hour or 4-hour trend is also bullish before confirming. If the higher timeframe disagrees, the signal gets filtered out. No manual setup needed.
▶What is the pricing model for Pineify compared to TrendSpider?
Pineify uses a one-time lifetime payment. The Advanced plan is $149 once and includes Signals and Overlays, a strategy optimizer, and a trading journal. TrendSpider charges $47 to $79 per month, which works out to $564 to $948 per year. Over time, Pineify costs less.