BBWP Indicator: Rank Volatility with Bollinger Band Width Percentile
Quiet markets can be harder to trade than fast markets. Price moves sideways, spreads tighten, and every small breakout looks tempting. That's where the BBWP indicator earns its place. I've been running it on SPY and BTC since December 2024, and it consistently shows whether current volatility is truly compressed or just normal for that market.
BBWP stands for Bollinger Band Width Percentile. It doesn't tell you whether price should go up or down. BBWP is a volatility indicator that converts Bollinger Band Width into a percentile rank. It tells you how wide the current Bollinger Bands are compared with their own recent history. After testing this percentile system on NVDA, ETH, and ES futures, I treat it as a context tool first and a signal tool second.
What is BBWP?
The indicator ranks current Bollinger Band Width against recent history. A reading near 0 means current band width is very low compared with the recent lookback window. A reading near 100 means current band width is very high compared with that same window.
The supplied Pine Script calculates BBWP in four main steps:
- It creates a moving average basis from the selected source. The default source is close, the basis type is SMA, and the basis length is 7.
- It calculates Bollinger Band Width as
2 * standard deviation / basis. - It compares the current band width against the prior 100 bars.
- It returns the percentage of valid prior values that are less than or equal to the current band width.
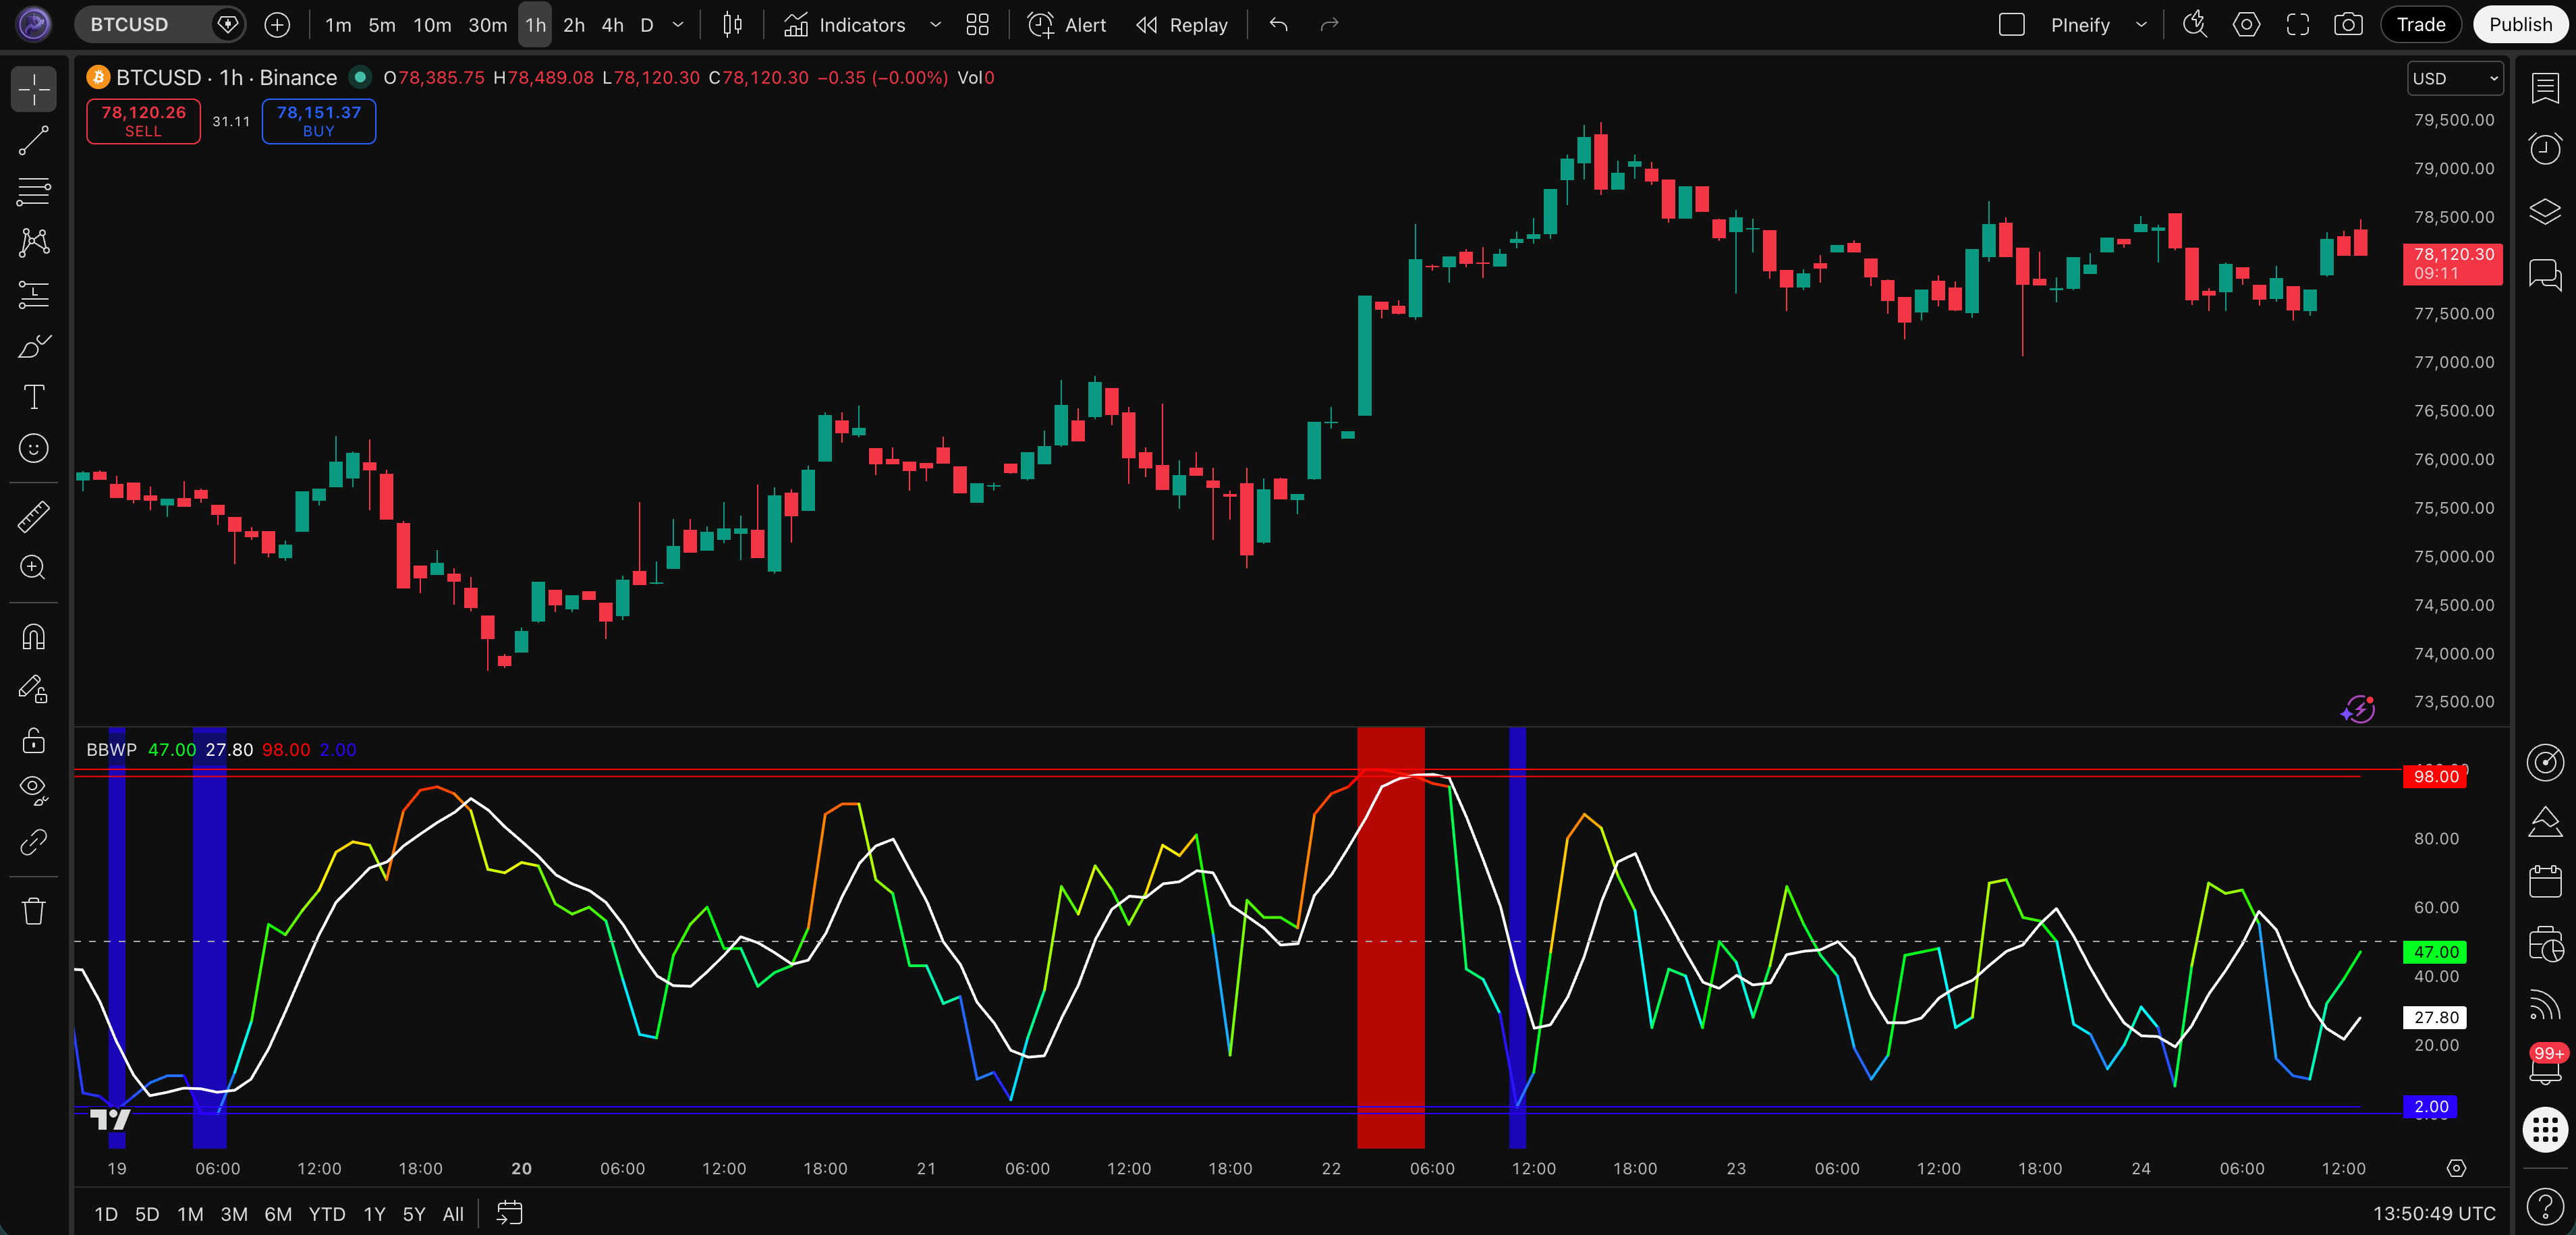
In plain English, BBWP asks: "How wide are the Bollinger Bands right now compared with the last 100 bars?" If the answer is 98, current volatility is wider than almost everything in the recent sample. If the answer is 2, volatility is near the bottom of the recent range.
This makes BBWP different from classic Bollinger Band squeeze tools or a standard volatility line. Bollinger Bands show price, bands, and expansion directly on the chart. BBWP normalizes that expansion into a 0 to 100 scale, so you can compare volatility conditions across symbols and timeframes more easily.
The script also plots a 5-period SMA of BBWP as a signal line. I use that moving average to see whether volatility is rising or fading instead of reacting to every single spike.
How to Add BBWP to TradingView

TradingView has many public BBWP scripts in its community library. To use a built-in or public-library version, open your chart, click Indicators, search for "BBWP" or "Bollinger Band Width Percentile", and add the version that matches your preferred style. Then check the settings carefully, because different authors may use different basis lengths, percentile windows, and alert levels.
Using Pineify takes about 5 minutes when you want a custom version:
- Open Pineify and create a new indicator.
- Search for BBWP or build the logic from Bollinger Band Width, percentile rank, and moving average blocks.
- Set the source to close unless your system has a clear reason to use another source.
- Set the basis moving average to SMA with length 7 to match the supplied script.
- Set the lookback window to 100 bars.
- Add a 5-period SMA signal line.
- Generate the Pine Script and paste it into the TradingView Pine Editor.
The supplied script uses these visual cues:
| Element | Default behavior | How I read it |
|---|---|---|
| BBWP line | 0 to 100 percentile | Current volatility rank |
| Signal line | 5-period SMA of BBWP | Direction of volatility pressure |
| Midline | 50 | Normal volatility zone |
| Low alert | 2 | Deep volatility compression |
| High alert | 98 | Extreme volatility expansion |
Those 2 and 98 levels are strict. They are useful for alerts, but I don't treat them as frequent trading signals. Most practical setups start forming before BBWP reaches those extremes.
How to Use BBWP
BBWP works best when you use it to define market state. It tells you whether price is quiet, expanding, or overheated. Then price action, trend filters, or momentum indicators help decide direction.
Strategy #1: Volatility Squeeze Breakout
Setup conditions:
- BBWP falls below 10, or below 5 for a stricter version.
- Price compresses near a clear range, triangle, or flat moving average.
- Volume is normal or slightly declining during the compression.
Entry signal:
- Enter long when price breaks above range resistance and closes above it.
- Enter short when price breaks below range support and closes below it.
- Prefer trades where BBWP starts turning up from the low zone.
Stop-loss placement:
- For long trades, place the stop below the compression range low.
- For short trades, place the stop above the compression range high.
Take-profit targets:
- Use the height of the range as the first target.
- Trail the rest with a moving average or structure-based stop while BBWP keeps rising.
I've found this particularly useful on 15-minute to 1-hour charts. The key is patience. A low BBWP reading means pressure is building, but it doesn't say which side wins.
Strategy #2: Trend Continuation After Compression
Setup conditions:
- Price is above a rising 50-period or 200-period moving average for longs.
- Price is below a falling 50-period or 200-period moving average for shorts.
- BBWP drops below 25 during a pullback or sideways pause.
Entry signal:
- In an uptrend, enter when price breaks the pullback high and BBWP turns higher.
- In a downtrend, enter when price breaks the pullback low and BBWP turns higher.
Stop-loss placement:
- Place the stop beyond the pullback swing, not directly on the entry candle.
Take-profit targets:
- Take partial profit near the prior swing extreme.
- Hold the rest only while the trend structure remains intact.
This setup avoids one common BBWP mistake: trading every low-volatility zone as a reversal. In strong trends, low volatility often means the market is resting before continuation.
Strategy #3: Exhaustion Filter at Extreme Expansion
Setup conditions:
- BBWP reaches 90 or higher.
- Price is extended far from a short-term moving average.
- Momentum tools such as RSI or MACD show weakening pressure.
Entry signal:
- Do not fade the move just because BBWP is high.
- Wait for price to break a minor trendline, lose a swing level, or close back inside a prior range.
Stop-loss placement:
- Place the stop beyond the exhaustion high for shorts or below the exhaustion low for longs.
Take-profit targets:
- Use the nearest mean-reversion level, such as VWAP, a 20-period moving average, or the prior breakout area.
High BBWP warns that volatility is stretched. It isn't a reversal signal by itself. In my experience trading NVDA earnings moves, the best setups happen when extreme BBWP lines up with visible price rejection.
Strategy #4: BBWP Signal Line Confirmation
Setup conditions:
- BBWP is below 25 for compression or above 75 for expansion.
- The 5-period BBWP moving average is visible.
- Price is near a tradeable level.
Entry signal:
- For breakout trades, wait for BBWP to cross above its moving average from a low zone.
- For volatility fade trades, wait for BBWP to cross below its moving average from a high zone.
Stop-loss placement:
- Use price structure, not the BBWP line, because BBWP isn't plotted on price.
Take-profit targets:
- Exit part of the trade when BBWP reaches the opposite volatility zone.
- Exit the rest if price structure breaks against the position.
The signal line keeps the method calmer. It helps separate a real volatility shift from one noisy candle.
Best BBWP Settings
The supplied script uses BBWP with close, SMA basis length 7, lookback 100, SMA signal length 5, and alert levels at 2 and 98. That is a fast, practical setup. It reacts sooner than the common 20-period Bollinger Band basis, so it can fit active trading well.
| Trading style | Timeframes | Basis length | Lookback | Signal MA | Alert zones | Why it works | |---|---|---|---:|---:|---:|---|---| | Scalping | 1-5 minute | 7-10 | 50-100 | 3-5 | 5 / 95 | Faster settings catch intraday volatility shifts sooner | | Day trading | 15-60 minute | 7-14 | 100 | 5 | 5-10 / 90-95 | Balances responsiveness with fewer false compression reads | | Swing trading | 4H-Daily | 14-20 | 100-252 | 5-10 | 10 / 90 | Longer basis and lookback fit multi-day volatility cycles | | Position trading | Weekly | 20 | 252 | 10 | 15 / 85 | Slower settings focus on major volatility regimes |
For scalping NVDA or MSTR, I prefer a shorter lookback because old volatility data can make current compression look less important than it is. For swing trading SPY, I prefer a wider lookback because volatility regimes can last for weeks.
The main setting to avoid is an extremely short lookback, such as 20 bars, on noisy markets. It can make BBWP jump between extremes too often. That creates false confidence because the percentile scale still looks clean even when the sample is too small.
I haven't tested BBWP on forex pairs like EURUSD or GBPJPY long enough to recommend specific defaults, so if you trade those, start with the standard settings and adjust from there.
Advanced BBWP Techniques
Multi-timeframe analysis is one of the cleanest ways to use BBWP. Check the higher timeframe first. If daily BBWP is low, the market may be preparing for a larger move. Then use the 1-hour or 15-minute chart to find the actual breakout level.
Combining BBWP with trend tools also improves signal quality. A 200-period moving average can filter direction. RSI can show whether momentum agrees with the breakout. Volume can confirm whether expansion is supported by participation. BBWP gives the volatility context, while the other tools answer direction and quality.
BBWP also pairs well with squeeze-style methods. A low BBWP reading can confirm that a squeeze is real, while a rising BBWP line can show that compression is releasing. If you trade squeeze breakouts, compare BBWP with this squeeze indicator guide to build a more complete process. For additional market context, the ADX trend filter can help confirm whether the breakout aligns with the broader trend direction.
Common pitfalls:
- Trading low BBWP without a breakout level.
- Shorting every high BBWP reading in a strong uptrend.
- Using the same settings across every market without testing.
- Ignoring spreads and liquidity on lower timeframes.
- Treating BBWP as a direction indicator.
No indicator works 100% of the time. BBWP can keep you out of low-quality conditions, but it can't remove the need for stops, position sizing, and a clear invalidation point. A low BBWP means compression, not an automatic trade. A high BBWP means expansion, not an automatic reversal.
How to Backtest BBWP
Backtesting matters because BBWP signals can feel obvious after a move happens. Before using it live, define exact rules and test them across different market types: quiet ranges, trend days, news-driven expansion, and failed breakouts.
In Pineify, you can turn BBWP ideas into a testable TradingView strategy by defining:
- Entry conditions, such as BBWP crossing above its signal line after being below 10.
- Direction filters, such as price above or below a moving average.
- Market orders or limit orders.
- Take profit settings based on range size, ATR, or fixed reward-to-risk.
- Stop loss settings below or above the setup structure.
- Trailing stop logic for breakout trades that continue running.
For example, a simple test could be:
- Only take long trades when price is above the 200-period moving average.
- Wait for BBWP to fall below 10.
- Enter when price breaks the 20-bar high and BBWP crosses above its 5-period SMA.
- Place the stop below the 20-bar low.
- Take partial profit at 1.5R and trail the rest with a 20-period moving average.
Risk per trade should stay small. I usually test with 1% or less per trade first, then compare results at 0.5%, 1%, and 2%. If a strategy only looks good with oversized position risk, the edge is probably weaker than it looks.
FAQs
What is the best BBWP setting for crypto?
For crypto, start with basis length 7 to 14, lookback 100, and a 5-period signal line. Crypto can stay volatile longer than stocks or forex, so I usually watch 5 and 95 zones instead of waiting only for 2 and 98. On very fast charts, test a 50-bar lookback, but don't assume it's better until the backtest proves it.
Does BBWP show buy and sell signals?
Not directly. BBWP shows volatility percentile, not direction. Low readings suggest compression. High readings suggest expansion. A buy or sell decision still needs price structure, trend context, momentum, or volume confirmation.
Is BBWP better than Bollinger Band Width?
BBWP isn't always better. It answers a different question. Bollinger Band Width shows raw band expansion. BBWP ranks that width against recent history. I prefer BBWP when comparing conditions across markets or timeframes, because the 0 to 100 scale is easier to read.
Can I combine BBWP with RSI?
Yes. A practical combination is BBWP for volatility and RSI for momentum. For example, a long setup might require BBWP rising from a low zone, price breaking resistance, and RSI holding above 50. This avoids using RSI overbought or oversold levels in isolation.
Why does BBWP stay high during strong trends?
Strong trends often keep volatility expanded. BBWP can stay high while price keeps moving in the same direction. That's why high BBWP shouldn't be used as an automatic reversal signal. Wait for price rejection or momentum weakness before considering a fade.
What markets work best with BBWP?
BBWP can work on stocks, forex, crypto, futures, and ETFs because it measures volatility relative to each symbol's own recent history. It's most useful on liquid markets where breakouts and ranges are clear. Thin markets can create misleading spikes.
Test BBWP on a demo account first, especially if you plan to trade breakouts. The indicator is useful because it gives clean volatility context, but the trade still depends on execution, risk, and the price level you choose.
