Money Flow Index (MFI): Volume-Weighted Momentum Signals
I missed a TSLA breakout in March 2025 because I was glued to RSI — the price surged, but volume told the real story. That's when I started using the Money Flow Index (MFI). It's a momentum oscillator that weights each price bar by the volume behind it, so you see not just where price went, but whether real money pushed it there.
What is the Money Flow Index (MFI)?
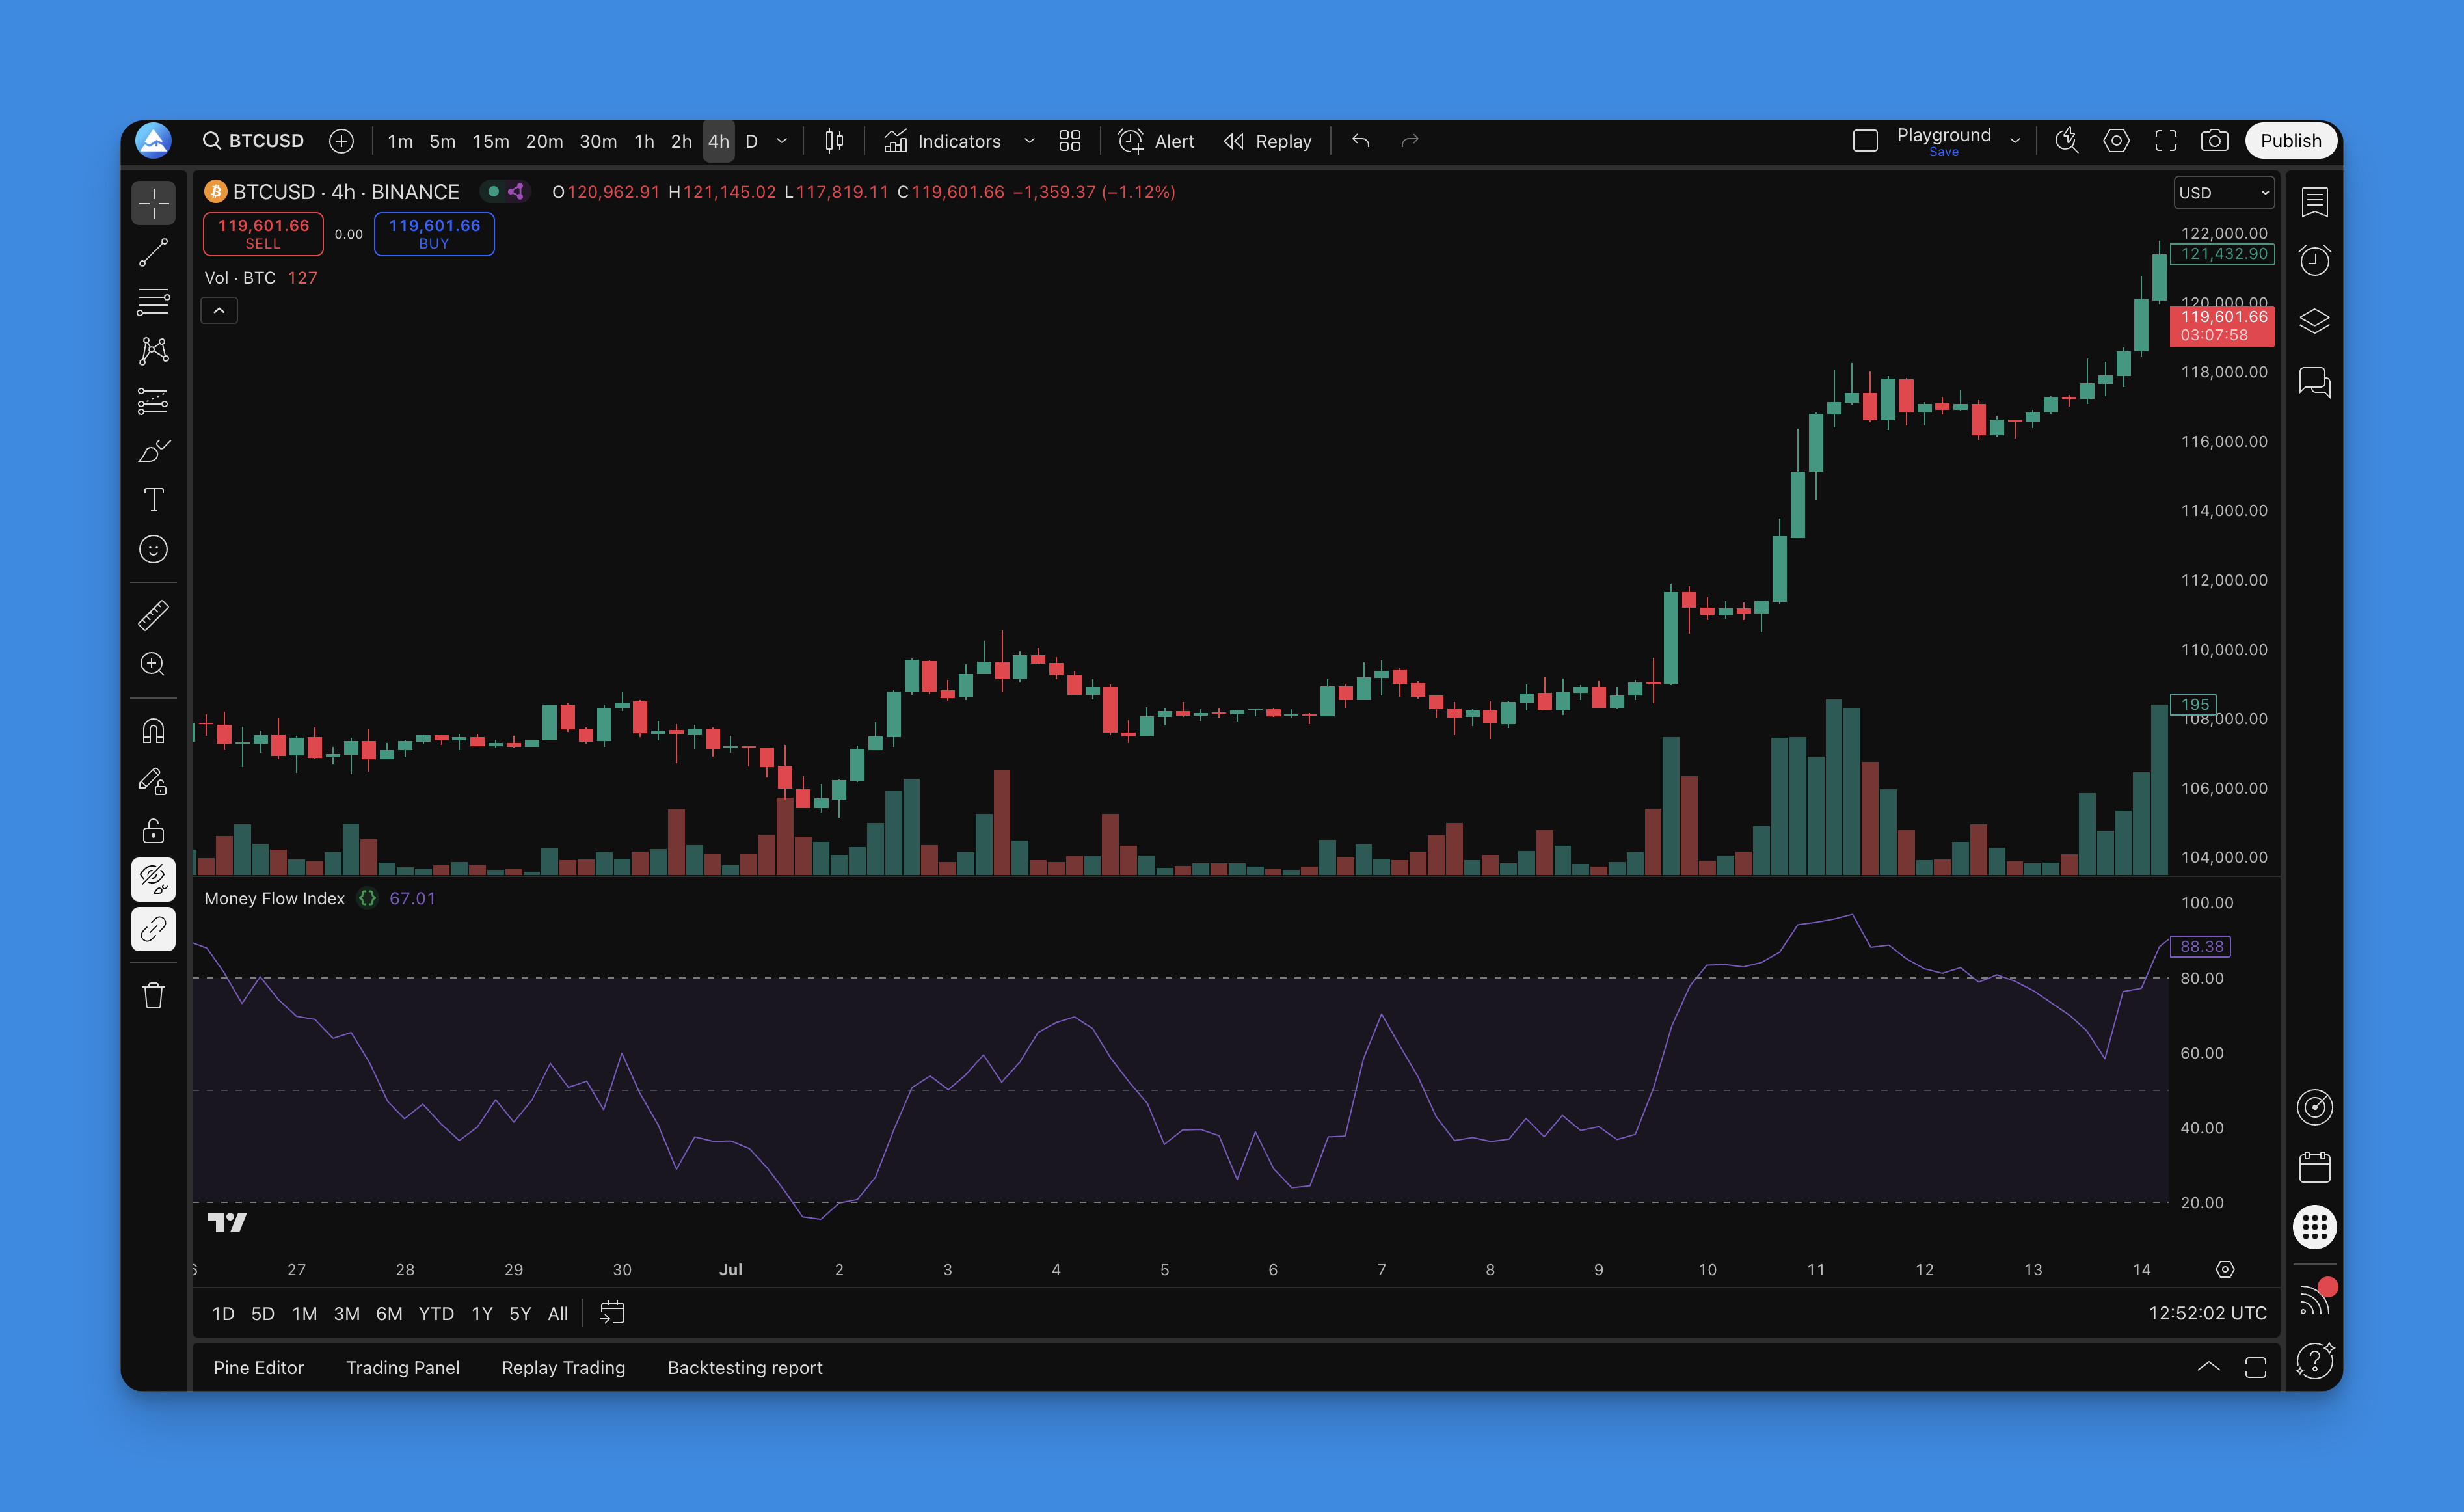
The Money Flow Index (MFI) is a momentum oscillator that tracks buying and selling pressure by combining price and volume data. Often called the volume-weighted RSI, MFI generates values from 0 to 100. Readings above 80 flag overbought conditions; below 20 signals oversold territory.
How It's Calculated
The math is simpler than it looks:
- Typical price = (high + low + close) / 3
- Raw money flow = typical price * volume
- Split raw money flow into positive (today's typical price > yesterday's) and negative
- Money ratio = positive money flow / negative money flow
- MFI = 100 - (100 / (1 + money ratio))
The volume component is the key difference. The RSI only looks at price changes, so a low-volume spike can look like a strong signal. MFI catches that because weak volume means weak money flow. I've found this especially useful on stocks like AAPL and SPY where volume data is reliable.
Adding MFI to TradingView
Using the built-in indicator: Click "Indicators" on your chart, search "Money Flow Index," and add it. Default is 14 periods with 80/20 thresholds.

Using Pineify for a custom build: Head to Pineify.app, create a free account, and find "Money Flow Index" in the library. You can tweak the length, overbought/oversold levels, and colors without writing any Pine Script. Takes about 5 minutes.
MFI Settings by Timeframe
I've tested these across different styles. Here's what I've landed on:
| Trading Style | Timeframe | MFI Length | Thresholds |
|---|---|---|---|
| Scalping | 1-5 min | 7-10 | 85/15 |
| Day Trading | 15-60 min | 14 | 80/20 |
| Swing Trading | 4H-Daily | 14-21 | 80/20 or 90/10 |
| Position Trading | Weekly | 21-28 | 75/25 |
I prefer a 10-period MFI on 5-minute charts for scalping — the standard 14 feels too slow when you're catching quick reversals. On daily charts, 21 periods gives smoother readings and fewer false signals.
Practical Trading Strategies
Strategy 1: The Reversal Setup
- Wait for MFI to hit oversold (<20) or overbought (>80).
- Watch for MFI to turn back while still in the extreme zone.
- Enter when price confirms — a bullish engulfing candle at support, for example.
- Set your stop beyond the recent swing low or high.
The best divergence trade I caught was on AAPL in early 2024. The daily chart showed bullish MFI divergence — price kept dropping but MFI was already climbing. It reversed and ran 12% over two weeks.
Strategy 2: The Divergence Play
- Spot a new price high or low that MFI doesn't confirm.
- Wait for price to show the first sign of reversal — a close below a short-term moving average works.
- Enter in the direction of the potential new trend.
- Keep stops tight. Divergences tend to produce quick moves.
I haven't tested MFI divergence on crypto pairs with thin volume, so I can't vouch for its reliability there. On liquid markets like ES futures or forex pairs, it's been consistent.
Strategy 3: Trend Confirmation
- Identify the primary trend using price action or a moving average.
- On pullbacks, check if MFI stays above 20 in an uptrend (or below 80 in a downtrend).
- Enter when MFI turns back in the trend direction.
- Trail your stop as the trend extends.
This approach works well with multi-timeframe analysis — run MFI on the daily for direction and the 4H for entries.
Advanced Tips
Multi-timeframe filter. Check the daily MFI before taking a signal on the 1-hour chart. If the daily is overbought, I don't take long entries on lower timeframes — the risk of a reversal is too high.
Support and resistance combos. MFI oversold at a key support level is a strong setup. Same for overbought at resistance. I've had good results combining MFI with horizontal levels on SPY.
Exit timing. Even if you don't use MFI for entries, watch it for exits. When MFI hits extreme levels in the direction of your trade, consider taking partial profits. It's not a precise exit signal, but it flags when the move is getting stretched.
Risk Management
- Extreme MFI readings: Tighter stops. Reversals from overbought or oversold can be fast.
- Neutral zone: Wider stops. You don't want to get shaken out by normal noise.
- Divergence trades: These tend to offer good risk/reward — you can use smaller position sizes and wider targets.
MFI has a weakness that doesn't get enough attention: in low-volume environments, the indicator is unreliable. I've seen it flash false signals on thinly traded small caps where volume spikes distort the money flow calculation. Stick to markets with consistent volume.
▶What is the Money Flow Index (MFI) and how does it differ from RSI?
MFI measures buying and selling pressure by pairing price data with volume. RSI only looks at price changes. So if a stock pumps on thin volume, RSI might scream "buy" while MFI stays quiet. The volume filter makes MFI harder to fake.
▶What are the best MFI settings for day trading?
For 15- to 60-minute charts, 14 periods with 80/20 thresholds is the standard and it works. Scalpers on 1- to 5-minute charts should try 7-10 periods with 85/15 — the faster timeframe needs a faster oscillator.
▶How do I use MFI divergence to spot reversals?
You're looking for price and MFI moving in opposite directions. Price makes a higher high but MFI makes a lower high — that's bearish divergence, often followed by a drop. Price hits a lower low while MFI climbs — bullish divergence, potential rally ahead. I wouldn't trade divergence without price confirmation though — a candlestick close or a broken trendline.
▶Is an MFI reading above 80 always a sell signal?
Not at all. In a strong trend, MFI can sit above 80 for days. The real signal is when MFI turns down after being overbought while price is still grinding higher — that divergence is what matters, not the reading by itself.
▶How can I add a custom MFI indicator to TradingView without coding?
Pineify handles it. Pick your MFI length, overbought/oversold levels, and colors — it generates the Pine Script. Paste it into TradingView's editor and you're done. No coding.
▶What markets work best with the Money Flow Index?
Any market with reliable volume — stocks, ETFs, forex majors, crypto with real trading volume. Skip it on thinly traded OTC stocks or illiquid forex pairs. Bad volume data means bad MFI readings.
