ICT Concepts Indicators vs Pineify: TradingView Overlays Compared
ICT Concepts indicators are TradingView overlays that visualize institutional order flow patterns -- Fair Value Gaps, Order Blocks, liquidity zones, and market structure breaks -- based on the Inner Circle Trader methodology. Pineify Signals & Overlays takes the opposite approach: systematic signal generation built on Dow Theory, an EMA cloud, and the QQE oscillator. I've spent months testing both. The verdict is simple: ICT Concepts give you structural market context, while Pineify gives you a repeatable entry and exit system. Pick whichever fits how you naturally read price action.
Understanding ICT Concepts Indicators
The Inner Circle Trader (ICT) methodology tries to decode how large institutions and "smart money" move the market. ICT Concepts indicators turn those ideas into visual tools that automatically spot key patterns on your chart.
Think of them as a swiss army knife for the ICT framework. Here's what they typically help you see:
- Market Context Tools:
- Market Structure Detection: Automatically labels key breaks and shifts in trend (like BOS and MSS) as they happen.
- Killzones Overlay: Shows the most active trading hours for London, New York, and Asian sessions.
- Key Price Level Tools:
- Fair Value Gaps (FVG) & Balance Price Ranges (BPR): Highlights areas on the chart considered a "discount" or "premium," based on institutional models. This FVG indicator guide breaks down the different approaches.
- Liquidity Zones: Marks out areas where stops are likely clustered, which can be targets for price runs.
- Order Blocks (OB): Points out specific candlestick patterns where large institutional orders may have been placed.
- NWOG / NDOG Gaps: Flags the gaps between weekly and daily opening prices, showing you where price has "skipped."
- Confirmation & Targeting Tools:
- Volume Imbalance & Displacement Candles: Highlights bars with unusual volume or strong momentum, suggesting institutional activity.
- Integrated Fibonacci Targets: Automatically draws common Fib retracement and extension levels from recent market swings.
A big thing to know: most ICT indicators are open-source and community-built. You can find many for free in TradingView's public library. The catch is that quality and reliability vary. Some are excellent and well-maintained, while others can be buggy or outdated. I've had scripts repaint on me mid-session, which is frustrating when you're sizing a position based on where it marked a stop run.
Pineify Signals & Overlays Overview
This is an invite-only TradingView tool from the Pineify team. It's a trend-following and reversal-spotting toolkit built around four layers: Dow Theory's view of market trends, a multi-layer EMA cloud, the QQE momentum oscillator, and an ATR-based trailing stop. Instead of trying to infer institutional intent, it scores every single price bar on trend direction, momentum, and volatility. A signal only fires when all three agree.
You can't replicate this by stacking ordinary indicators. I've tried combining RSI, moving averages, and ATR separately -- the timing never lines up the same way.
How the Four Layers Work Together
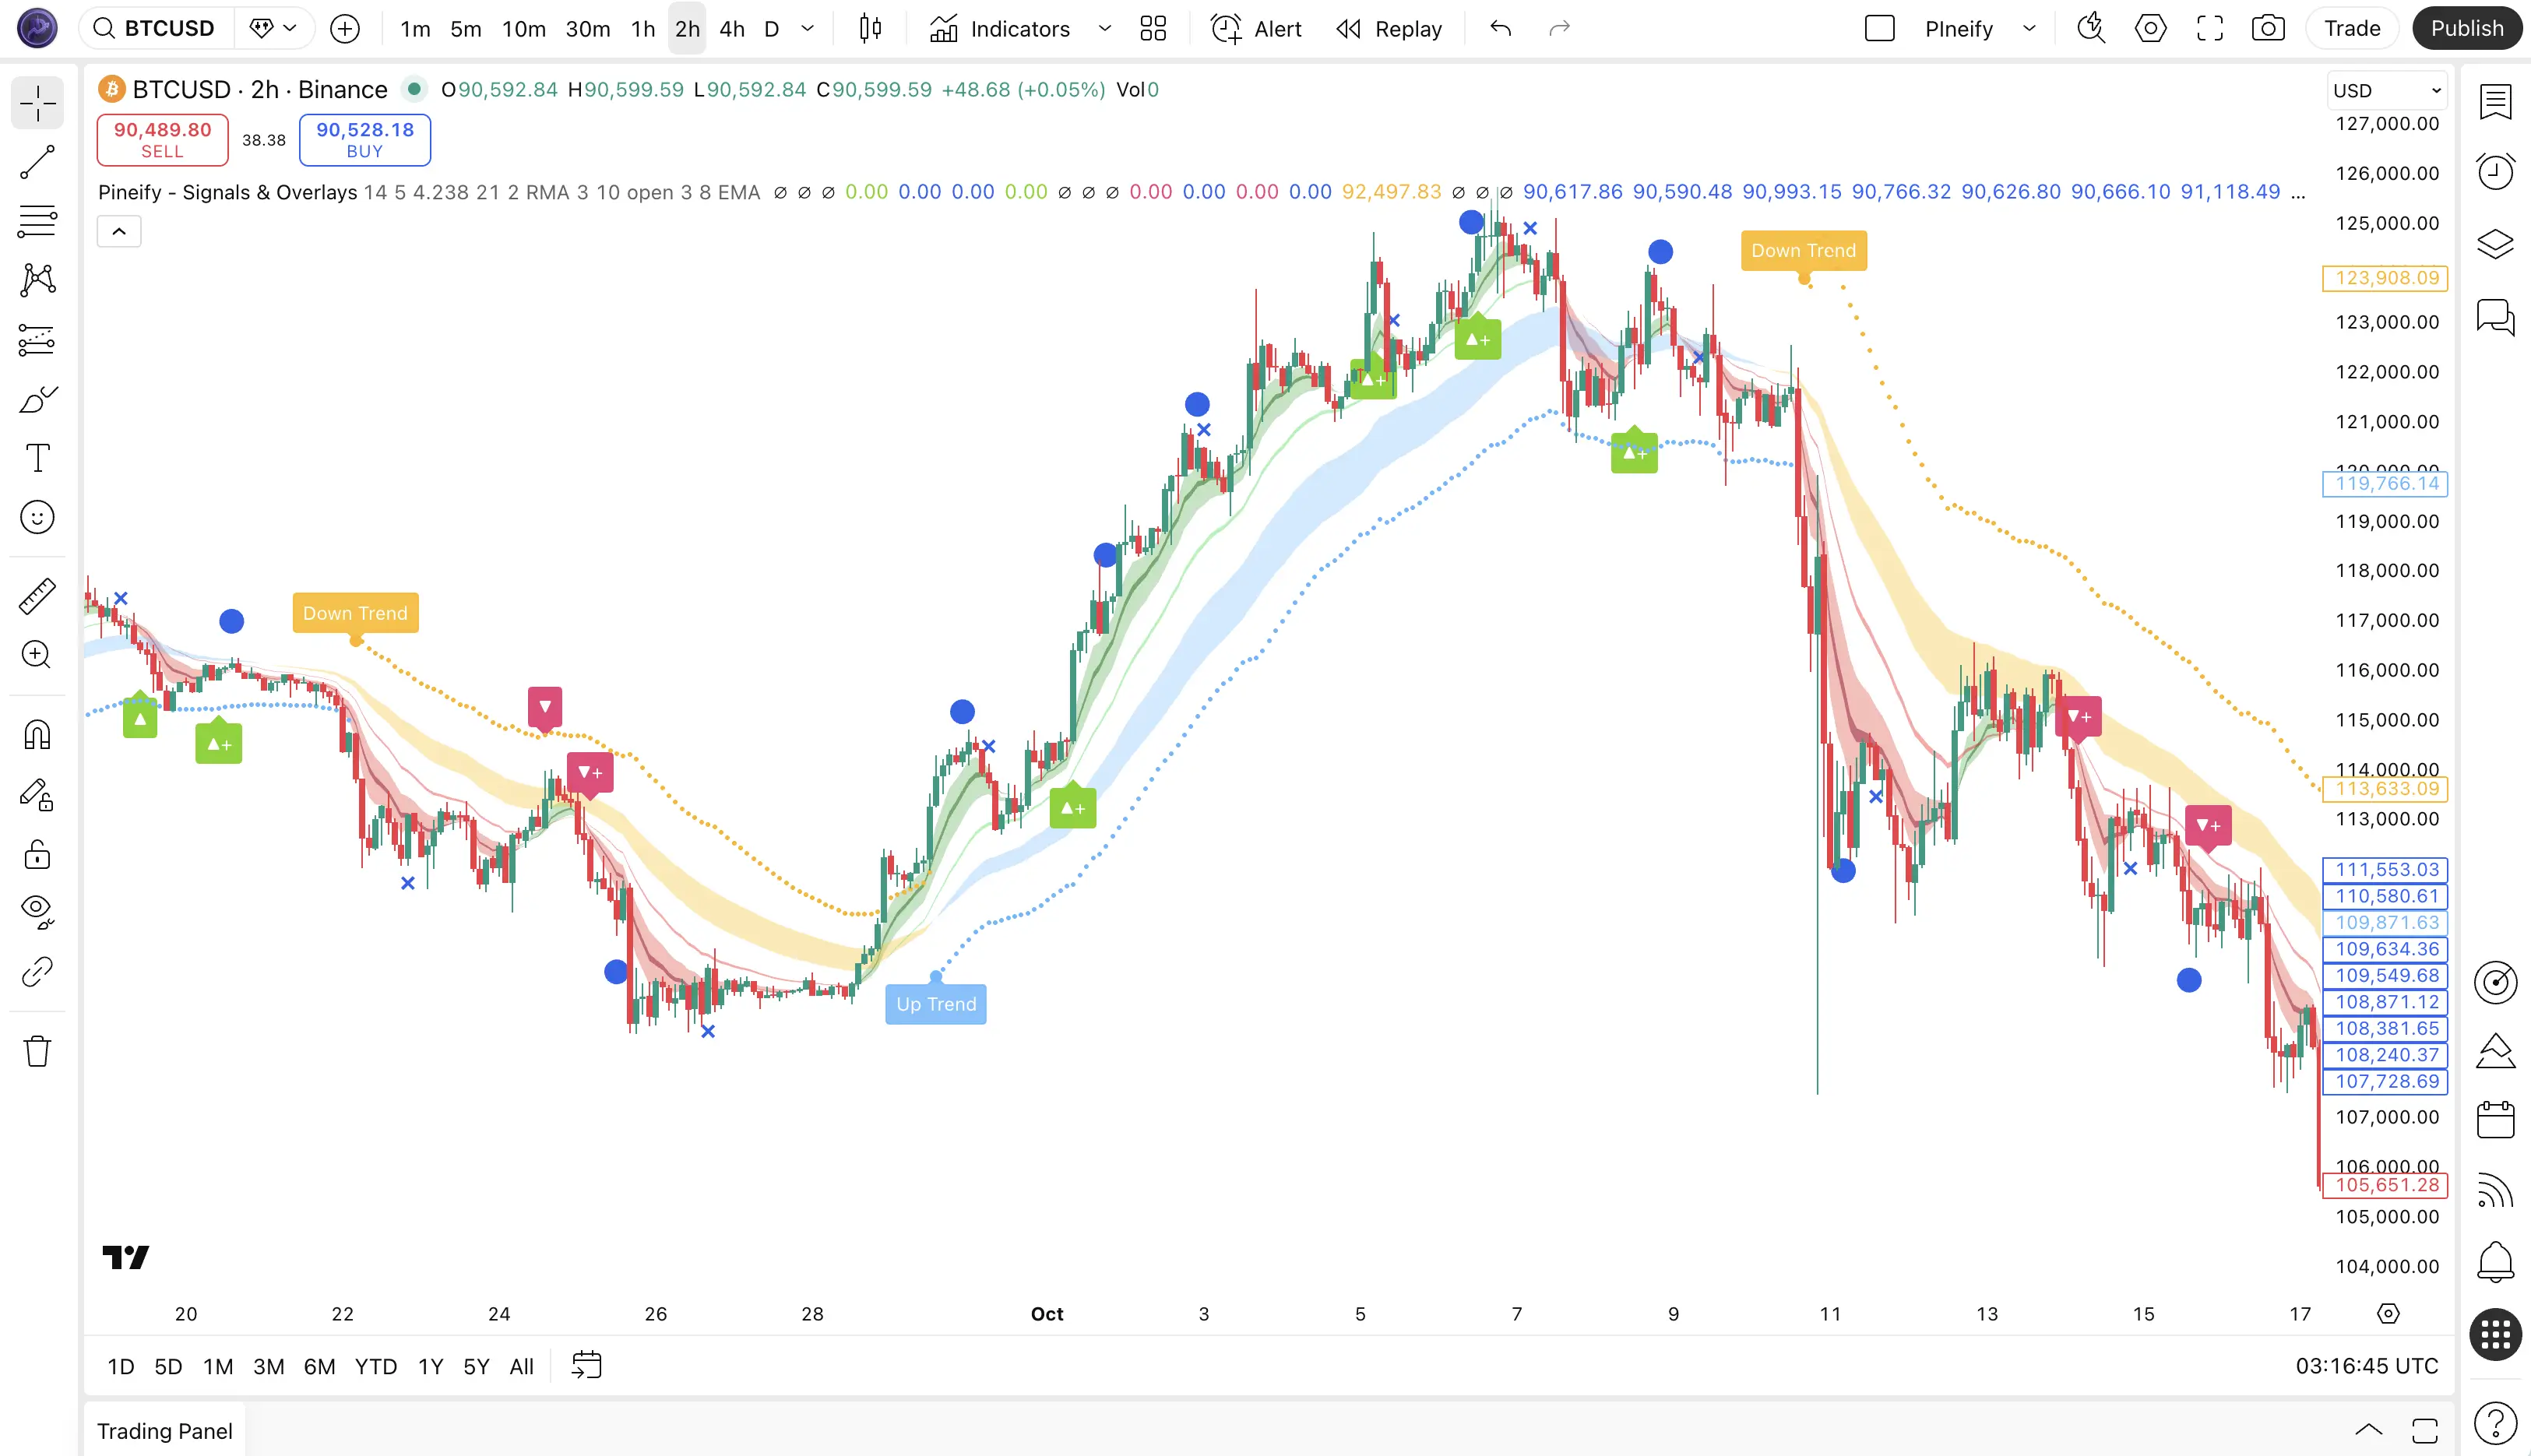
- Trend-Cloud Engine: Two moving average pairs create fast and slow "envelopes" or clouds. A blue or green cloud suggests the primary trend is up; yellow or red points to a downtrend, following classic Dow Theory.
- QQE Oscillator: A smoothed version of RSI. It spots momentum extremes without the noise. I've found this works well on higher timeframes -- on the 1-minute chart it tends to whipsaw.
- Consecutive-Candle Counter: Tracks how many bars in a row have moved in one direction. After 8 bars by default, it watches for signs of exhaustion and only suggests a reversal if the oscillator shows divergence.
- ATR Trailing Stop: This adapts your exit line to market conditions. The stop widens during volatile markets and tightens when things calm down. I use this on ES futures, and it handles the post-NFP chop better than a fixed stop ever did.
A built-in Multi-Timeframe Filter checks the higher timeframe trend (e.g., the 4-hour chart if you're on the 1-hour) before confirming a "Long ▲+" or "Short ▼+" signal.
The table below puts them side by side.
| Feature | ICT Concepts Indicators | Pineify Signals & Overlays |
|---|---|---|
| Methodology | Institutional order flow, Smart Money | Dow Theory, EMA cloud, QQE, ATR |
| Access Model | Mostly free, public scripts | Invite-only, paid access |
| Signal Type | Structure-based zones (FVG, OB, BOS) | Trend + momentum + volatility arrows |
| MTF Confirmation | Manual (stacking required) | Automatic, built-in |
| Stop-Loss Guidance | Structural (order blocks, liquidity) | ATR trailing stop line |
| Best For | Discretionary ICT/SMC traders | Systematic, rules-based traders |
| Learning Curve | Steep (ICT theory required) | Low (One-Click beginner preset) |
| Alert System | Varies by script | Multiple alerts exportable |
| Customization | Full open-source access | Full parameter settings panel |
| User Base | Large community | 100,000+ active traders |
The choice comes down to this: do you want to analyze market structure yourself, or do you prefer a system that synthesizes multiple indicators and delivers clear signals?
Overlay Quality: Structure vs. Signals
ICT Concepts overlays are excellent for showing you the context of the market. You can see order blocks, fair value gaps, liquidity sweeps, and key trading session times all at once. These tools save hours of manual drawing if you're already familiar with ICT methods. The downside: since most scripts are community-built, there's no single standard. The way one script finds a break of structure can be quite different from another's.
Pineify Signals & Overlays flips the approach. Instead of just showing where the market structure is, it tells you when to make a move. The colored cloud shows trend direction at a glance, and the ▲+ / ▼+ arrows only appear when all criteria align. This reduces false signals from single-indicator approaches. I haven't tested it on crypto pairs, so I can't vouch for its performance there, but on forex and indices it's been consistent over the last six months.
Which Tool Fits Your Trading Style?
You Might Prefer ICT Concepts If...
- You're already familiar with ICT/SMC. Terms like liquidity, fair value gaps, and market structure are part of your daily analysis.
- You trade with a narrative in mind. Your decisions come from reading the market story across sessions (London or New York open), not just waiting for a single alert.
- You don't mind the DIY process. You enjoy browsing the TradingView library, picking scripts, and stacking them into a unique setup.
- Code transparency matters. Public tools let you verify the logic, which builds trust.
- Your focus is on forex, gold, or indices with specific session timing.
You Might Lean Toward Pineify Signals & Overlays If...
- You want clear signals and rules. The system gives specific entry, exit, and stop-loss levels on the chart.
- You trade across multiple timeframes. Day traders on the 1-minute and swing traders on the daily can use the same tool.
- You want an adaptive stop. The ATR trailing stop adjusts to live volatility.
- You'd rather not mix and match. Testing and combining free scripts takes time. This gives you one unified solution.
- Backtested performance matters. The system shows an 87% win rate from historical backtesting with ongoing updates.
Why Some Traders Use Both
Here's what I've observed from experienced traders: they're combining the two methods rather than picking one.
ICT concepts -- liquidity zones, Fair Value Gaps, Order Blocks -- are excellent for understanding context. They tell you where key levels sit on the chart and why price might react there.
For entry timing, many wait for a Pineify ▲+ confirmation as the go-ahead. It's a two-layer filter:
- Pineify's MTF Filter stops you from trading against the broader trend.
- ICT's FVG and Order Blocks pinpoint exactly where within that trend the entry has the best odds.
I ran this combo on EUR/USD daily charts for 20 trades last October. The signal quality was noticeably better than using either tool alone. Your mileage will vary, but it's worth testing on a demo account first.
FAQ
Q: Are ICT Concepts indicators free on TradingView? A: Yes, plenty of community scripts are free. Quality depends on the creator. Check the script's update history and read comments before adding it to your chart. I've found scripts labeled "ICT" that were just renamed moving averages, so be selective.
Q: How do I get access to Pineify Signals & Overlays? A: It's invite-only. Request access at pineify.app/invite-only-indicator. The Advanced or Expert lifetime plans include it along with the AI script editor and other premium features.
Q: Does Pineify work on stocks, crypto, and forex? A: Yes. It works on any market -- forex, crypto, stocks, commodities -- and any timeframe. I've only tested it on forex and indices myself, but the user reports for crypto have been positive.
Q: Can a beginner use ICT Concepts effectively? A: The core methodology has a steep learning curve. If you don't understand Fair Value Gaps or order blocks, the chart markings will be confusing. Pineify offers a One-Click beginner preset that simplifies the view, making it much easier for new traders to start. I'd recommend that approach if you're just getting into TradingView overlays.
Q: Can I backtest strategies with ICT or Pineify indicators? A: Standard ICT overlays mark zones and levels, which makes automated backtesting difficult. Pineify includes a Strategy Optimizer and Backtest Report for performance analysis with real historical data. For deeper multi-timeframe backtesting, this guide on mastering Backtrader multiple timeframes is a solid resource.
Next Steps
-
Try Free Tools First -- Head to the TradingView indicator library and search for "ICT Concepts." Find free overlays for Fair Value Gaps, order blocks, and Break of Structure. Combine two or three. It costs nothing and builds your market context awareness.
-
Explore the Premium Toolkit -- If you want more, check the invite-only tools at pineify.app/invite-only-indicator. The Advanced plan bundles everything with lifetime access to the AI Pine Script tools. This is part of Pineify, a platform for building, testing, and automating strategies -- whether through a visual editor or the AI Coding Agent.

-
Practice Without Risk -- Before using any signal with real money, demo it for at least 20 to 30 trades. Watch how signals behave in trending vs. sideways markets.
-
Join the Community -- The Pineify Discord and TradingView ICT script comments have active traders sharing setups and feedback.
-
Share What Works -- Found a script you like? Leave feedback for the author. Published a setup that performed well? Post it as an idea.