

Trading Journal
Use Pineify's trading journal to record trades, review performance, compare strategies, and organize diary notes, sessions, statistics, and reports.
Pineify's trading journal is a workspace for recording trades and reviewing the context around them. It combines trade details with strategy tags, calendar history, performance statistics, diary notes, sessions, and reports, so a trader can inspect a consistent record instead of relying on scattered spreadsheets or memory.
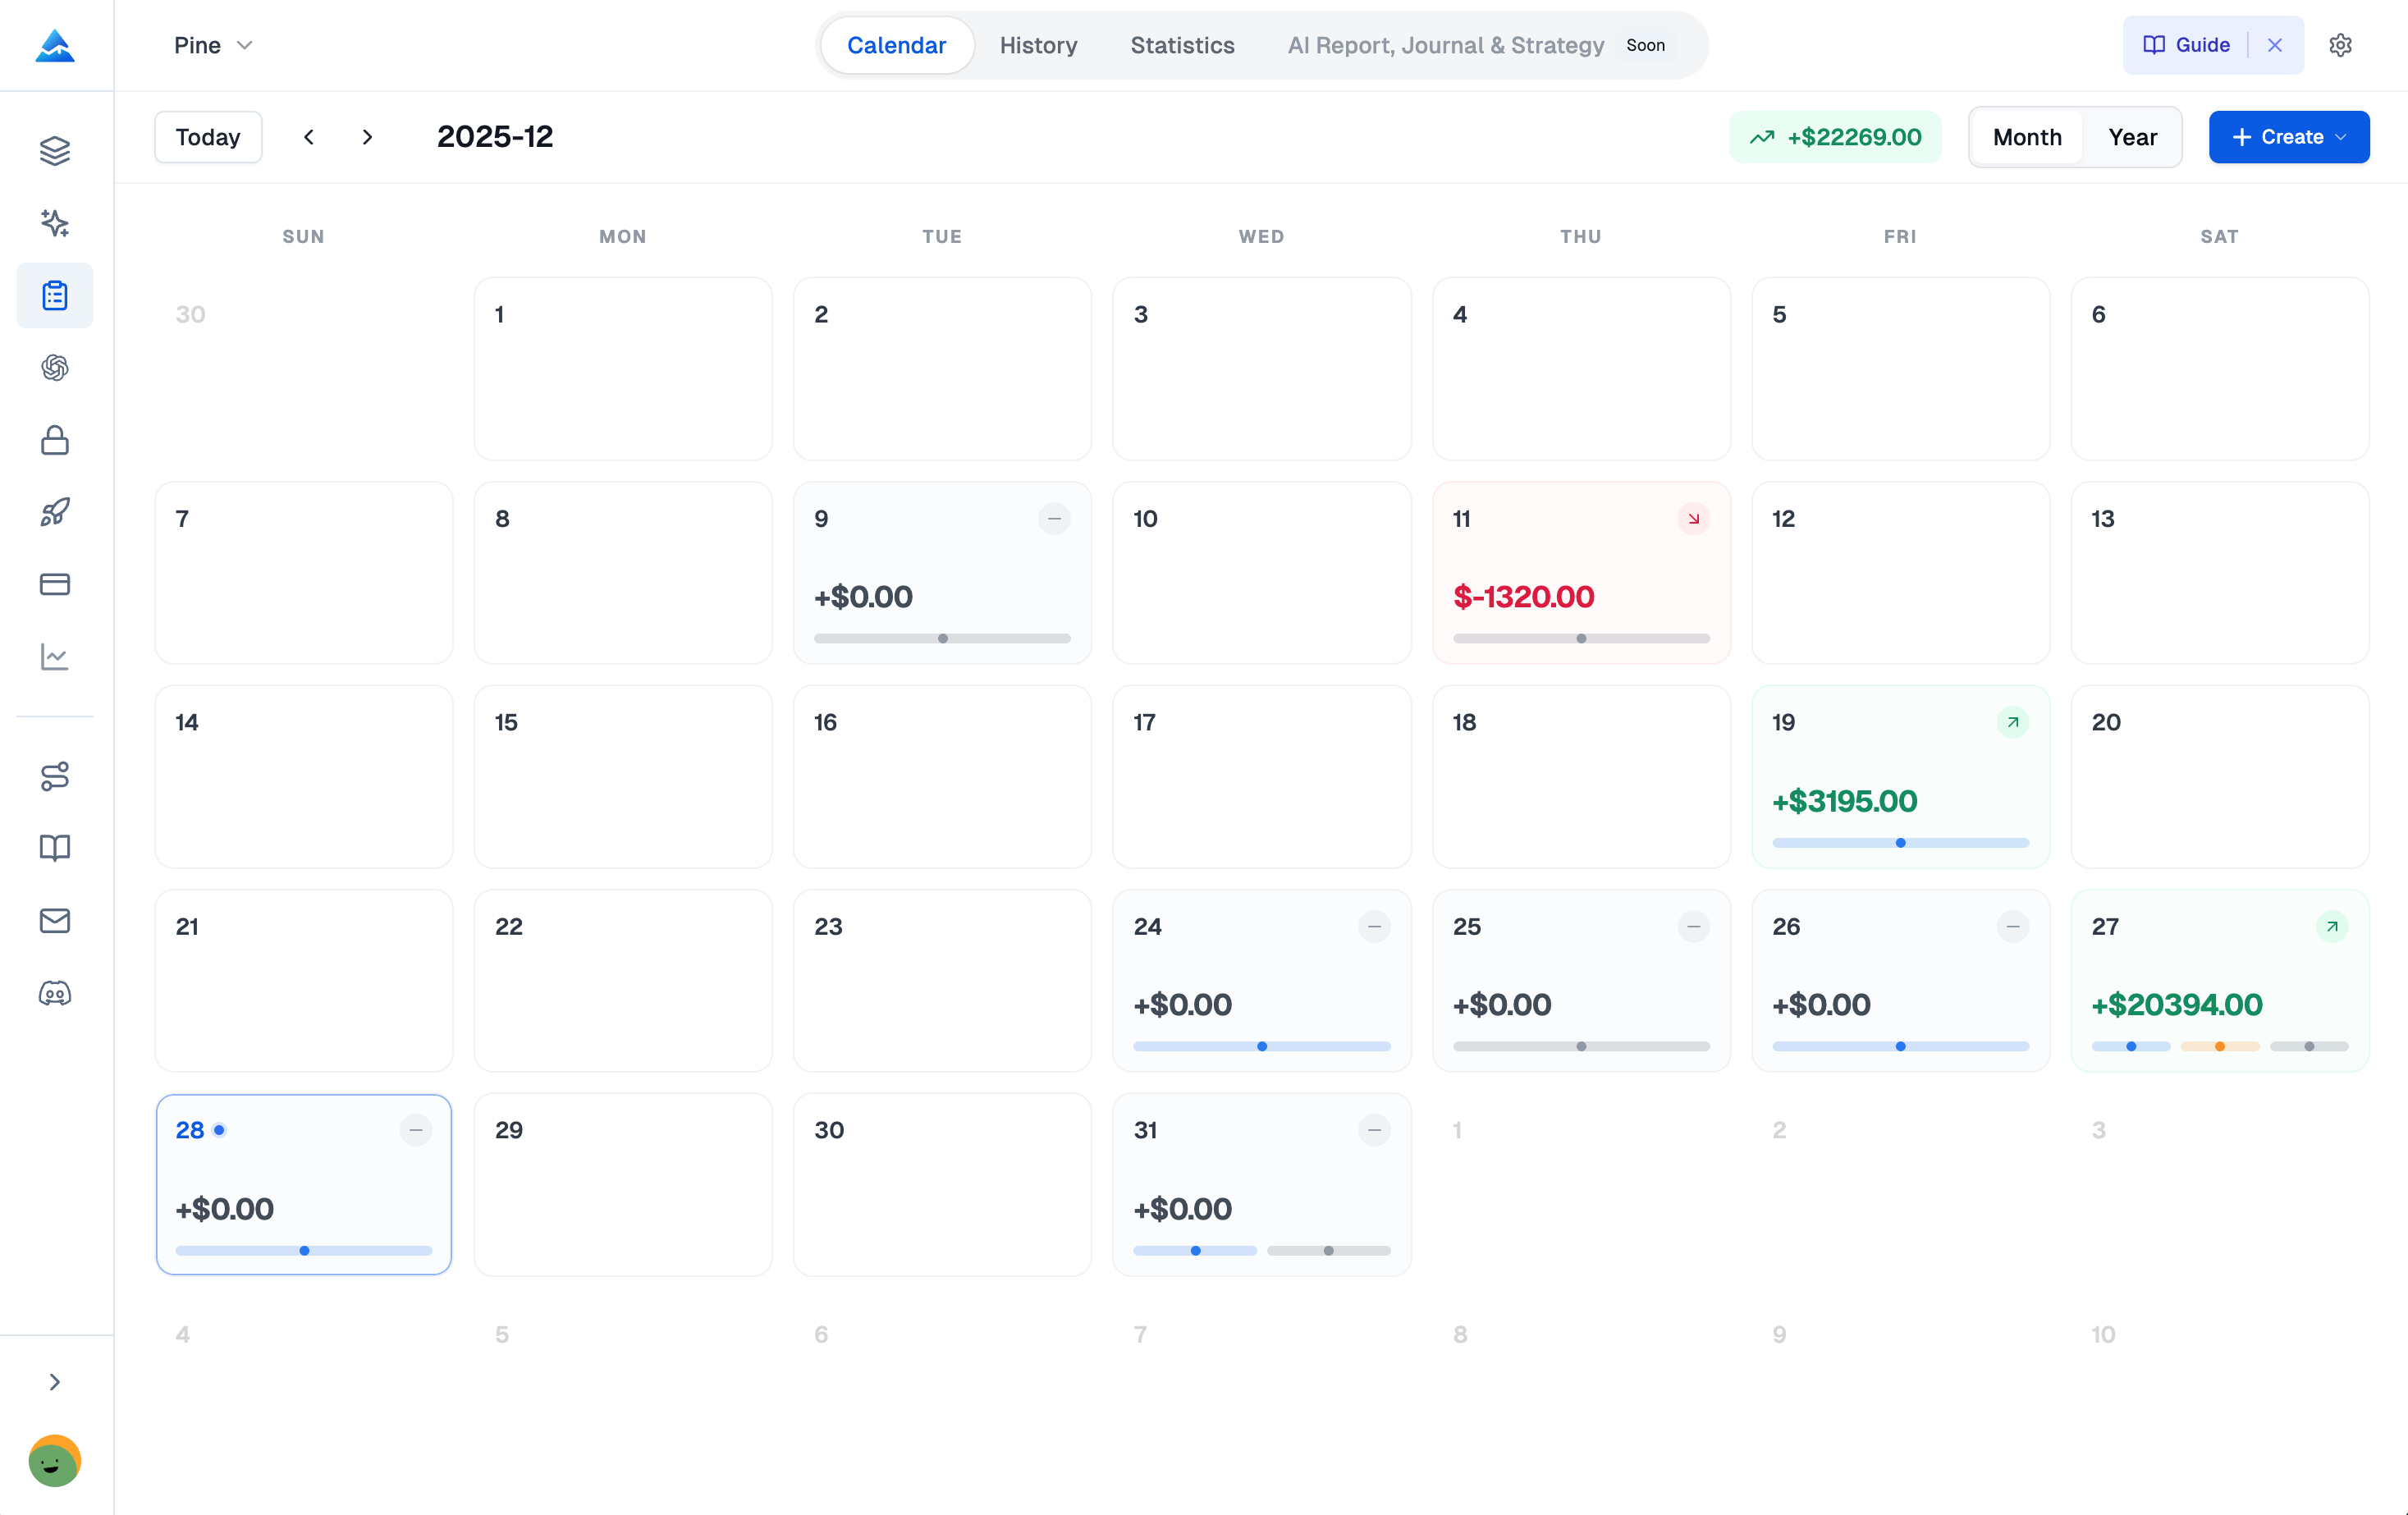
What is Pineify's trading journal?
Pineify's trading journal is a browser-based trade journal app for entering, organizing, and reviewing your own trade records. A trade diary can hold the decision context as well as the transaction details, while the journal's filters and views help you inspect the same record by date, strategy, session, or outcome.
The journal is designed for structured review, not for declaring that a method will be profitable. The quality of its statistics depends on the accuracy and completeness of the trade, fee, timezone, and setup data you enter or import.
How do you start a trading journal workflow?
Use this sequence to keep each record connected to the decision it represents:
- Open the journal. Select Open Trading Journal and sign in if the app requests access.
- Record the trade. Enter the symbol, direction, entry and exit details, dates, position size, fees, order type, and notes available in the editor.
- Assign context. Choose a named strategy and, where useful, a trading session so later comparisons use consistent labels.
- Add a reflection. Capture the market observation, decision rationale, and emotional state in Diary rather than relying on memory.
- Review the record. Move from Calendar or History to Statistics, Strategies, Sessions, and Reports to compare the same trades from different angles.
Which modules are included?
Each module answers a different review question. The table below maps the interface labels to the record you inspect.
| Module | What it helps you inspect | Typical review question |
|---|---|---|
| Calendar | Daily activity and results in a date-based view | Which days contain trades or recorded results? |
| History | Individual trade records and their details | What exactly was recorded for this trade? |
| Statistics | Aggregate performance measures and charts | What does this sample show across the selected period? |
| Strategies | Results grouped by strategy labels | How do the tagged strategies compare on the same metrics? |
| Diary | Daily or trade-linked reflections | What was the reasoning and context at the time? |
| Sessions | Results grouped by time windows | Does the selected session show a different pattern? |
| Reports | Portfolio and period summaries | What should be saved or reviewed for this period? |
How does trading performance analytics work?
The Statistics view summarizes the records that match your selected filters. It can show cumulative P&L, win and loss distribution, average trade duration, profit factor, expectancy, Sharpe ratio, maximum drawdown, and consecutive-loss information when the relevant inputs are present.
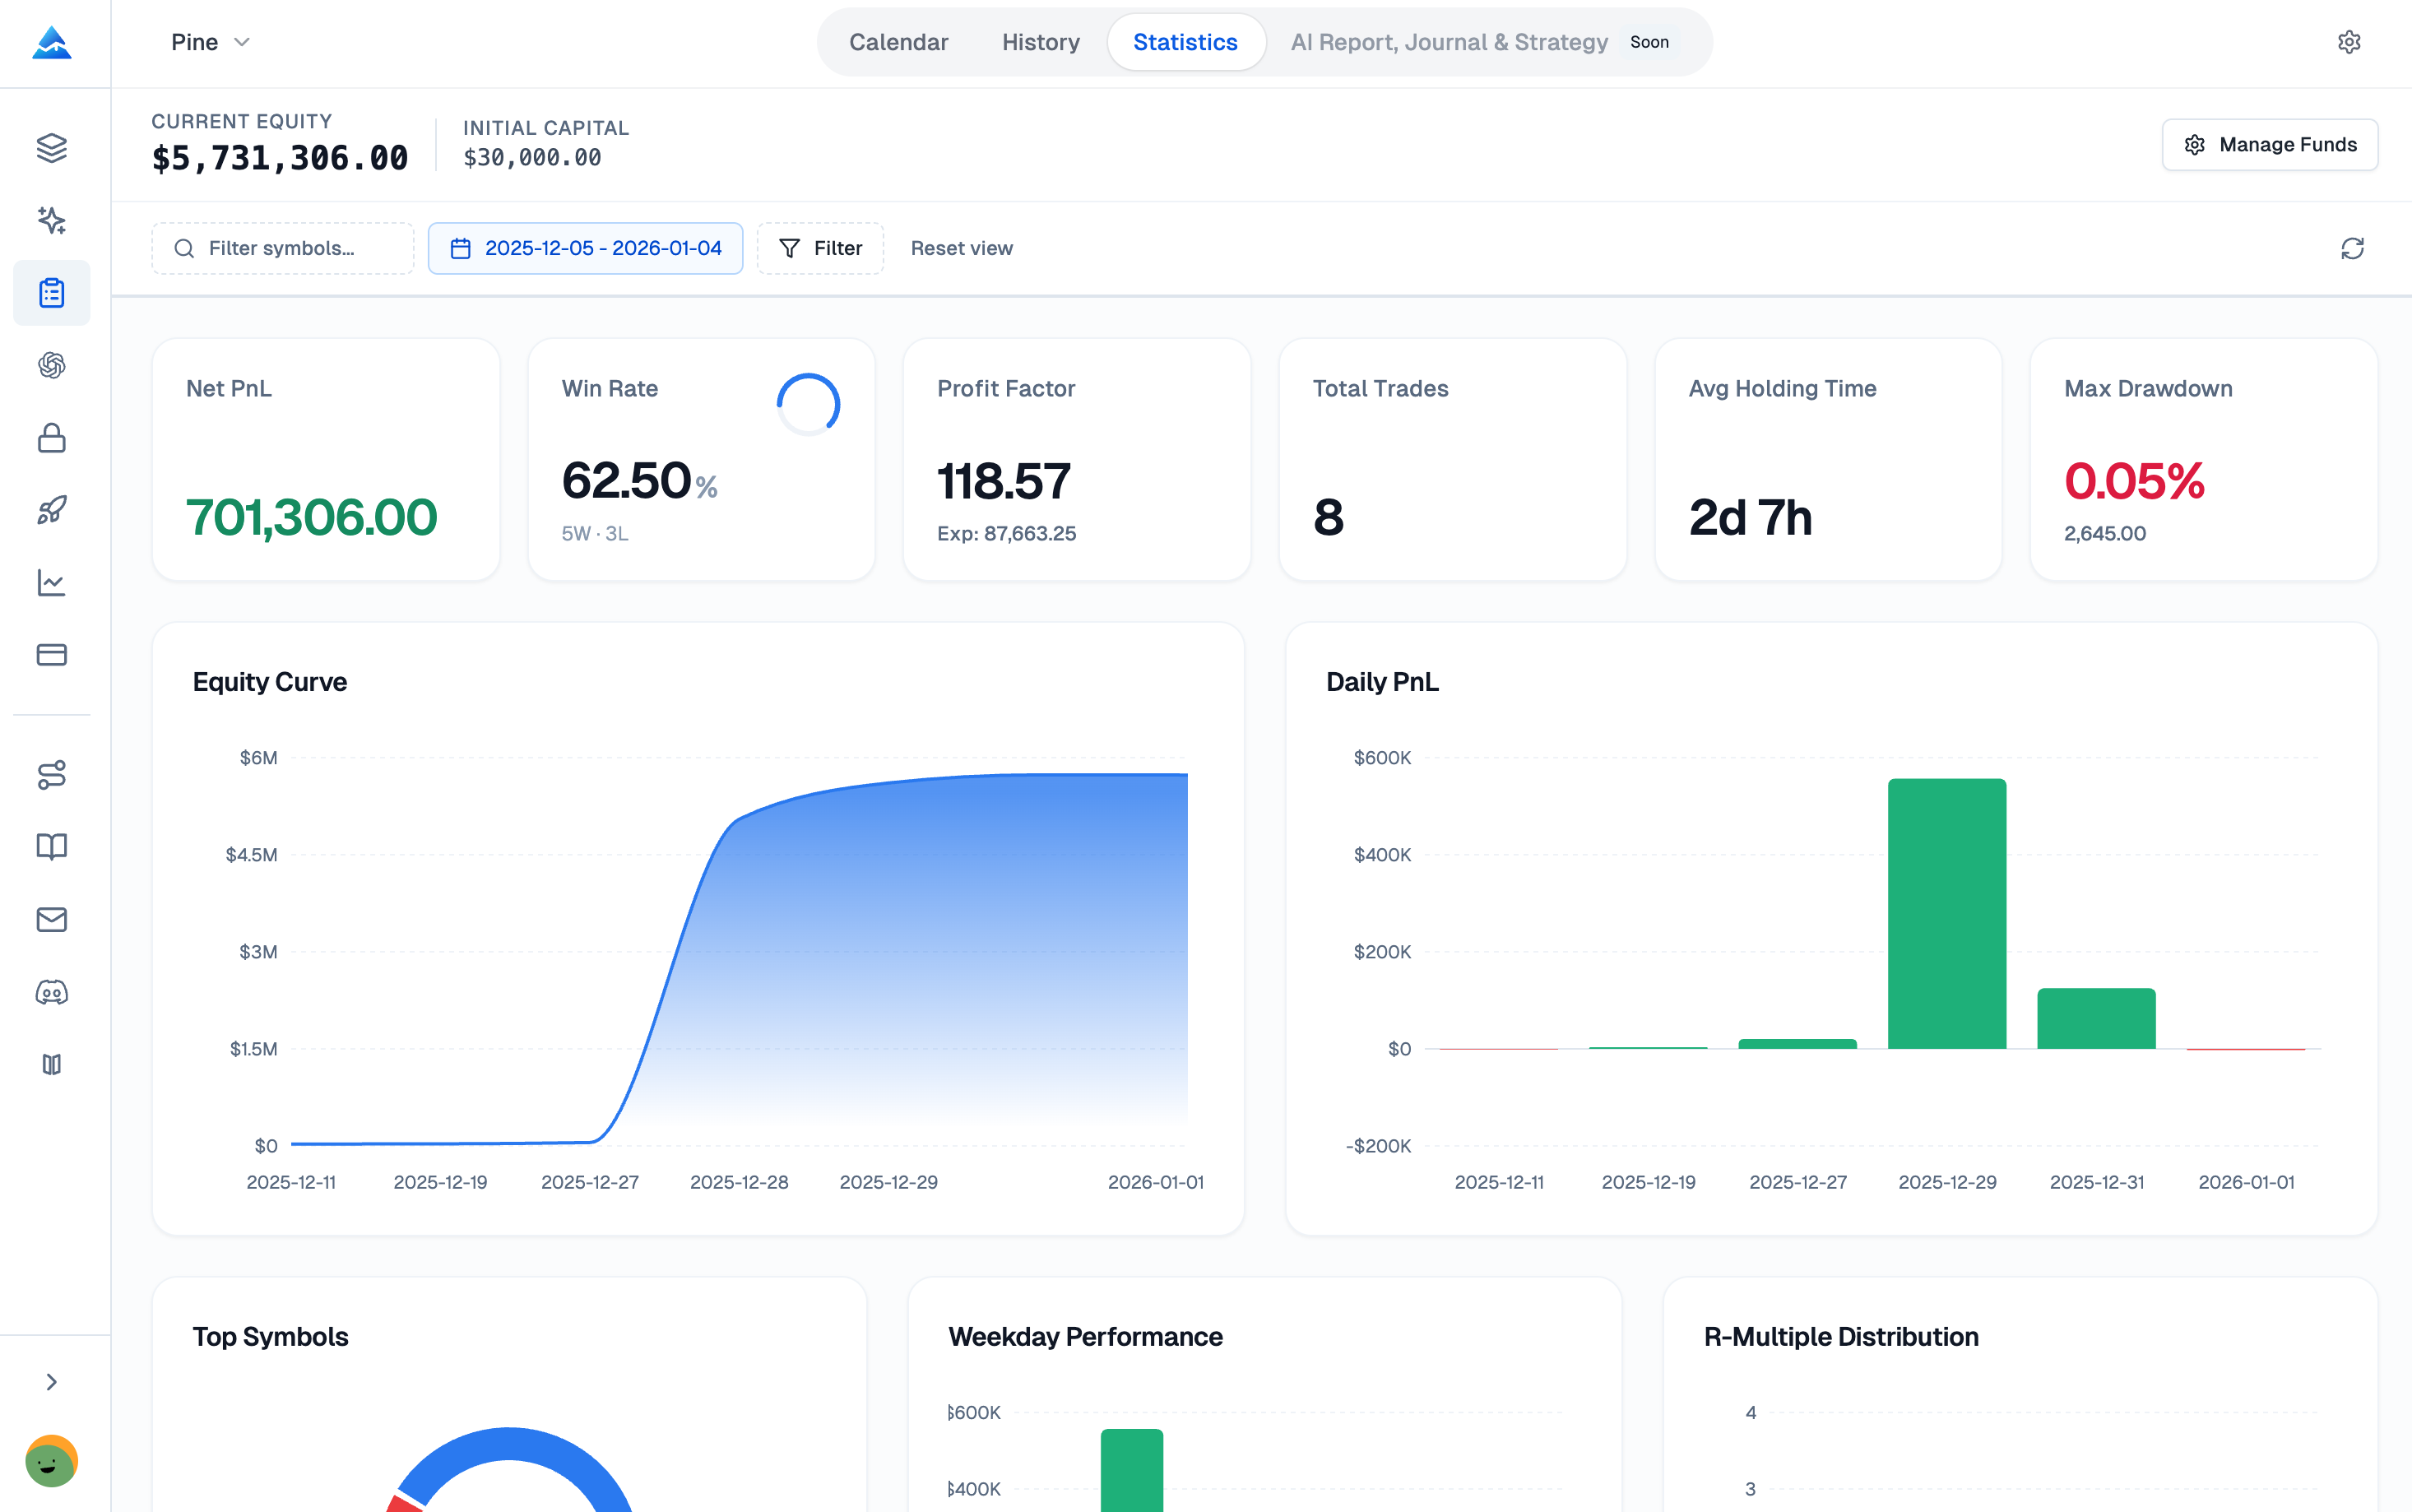
Read each metric together with its date range, strategy filter, asset, and sample size. A missing fee, inconsistent timezone, or incorrect exit can change the result, so trading performance analytics should be treated as a description of the recorded sample rather than an independent audit of execution.
How should you use Calendar and History?
Calendar gives a date-level view of activity, while History lets you open the underlying trade records. Start with Calendar to identify a period, then use History to check the entries that produced the displayed result before drawing a conclusion.
How do Strategies and Sessions organize comparisons?
Strategies and Sessions add repeatable labels to the same trade records. They are most useful when the labels follow a clear rule, because inconsistent naming can make a comparison look more precise than the underlying data.
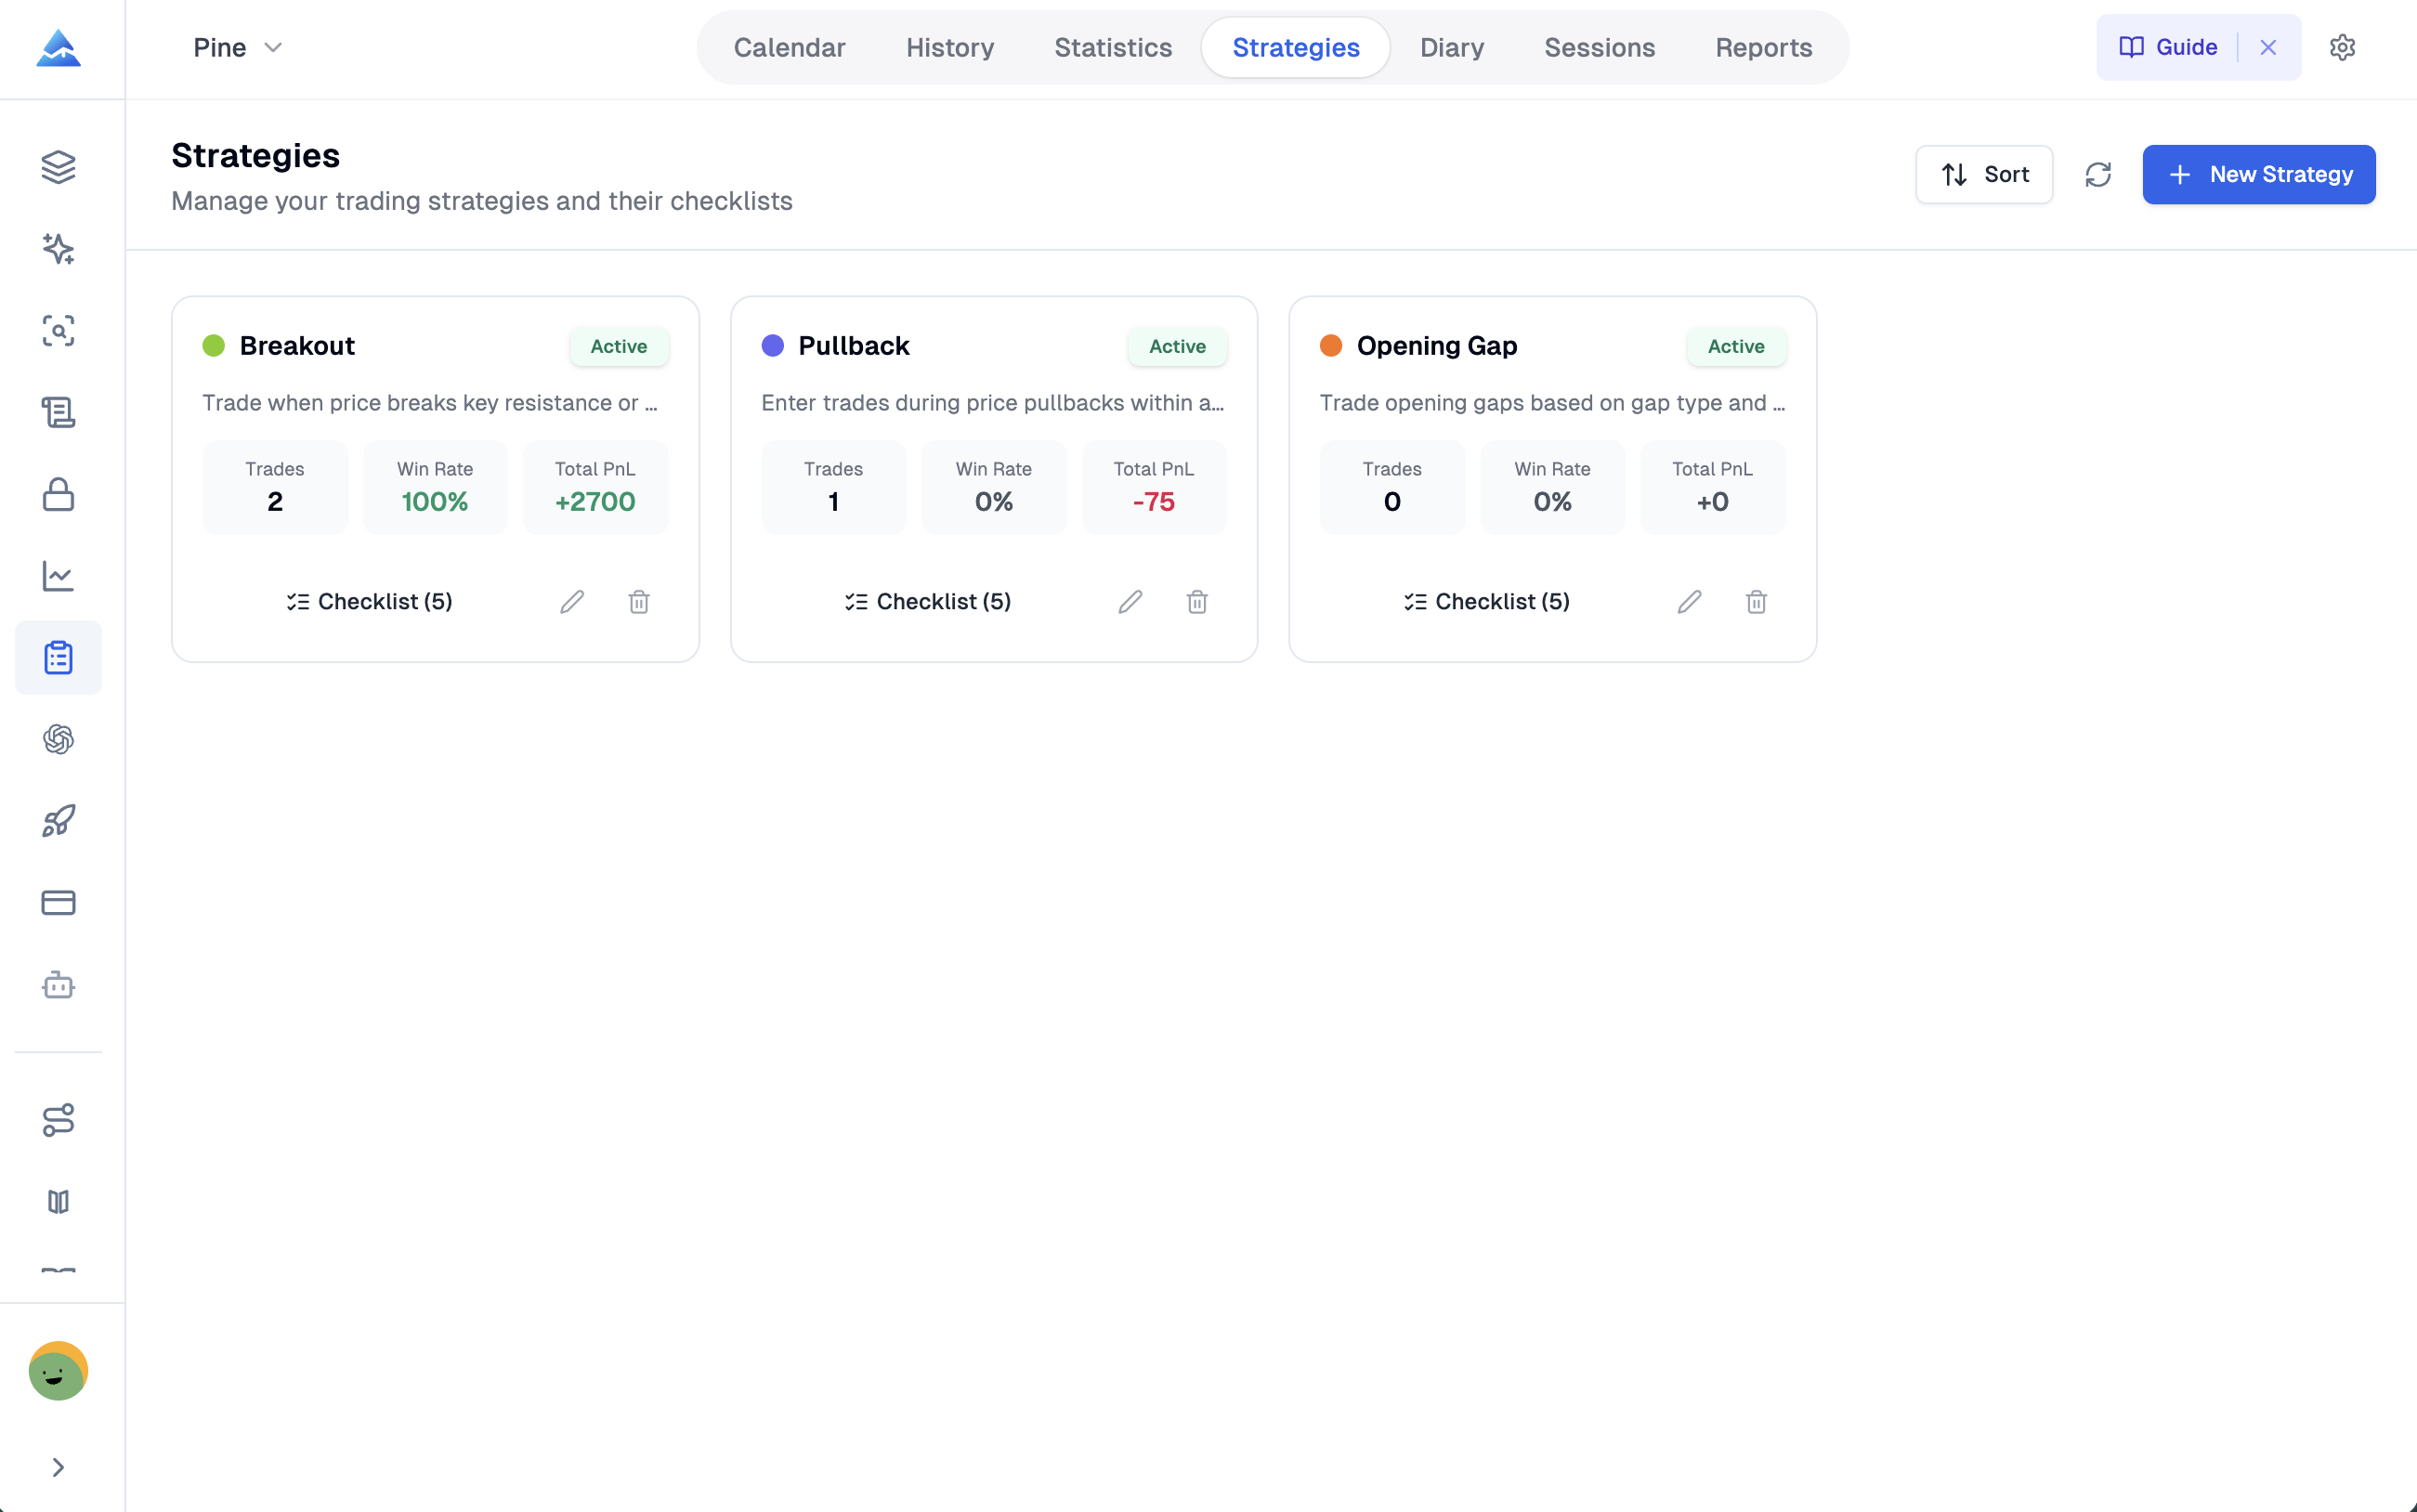
What can you review in Strategies?
Create names such as Mean Reversion, Breakout, or Earnings Play, then compare each group by P&L, win rate, average duration, and profit factor. The strategy view supports side-by-side review and filtering; it does not decide which strategy should be traded.
What can you review in Sessions?
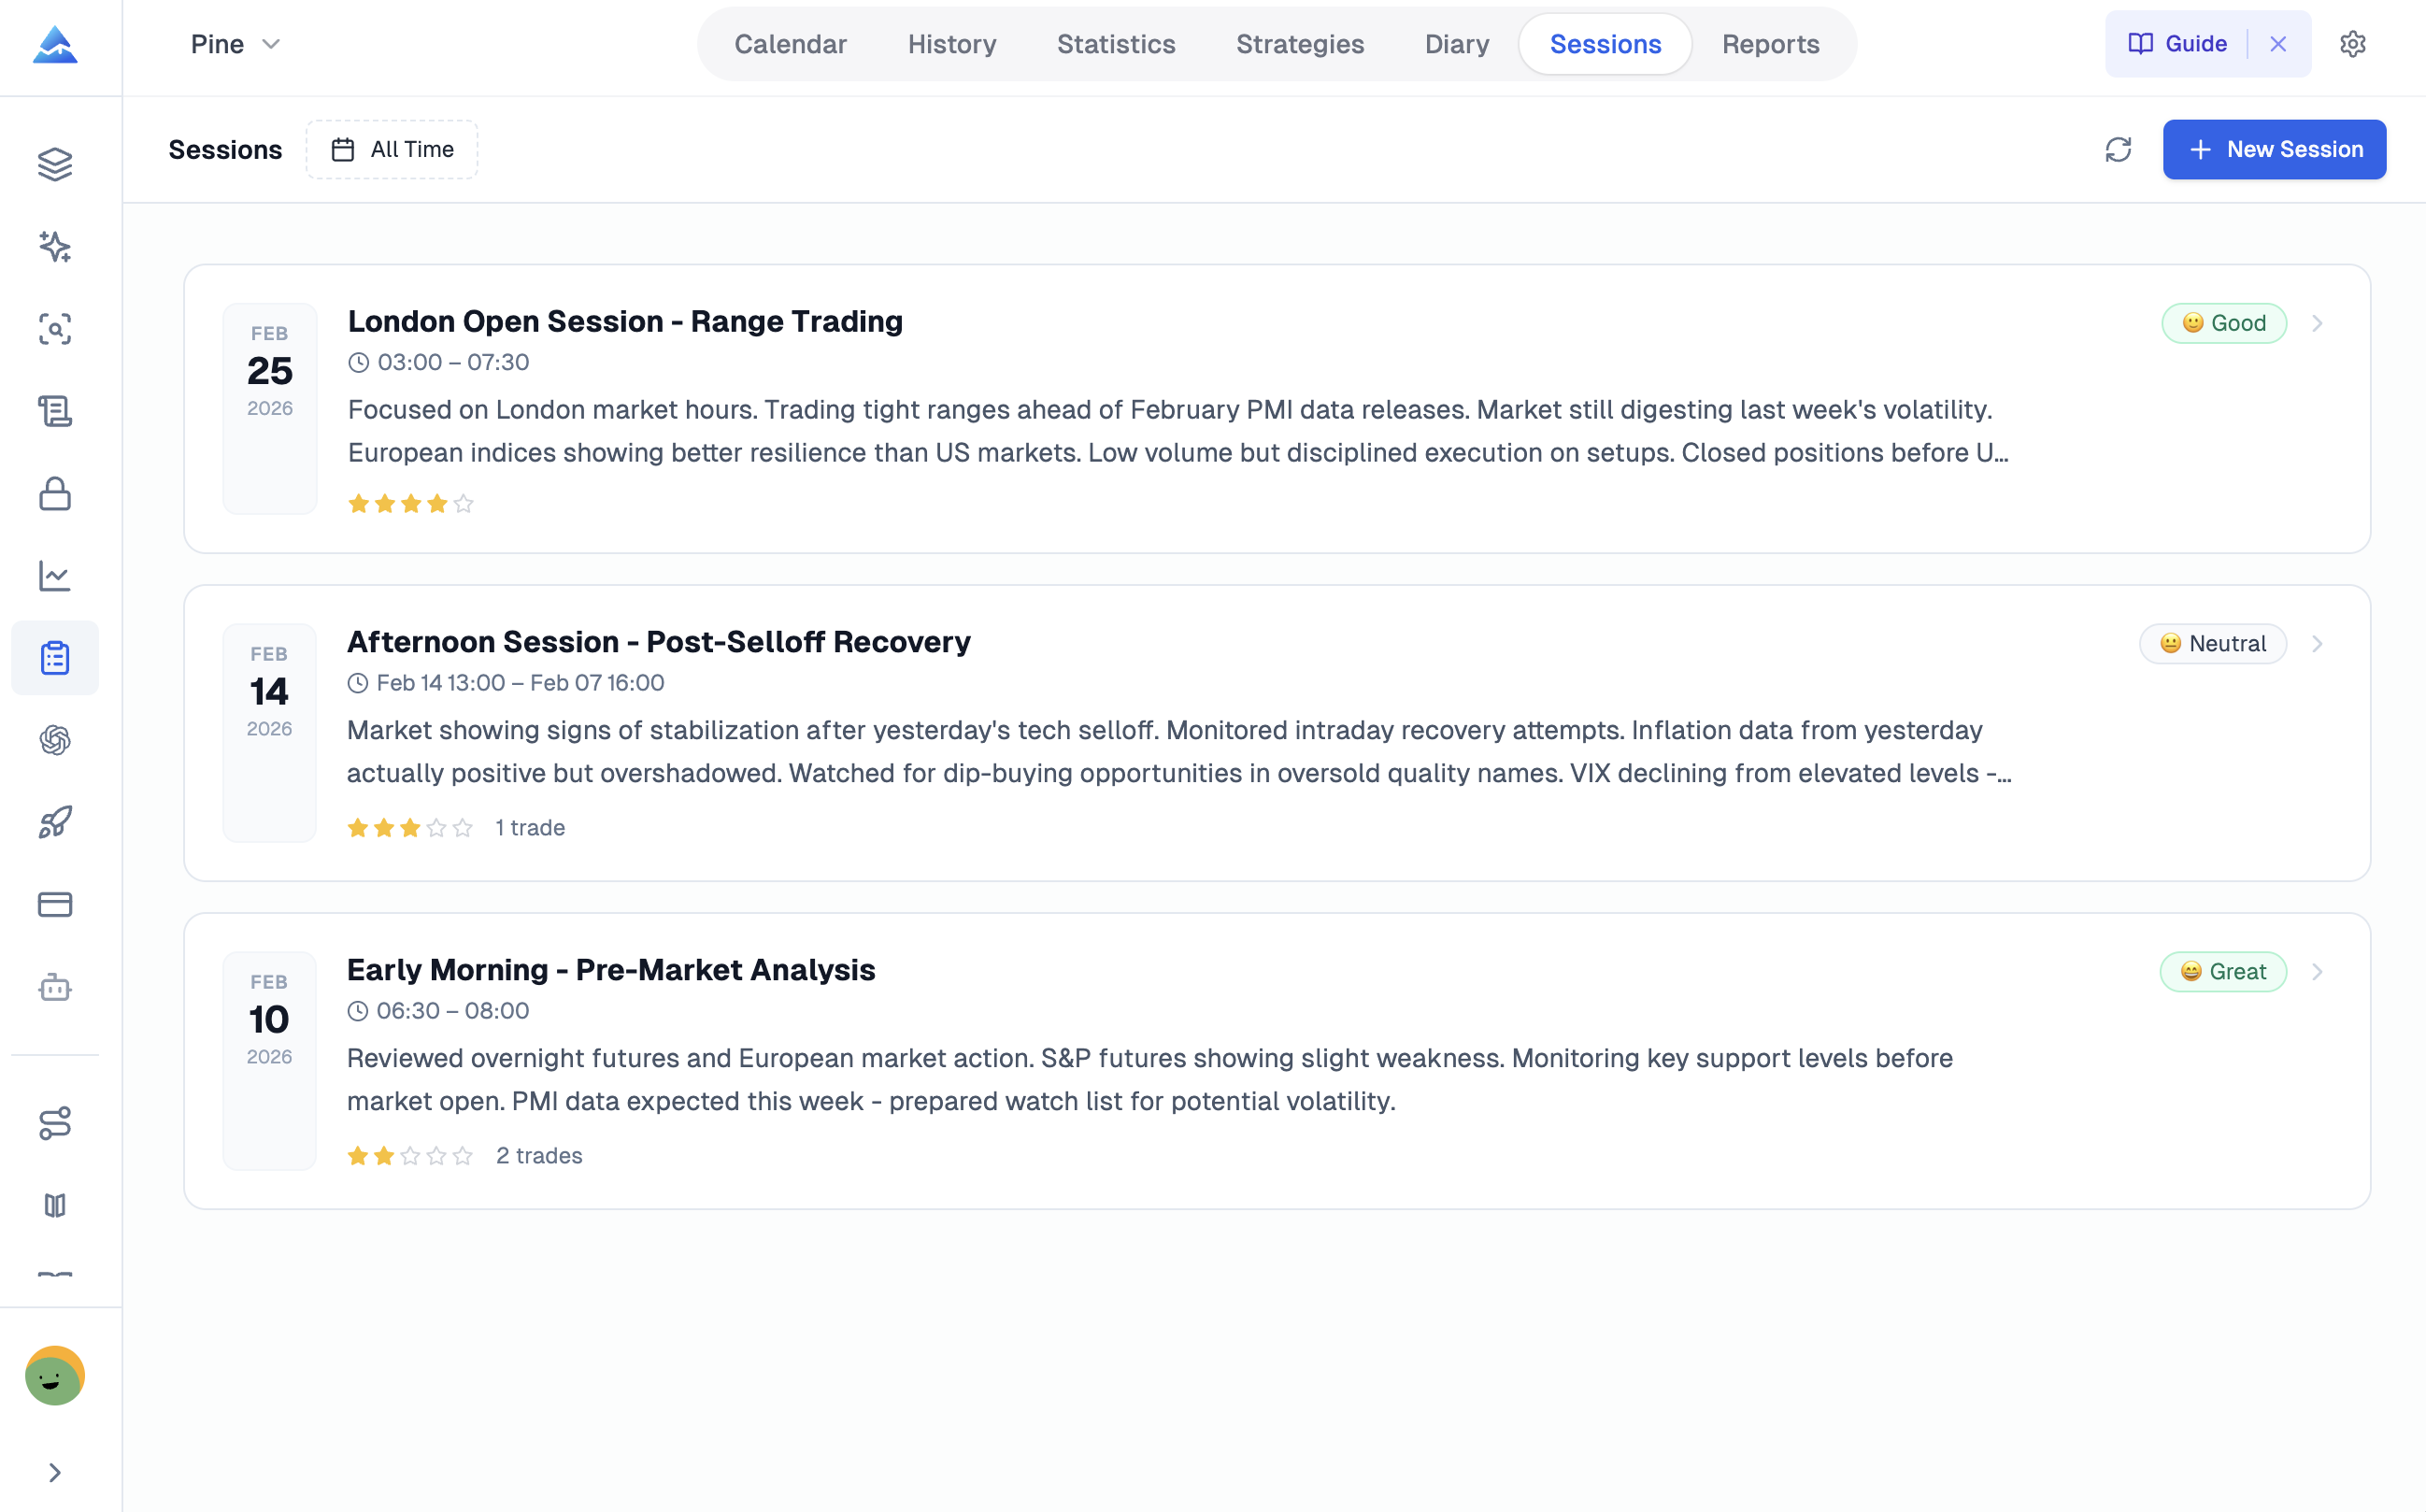
Sessions group trades by morning, afternoon, or custom time windows so you can inspect time-based patterns. Review the session definition, timezone, and market conditions with the result, because changing any of these inputs changes which trades belong to the group.
How do Diary and Reports support review?
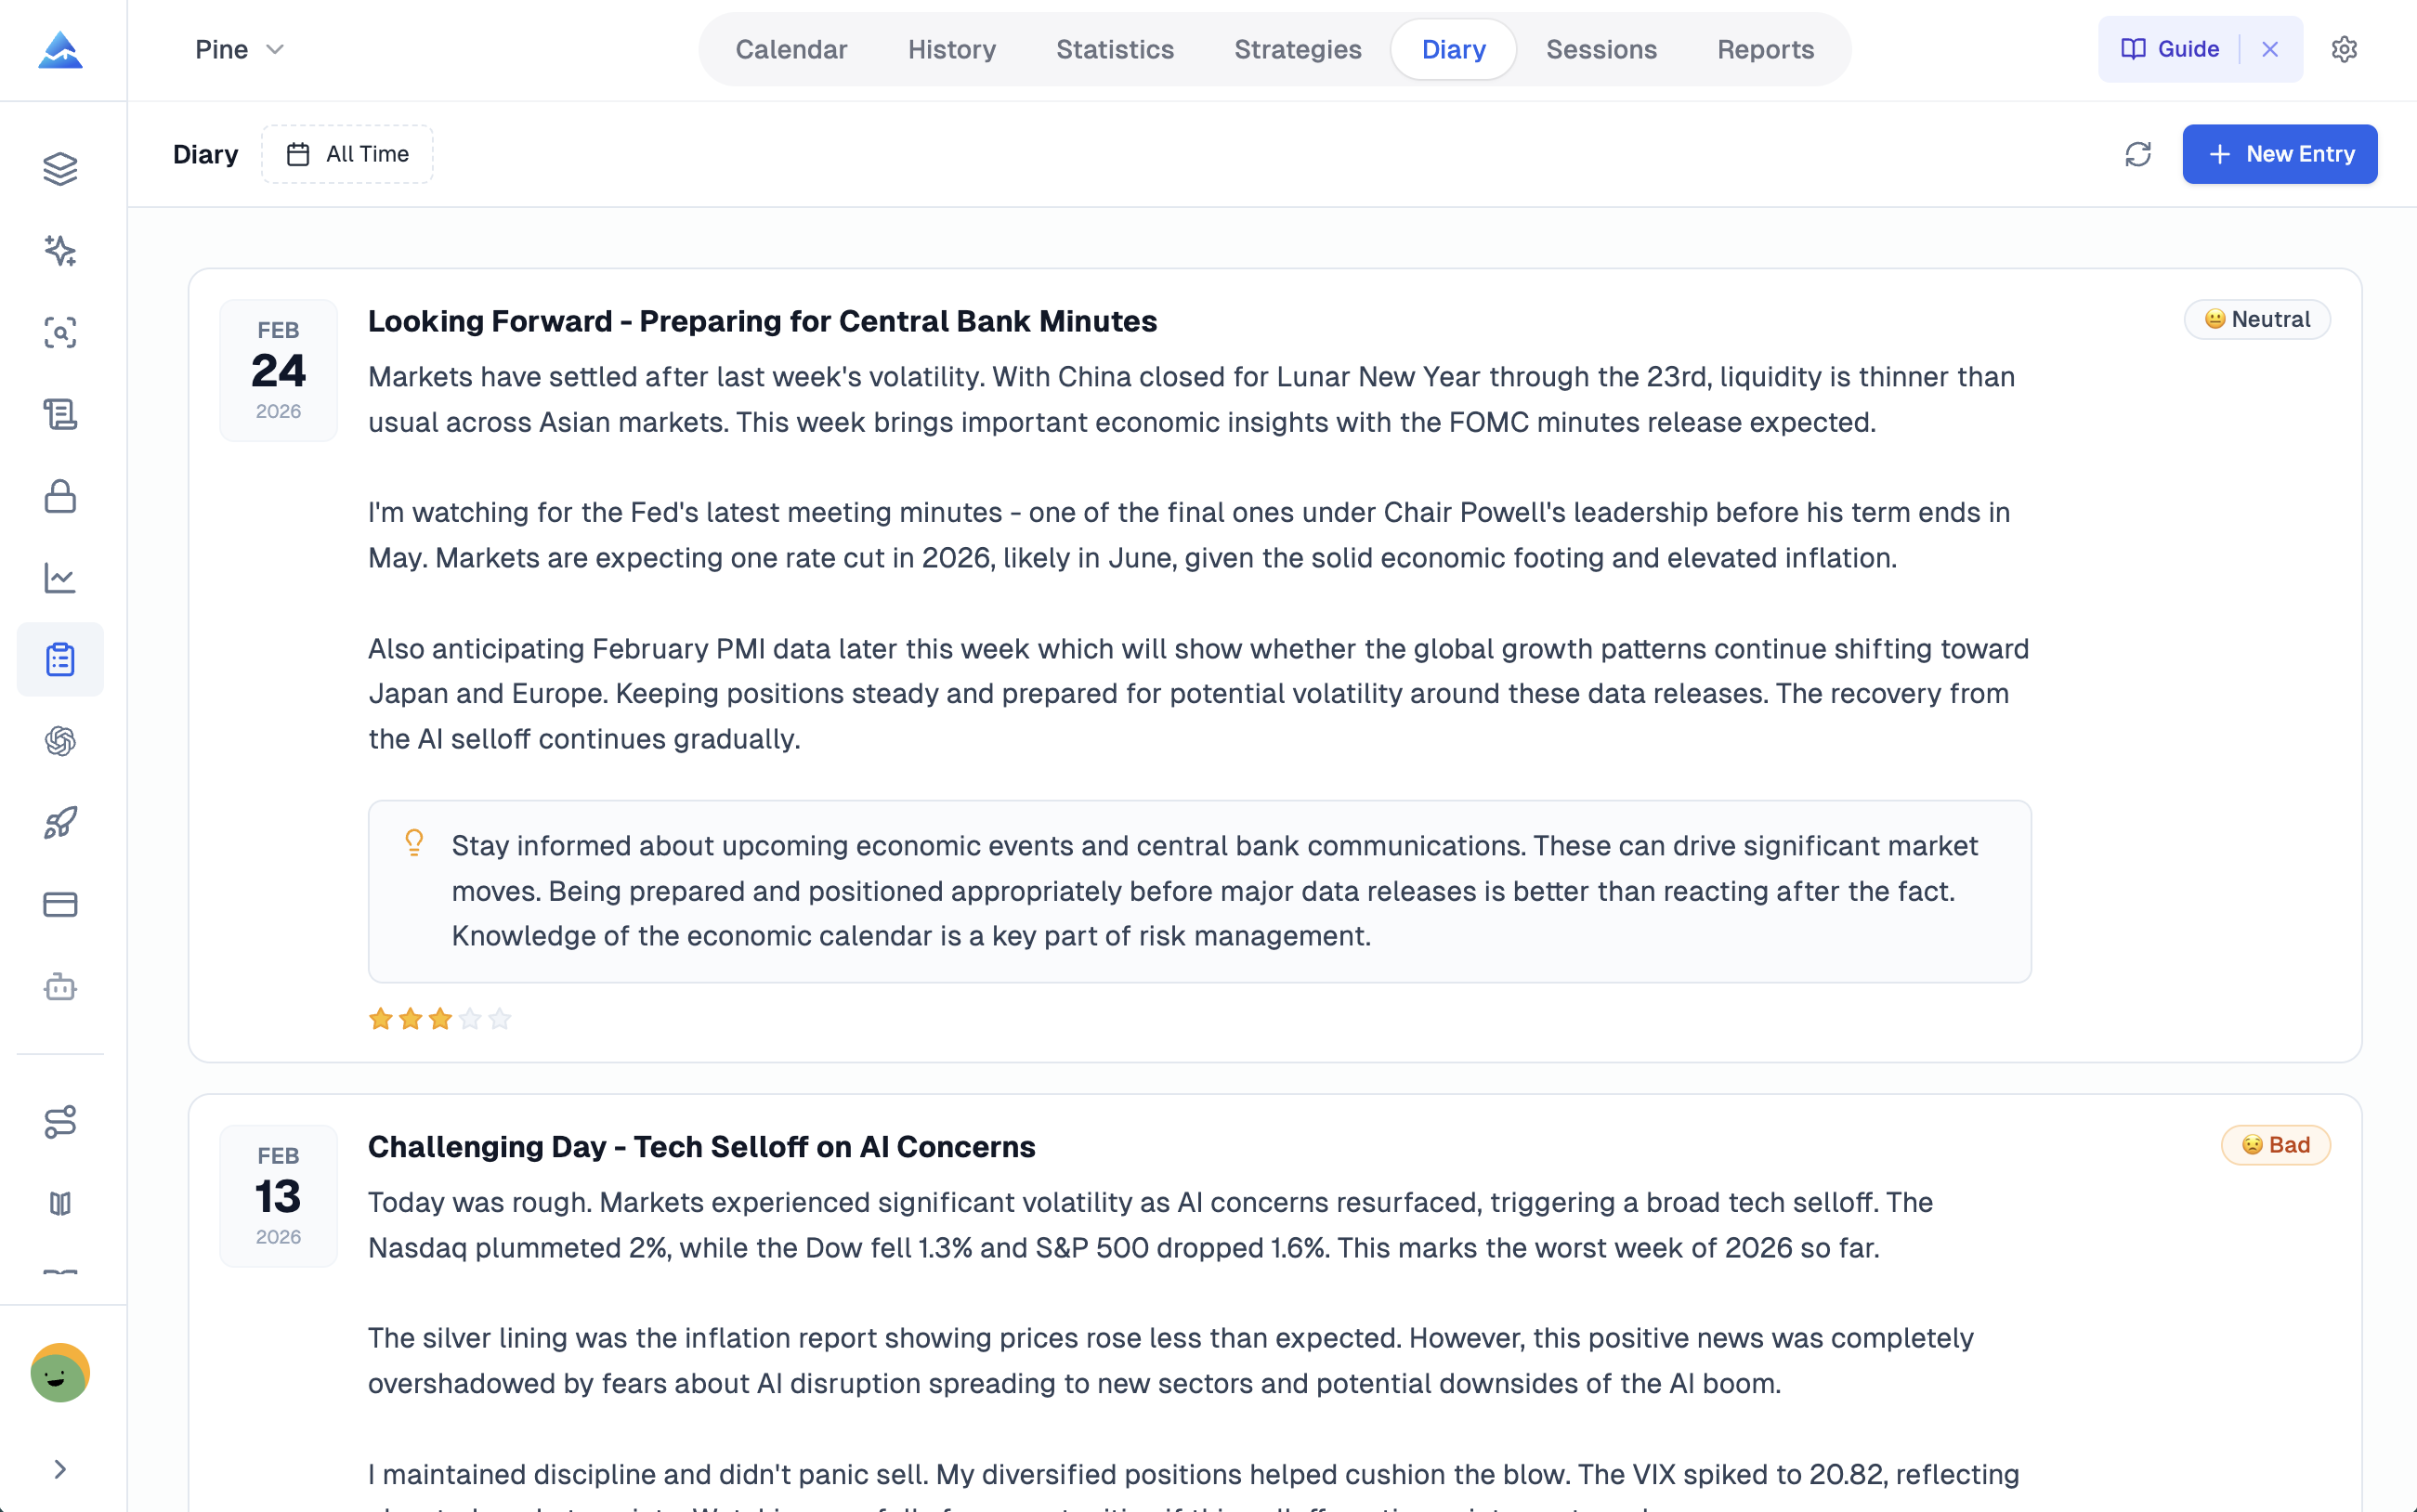
Diary stores the explanation around a trade, and Reports packages selected records into period or portfolio summaries. Together they connect the quantitative result with the decision process that produced it.
What belongs in a trade diary?
Use Diary for market observations, decision rationale, emotional state, and post-trade notes. Link a reflection to the relevant trade when possible, then review older entries for recurring process questions rather than treating a single note as proof of a pattern.
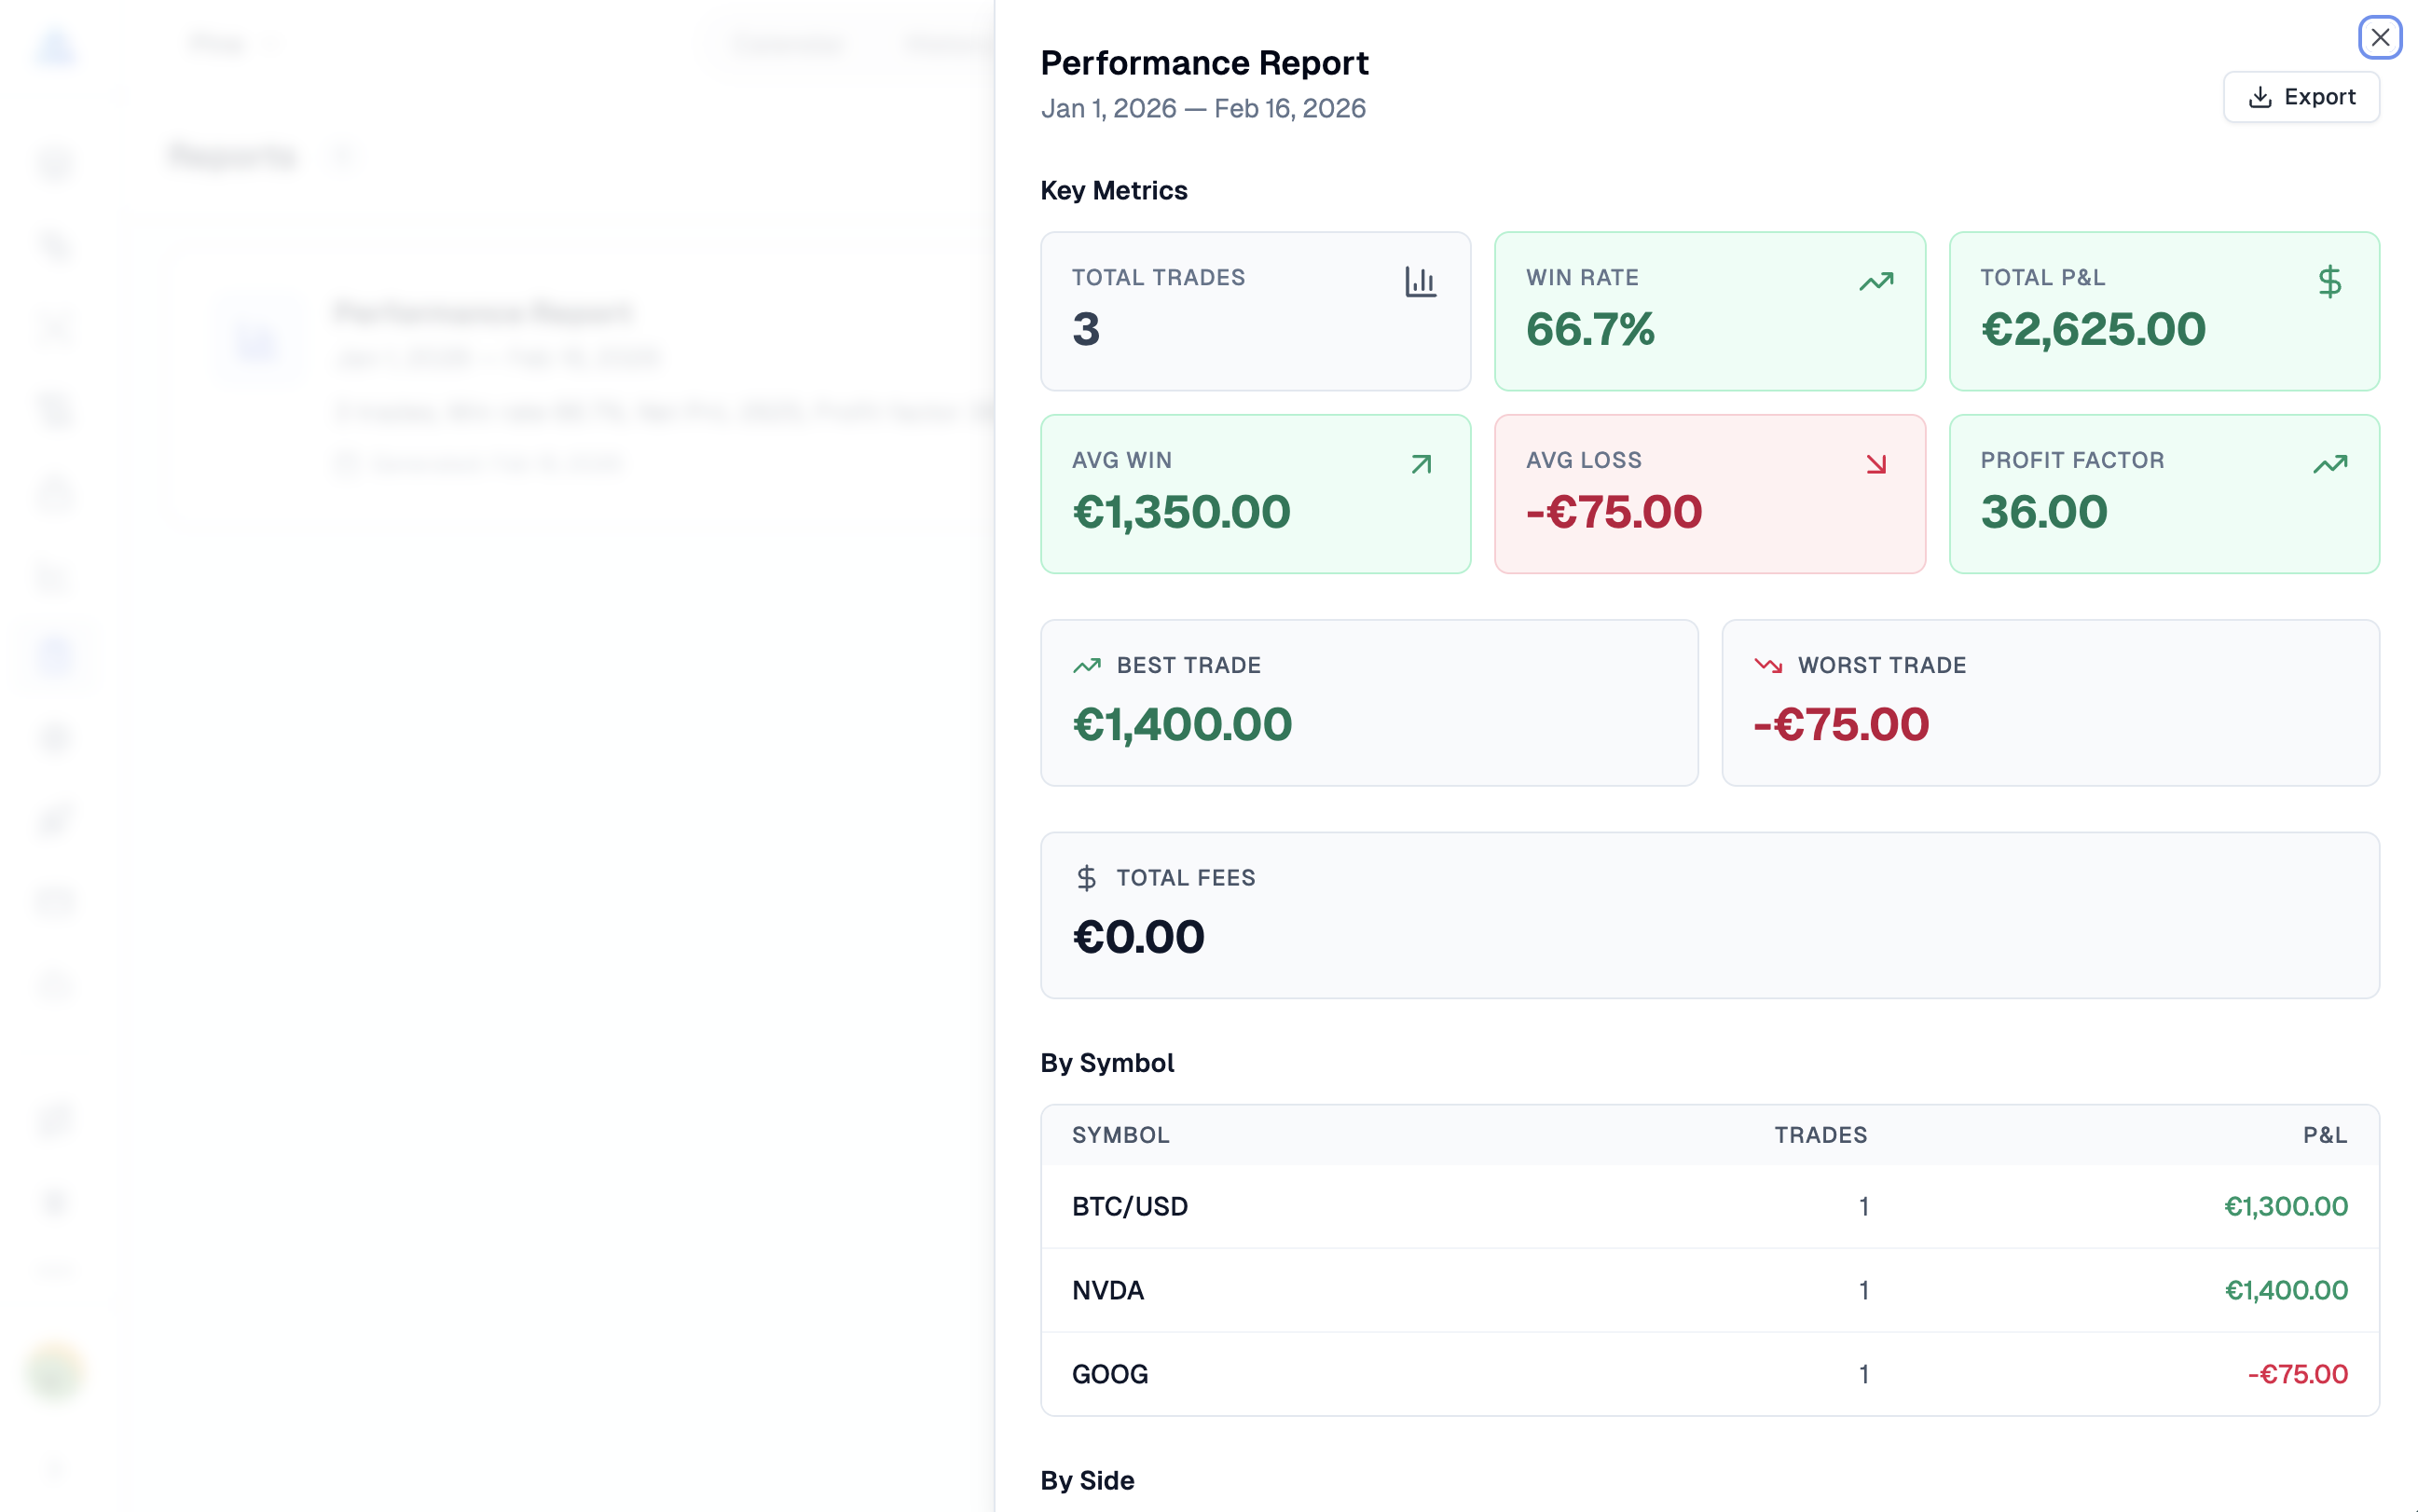
What do Reports contain?
Reports provide monthly or quarterly summaries, strategy-level breakdowns, and risk views such as drawdown periods and recovery time when those values can be calculated from the selected data. Export a report for record-keeping or further analysis, and keep the source filters with it so the summary remains interpretable.
What data should you enter for reliable review?
Enter the same fields consistently for every trade that you intend to compare. At minimum, check the symbol, direction, entry and exit prices, dates, position size, fees, timezone, order type, strategy label, and any setup or reflection notes available in the editor.
For deeper context, compare the journal with Backtest Deep Report when you are reviewing a TradingView Strategy Tester export, or use Strategy Optimizer to examine parameter-sweep results separately. Market context can be recorded alongside a decision after reviewing Market Insights or AI Chart Analysis, but those tools do not replace a complete journal record.
Access and interpretation limits
Creating and editing journal data currently requires an Advanced plan or higher. Check the in-app access message and pricing page for current entitlement details, because plan limits can change.
The journal organizes and calculates the data you provide; it does not remove execution, selection, look-ahead, regime-change, or record-keeping risk. A report can be internally consistent while still being incomplete if trades, fees, timezones, or setup labels are missing or inaccurate.
Trading Journal FAQ
Is Pineify a trade journal app or a spreadsheet replacement?
It is a browser-based trade journal app with views for individual records, dates, strategies, sessions, diary entries, statistics, and reports. It is useful when you want those views to use the same recorded trade data.
Can the journal record more than one asset type?
The editor supports records for stocks, options, crypto, forex, and futures. The fields available for a specific record should be checked in the current editor before importing or entering a large history.
Does a trading journal guarantee better trading results?
No. The journal records and organizes observations; it does not guarantee a return, identify a winning strategy, or validate that a result will repeat.
Why can the same statistic change after editing a trade?
Statistics are calculated from the selected records and their inputs. Editing a price, fee, timezone, date, position size, or filter changes the sample or its calculation, so review the underlying History record when a value changes.
Which Pineify plan is required for the Trading Journal?
Creating and editing journal data currently requires an Advanced plan or higher. Confirm the latest entitlement in the app and on the pricing page before relying on a plan-specific workflow.
TradingView Premium Scripts
Explore TradingView premium scripts with source code, premium Pine Script indicators, tutorials, and checks for repainting and backtest behavior.
TradingView Backtest Report
Analyze a TradingView backtest report from Strategy Tester CSV with 16+ KPIs, nine tabs, 1,000-run Monte Carlo, AI analysis, and Excel export.