

AI Stock Picker
Learn how Pineify's AI stock picker ranks stocks with daily 1-10 scores, fundamentals, charts, news, and options analysis. Review evidence before investing.
An AI stock picker is a research tool that ranks stocks using a repeatable set of market inputs. Pineify's AI Stocks & Options Picker scans thousands of stocks daily, combining fundamentals, technical signals, sentiment, analyst consensus, financial statements, charts, news, and options data into a daily 1-10 score. Use that ranking to build a shortlist, then check the underlying evidence before making any trade decision.
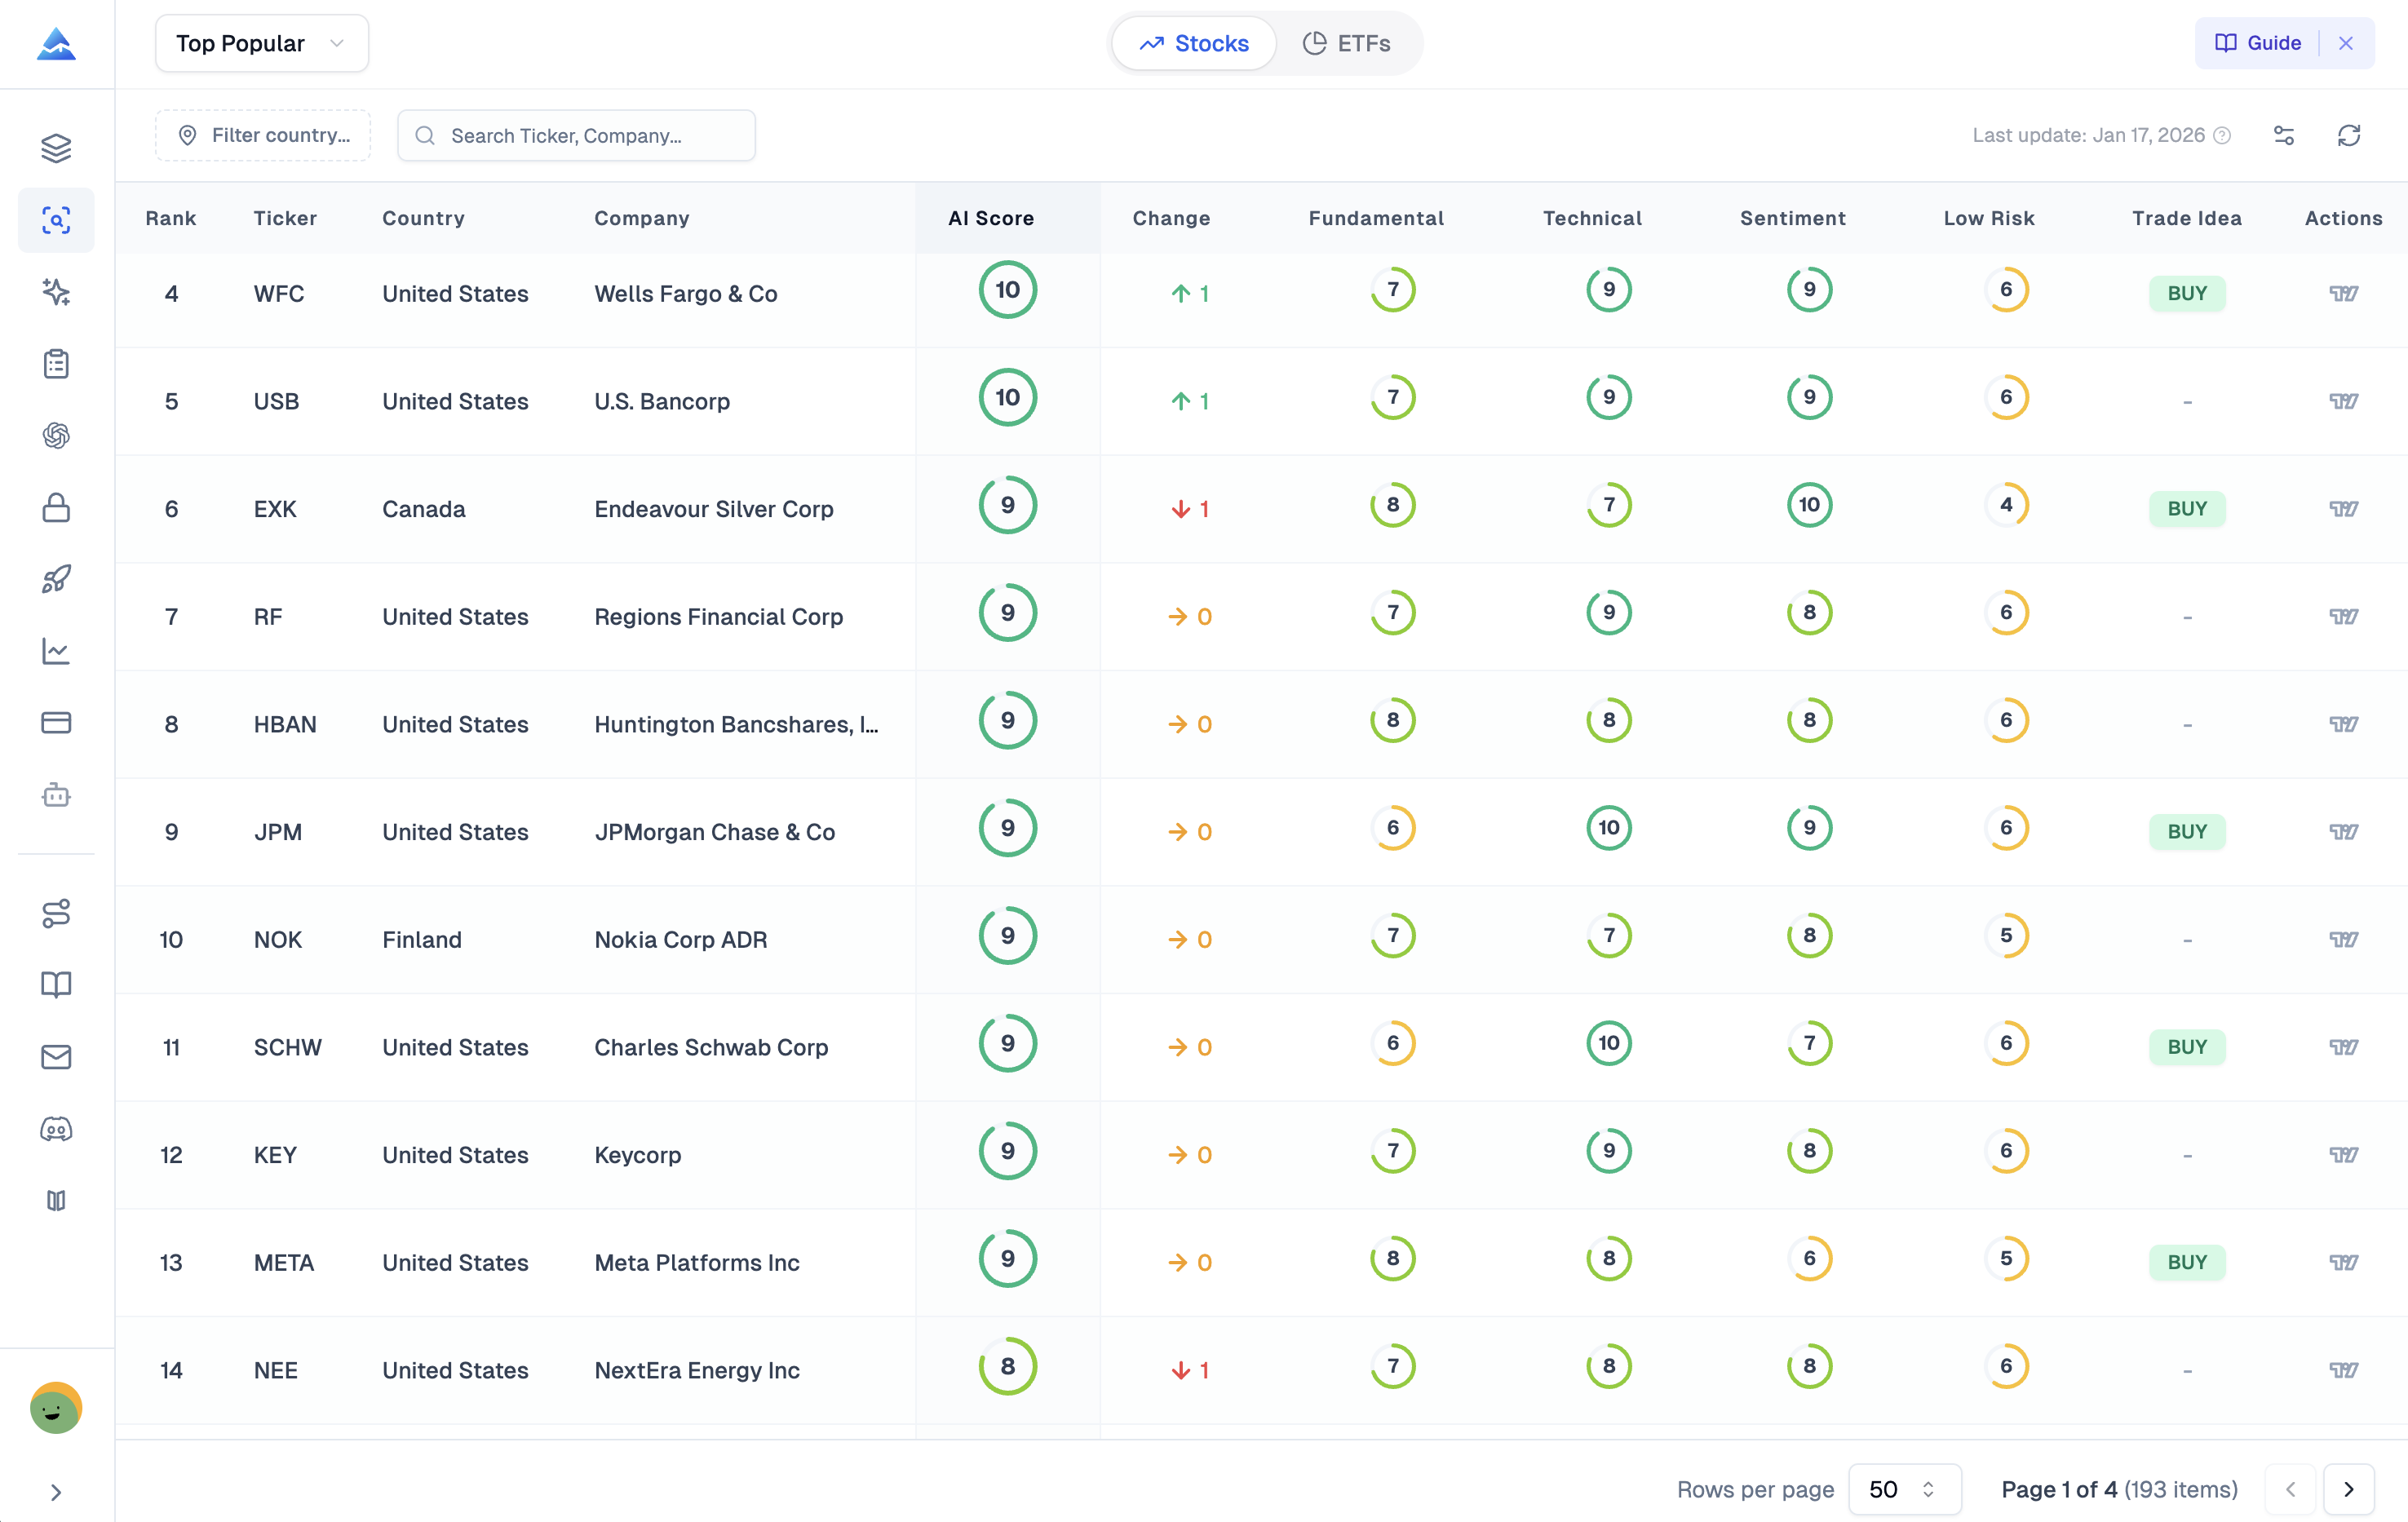
How do you use the AI stock picker?
Pineify turns a market scan into a research workflow: start with a ranked list, open the ticker detail view, and validate the score with financial, technical, sentiment, and options evidence.
- Open the AI Stocks & Options Picker.
- Choose a curated list such as Top Popular, Top Dividend, or Top Growth, or search for a ticker.
- Review the 1-10 score, market overview, financial statements, analyst consensus, news sentiment, and options data.
- Compare the evidence across several candidates. Use AI Chart Analysis for a chart review, or continue company research with the AI Finance Agent.
Full access to the AI Stocks & Options Picker starts with the Advanced plan and is also included in Expert and Ultimate. Accounts below Advanced can see an upgrade prompt or masked search and detail fields. Check the pricing page for access and plan limits.
What does Pineify's stock ranking tool analyze?
The stock ranking tool combines multiple evidence types. Its daily 1-10 score prioritizes research but does not replace it.
| Signal group | What you can review | Research question |
|---|---|---|
| Fundamentals | Income statement, balance sheet, cash flow, 10+ years of historical data, margins, growth, Altman Z-Score, and Piotroski F-Score | Is the business financially healthy? |
| Technical context | TradingView charts, indicators, drawing tools, and multiple timeframes | What is price action doing across timeframes? |
| Sentiment and consensus | News sentiment, analyst Buy, Hold, and Sell distribution, and price targets | What expectations are already reflected in the market? |
| Options analysis | Bid and ask, last trade, Greeks, implied volatility, open interest, put/call ratios, max pain, and expected move | What does the listed-options market imply about risk and positioning? |
What can you inspect after a stock is ranked?
Each ticker opens a research view that connects market context, options analysis, company financials, and recent events.
Can you review charts and market context?
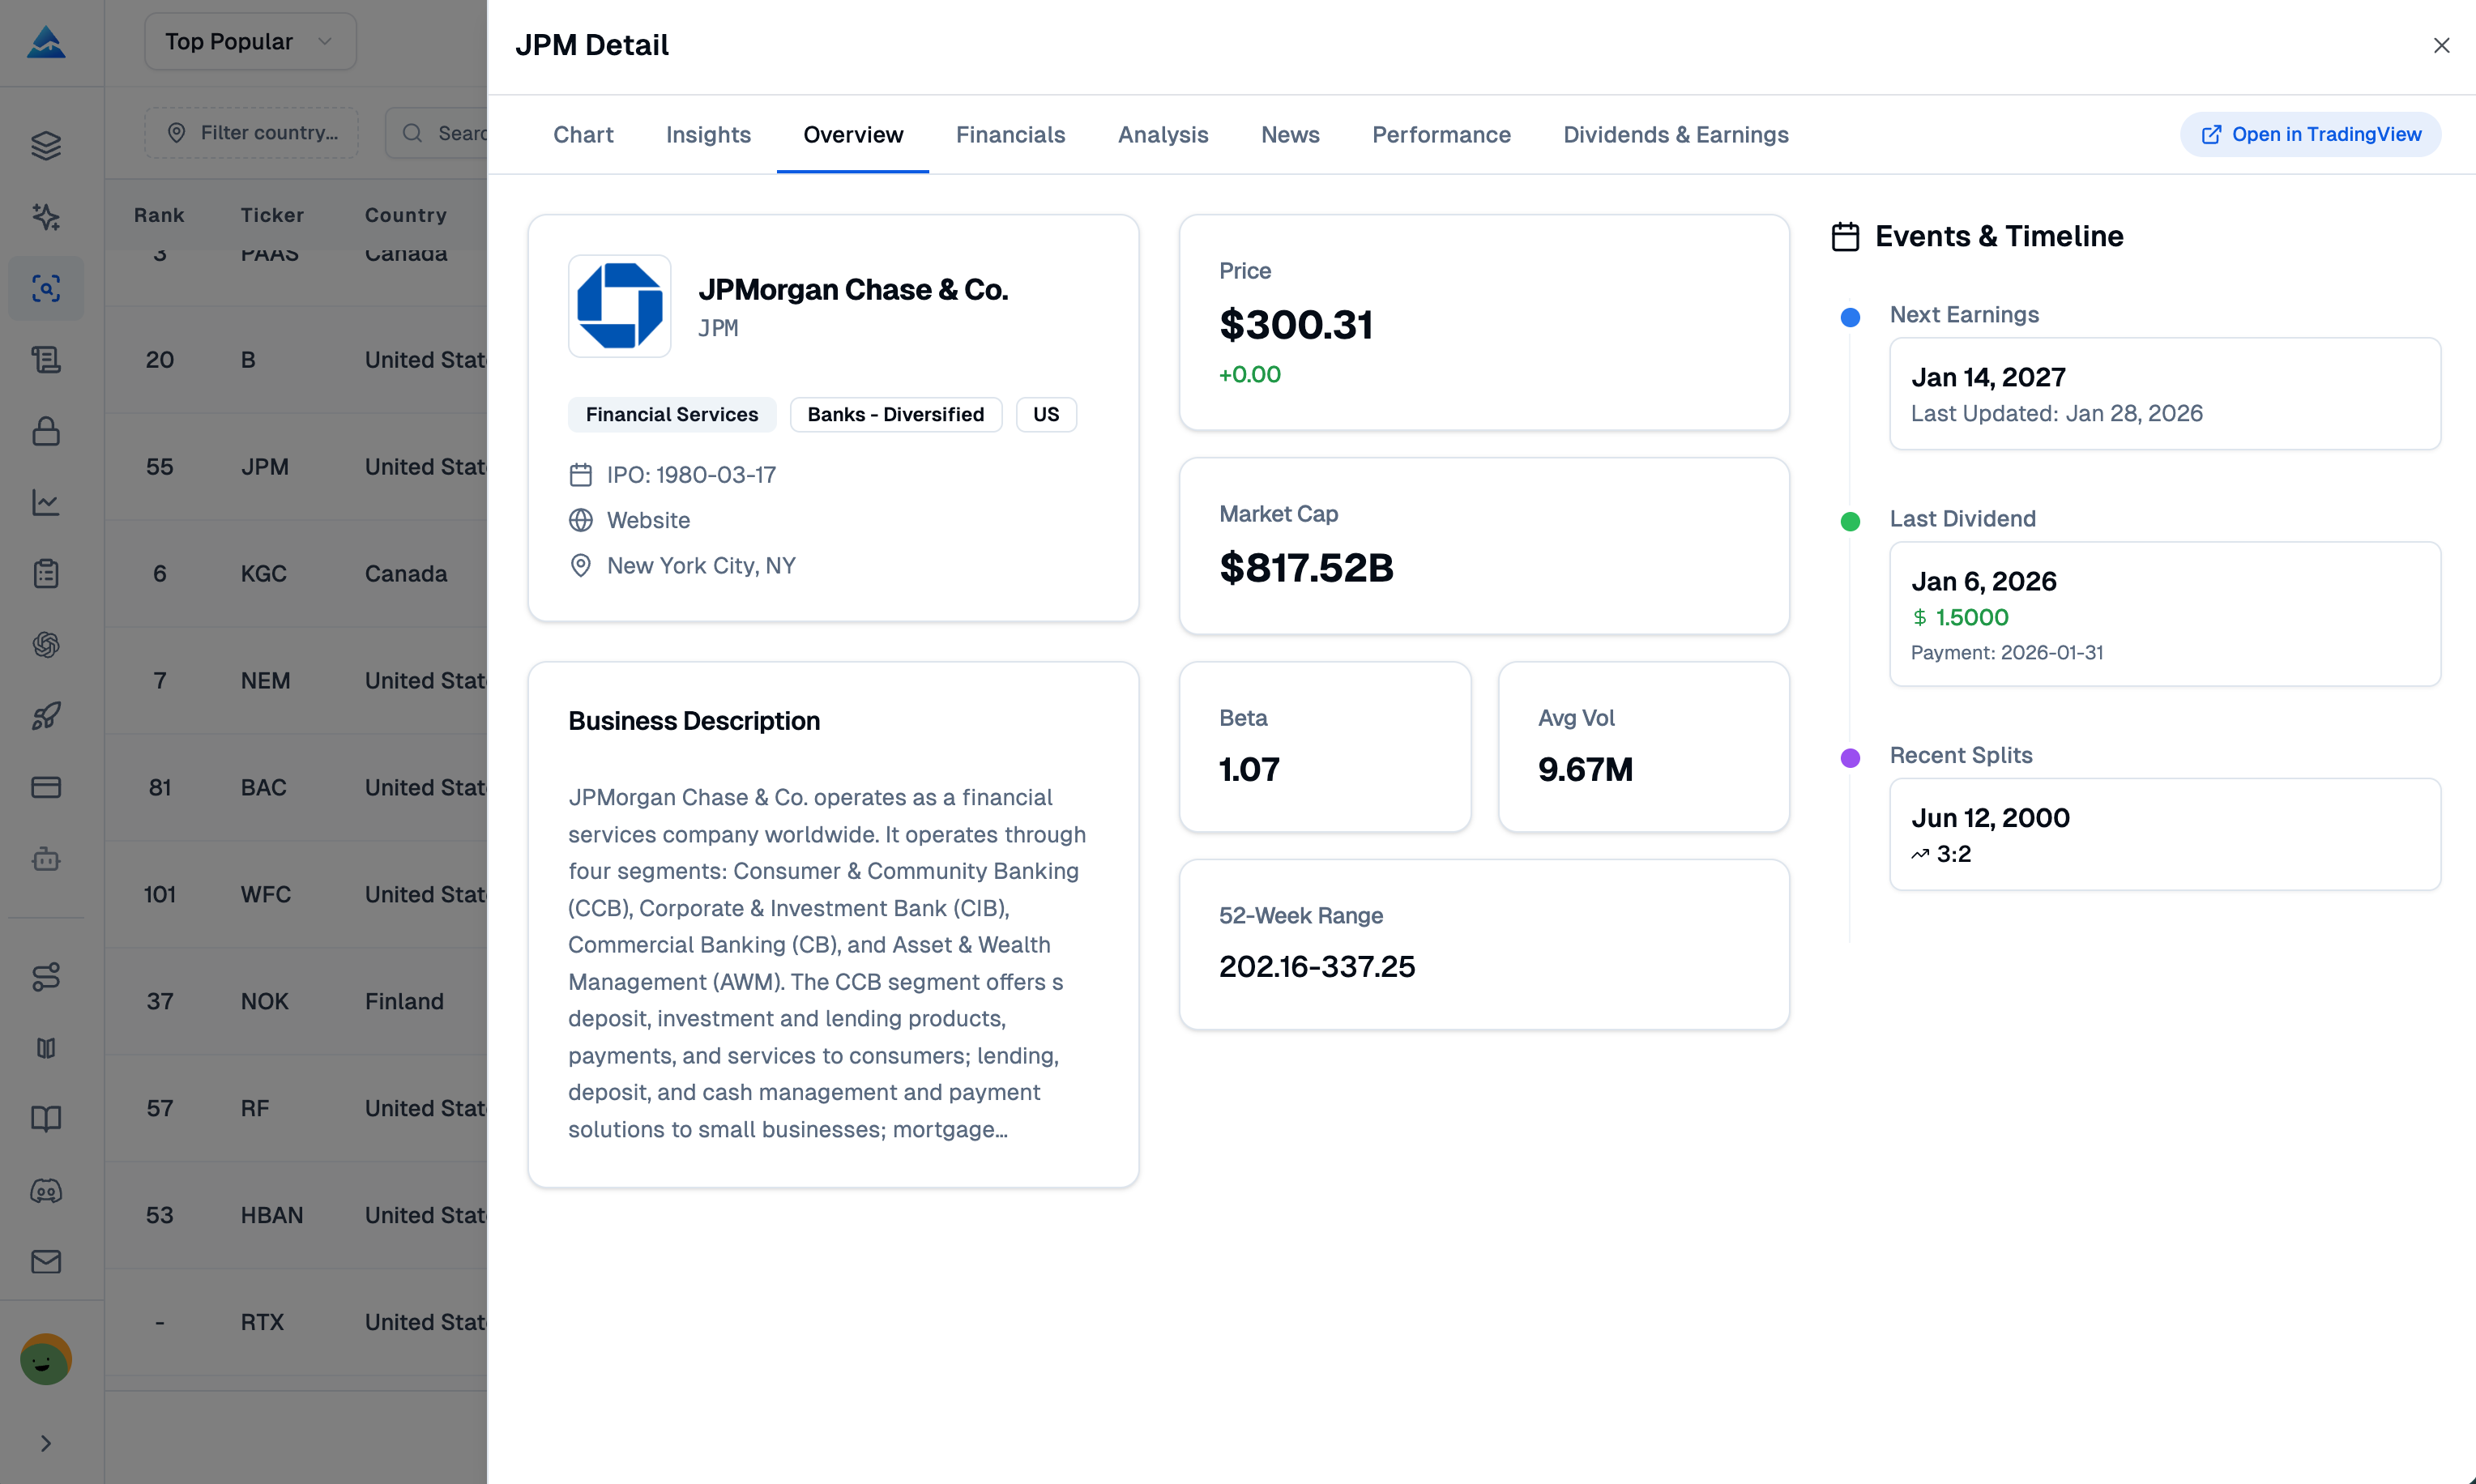
Yes. The workflow includes TradingView charting and a market overview so you can understand the ticker before reading the score as a ranking signal.
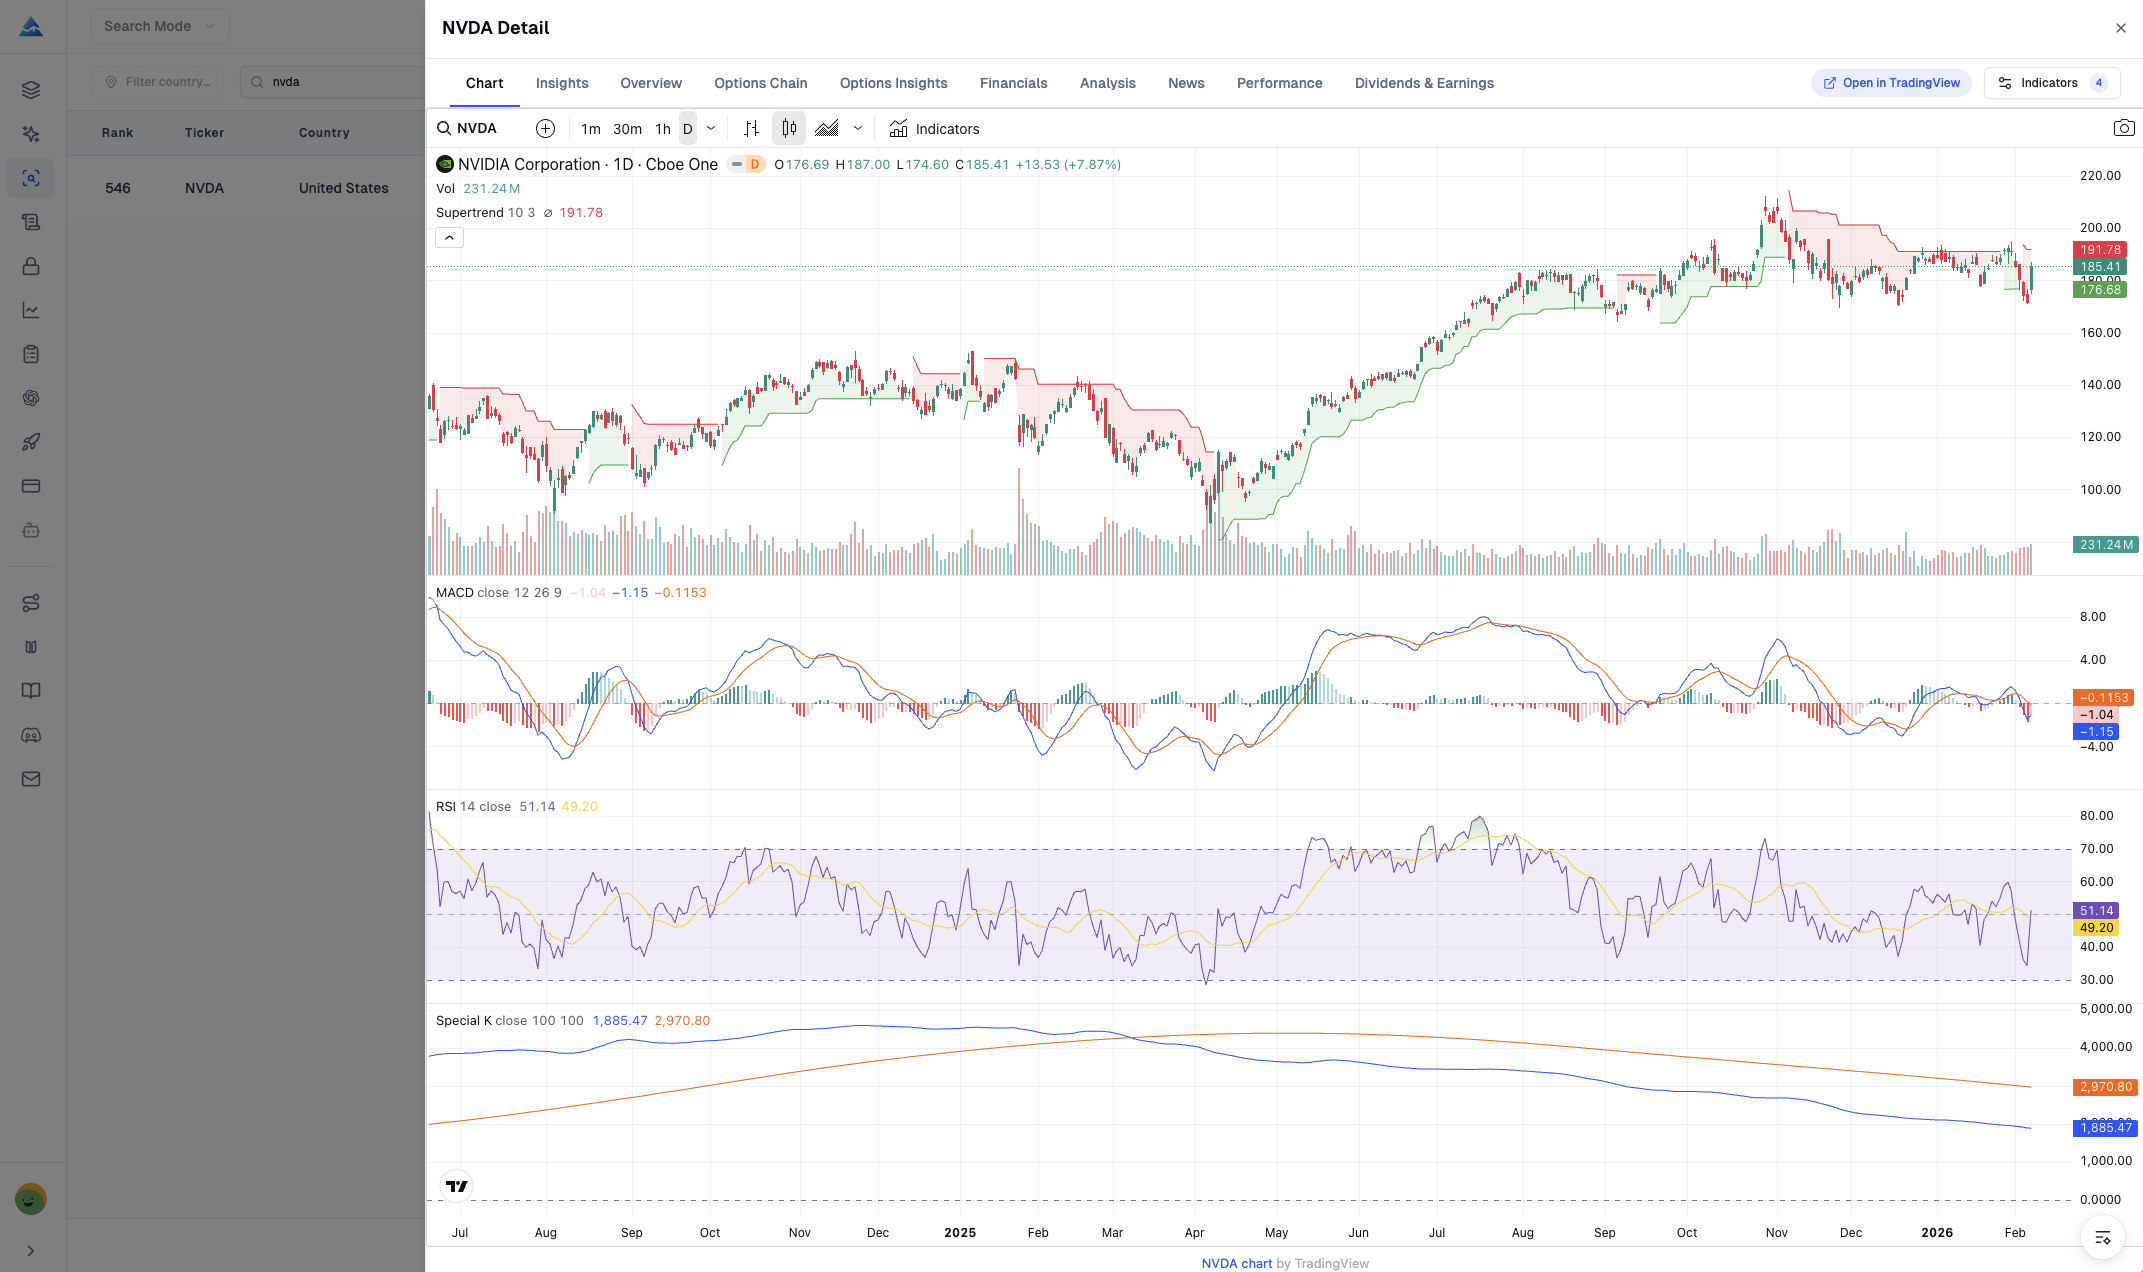
- Use indicators and drawing tools to mark trend, support, and resistance context.
- Switch between intraday and higher timeframes when the chart supports it.
- Check company profile, sector, industry, market cap, volume, float, 52-week range, and upcoming events in the overview.
What is included in the options analysis?
The options view supports contract-level research. Compare expirations and strikes instead of inferring options risk from the stock score alone.
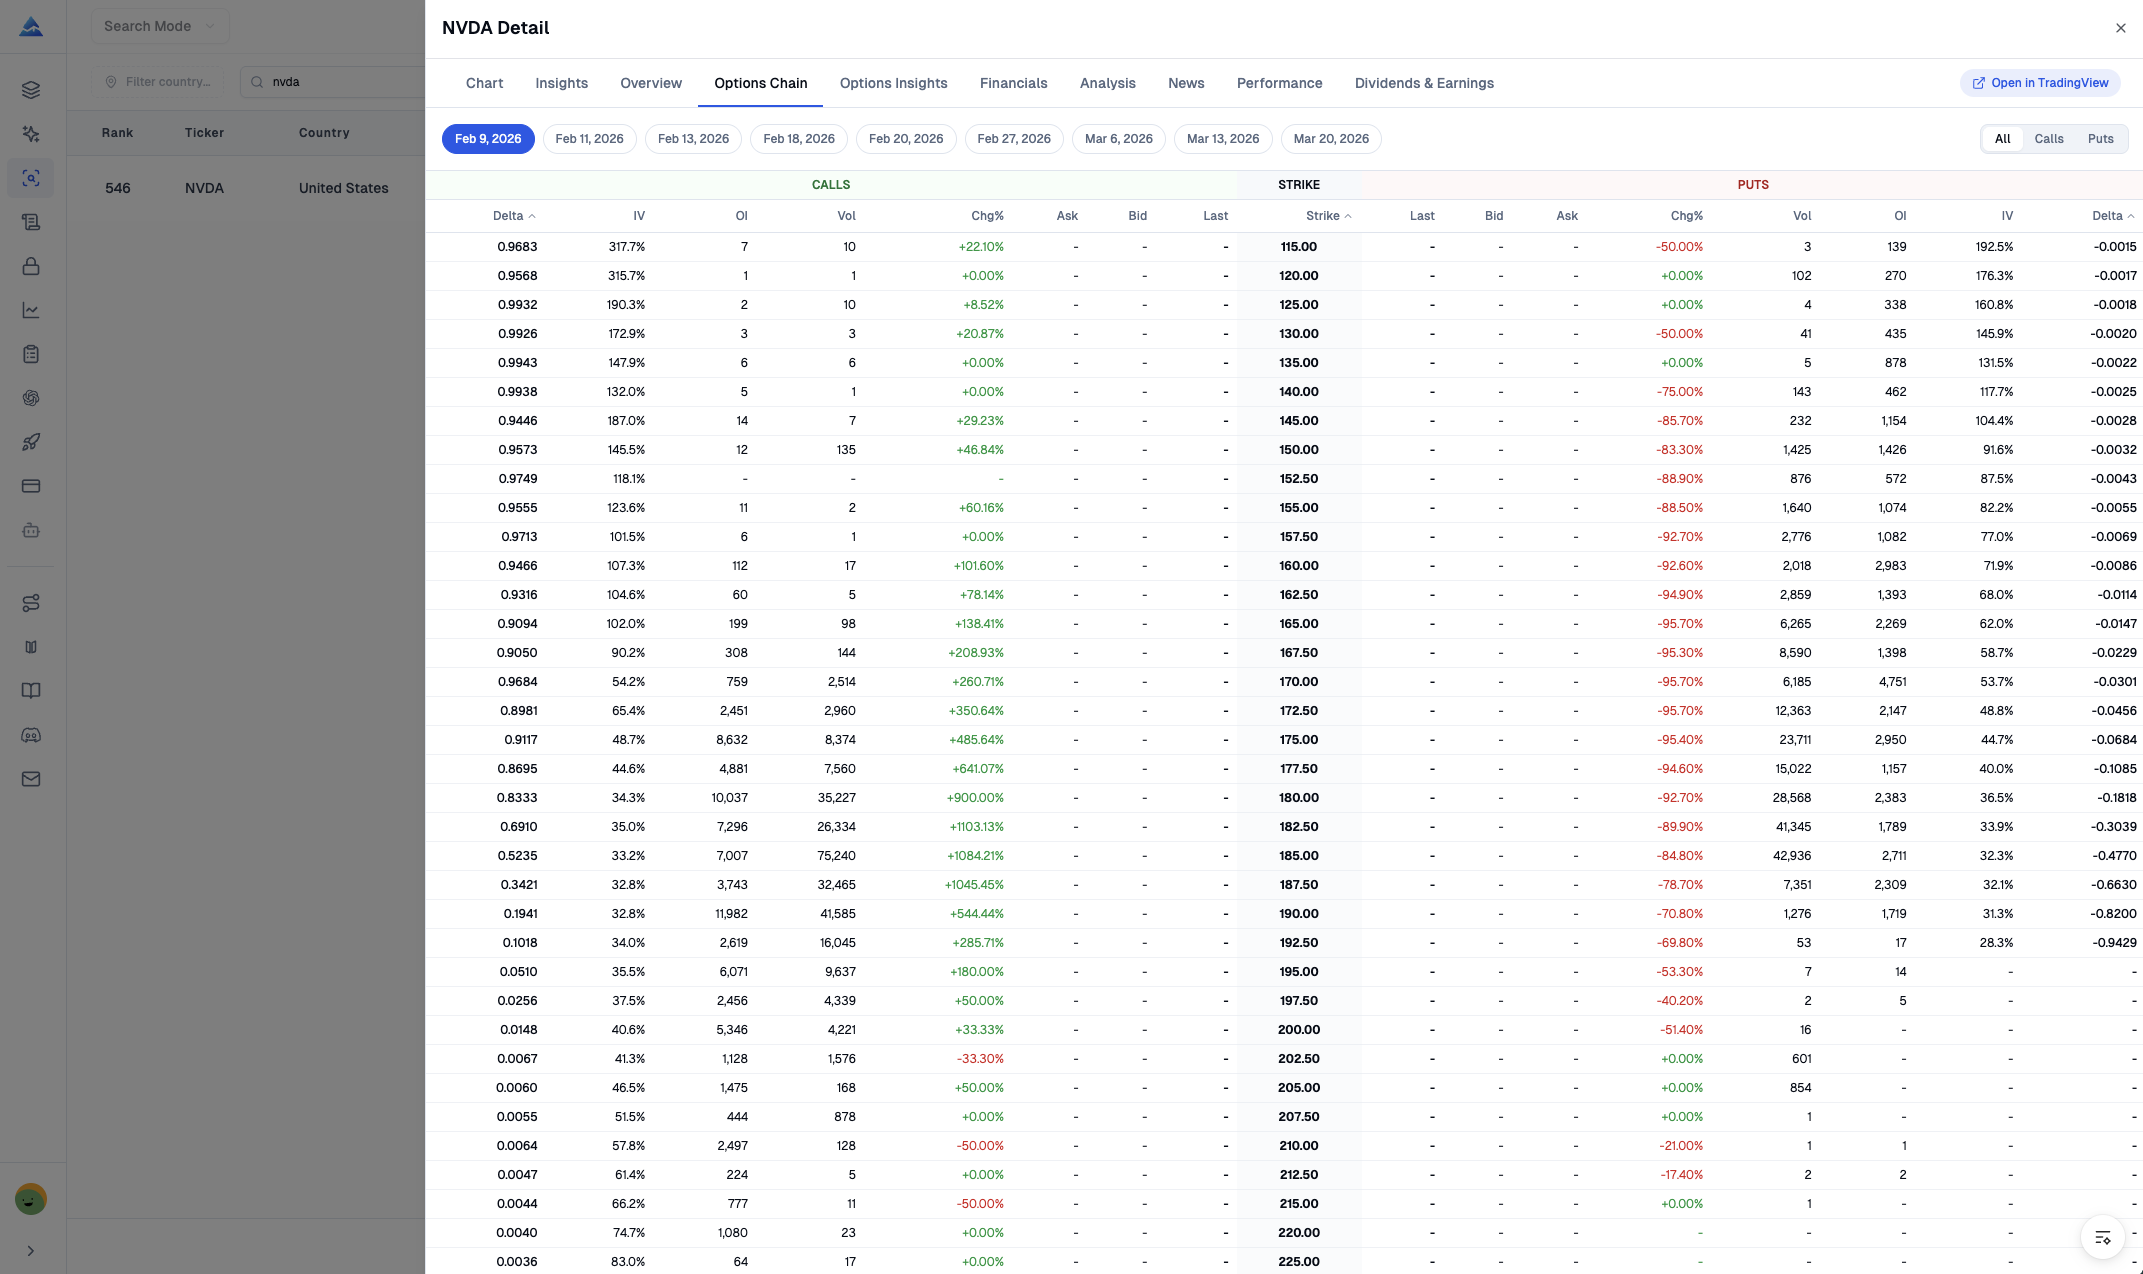
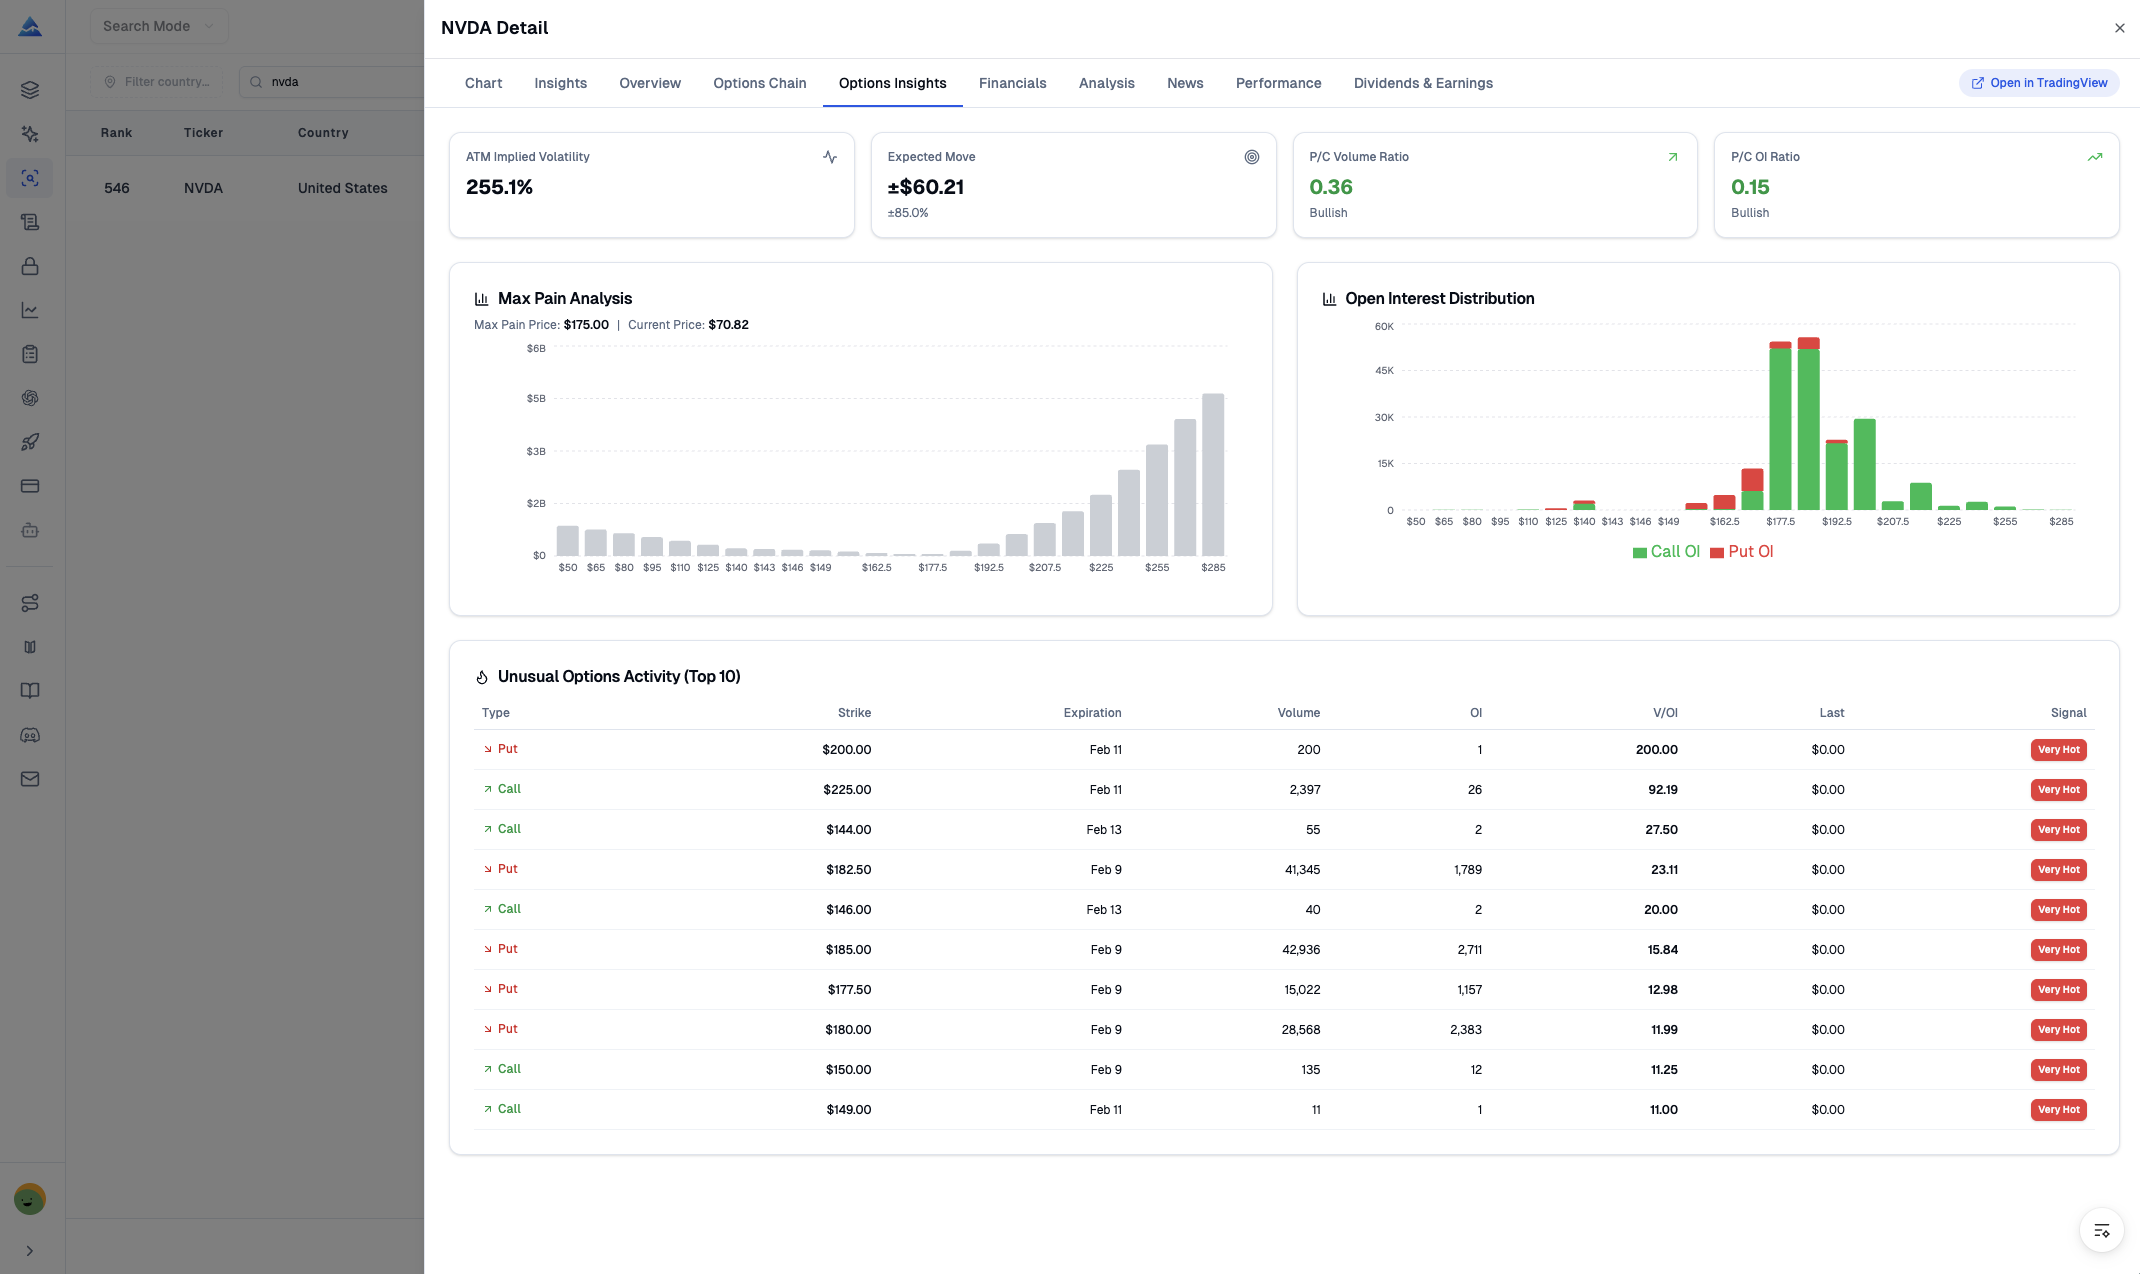
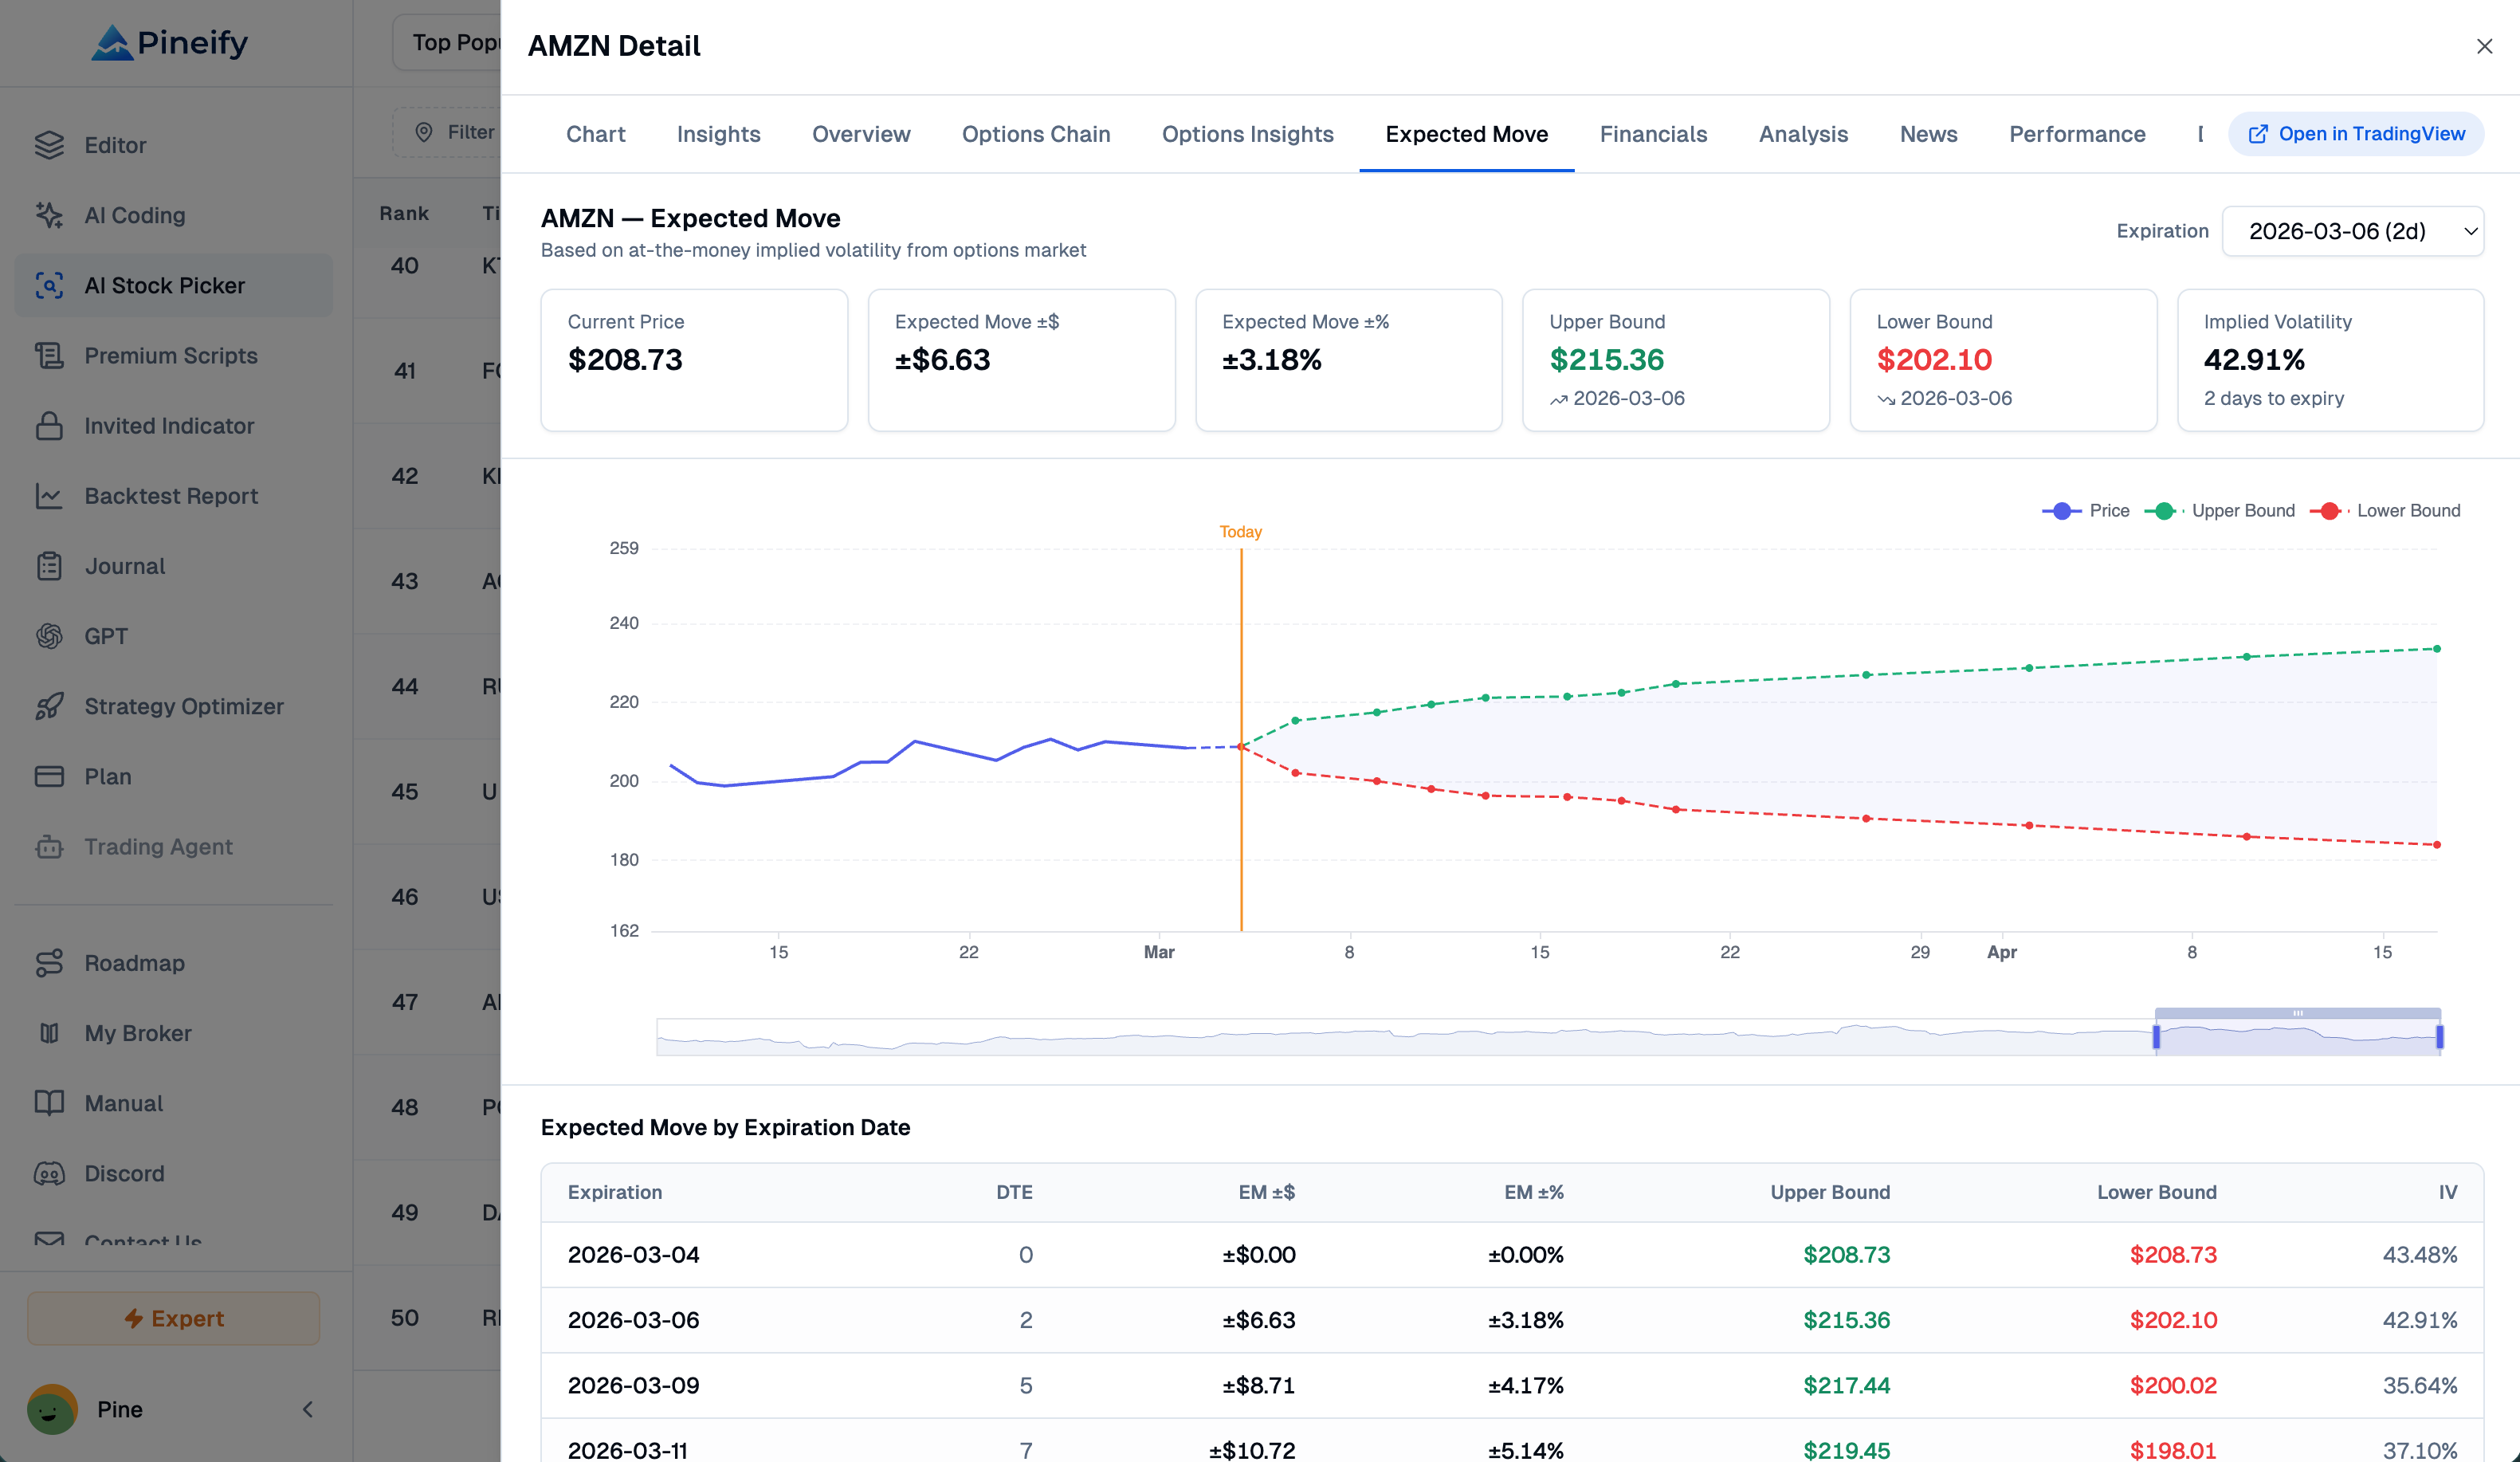
- Compare calls and puts with real-time bid and ask, last trade, Delta, Gamma, Theta, Vega, implied volatility, and open interest data.
- Review max pain, unusual options activity, put/call ratios, and open-interest context.
- Check the implied-volatility expected move for each expiration. An expected range is a market-implied estimate, not a guaranteed price path.
How deep are the financial and consensus views?
The picker keeps company research beside the ranking. This makes it possible to test whether a high or low score is supported by the business data and by the analyst view.
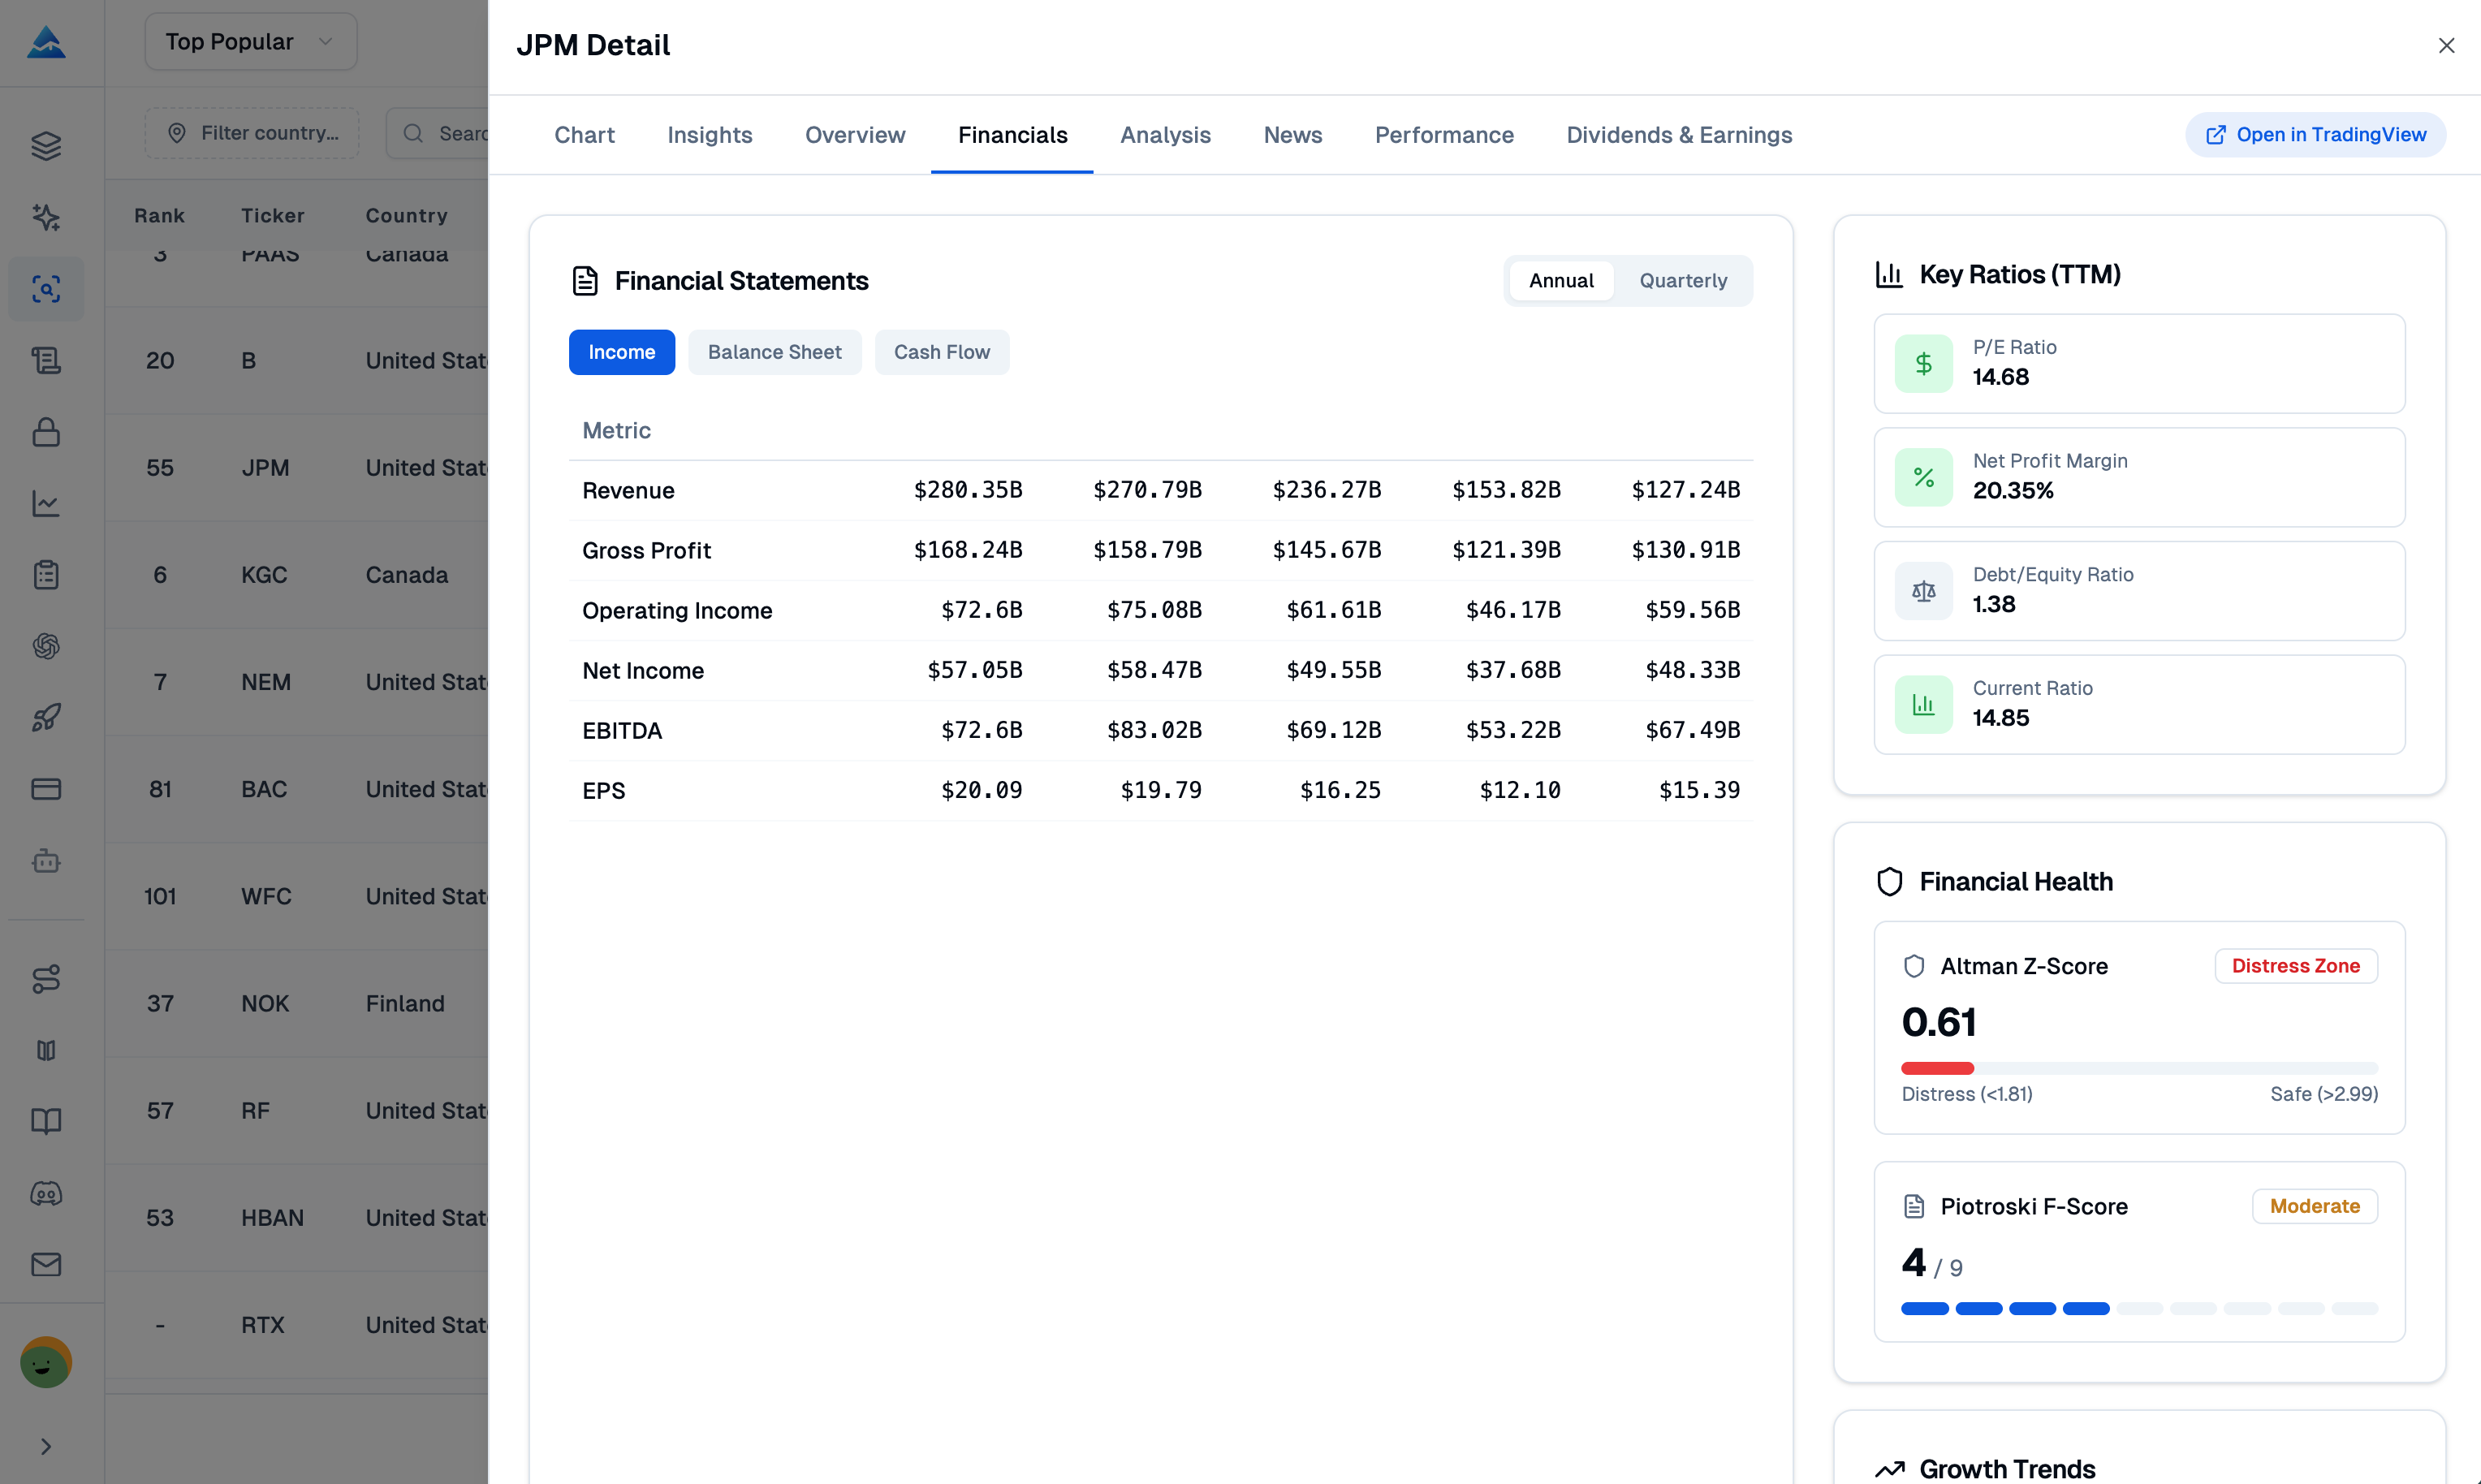
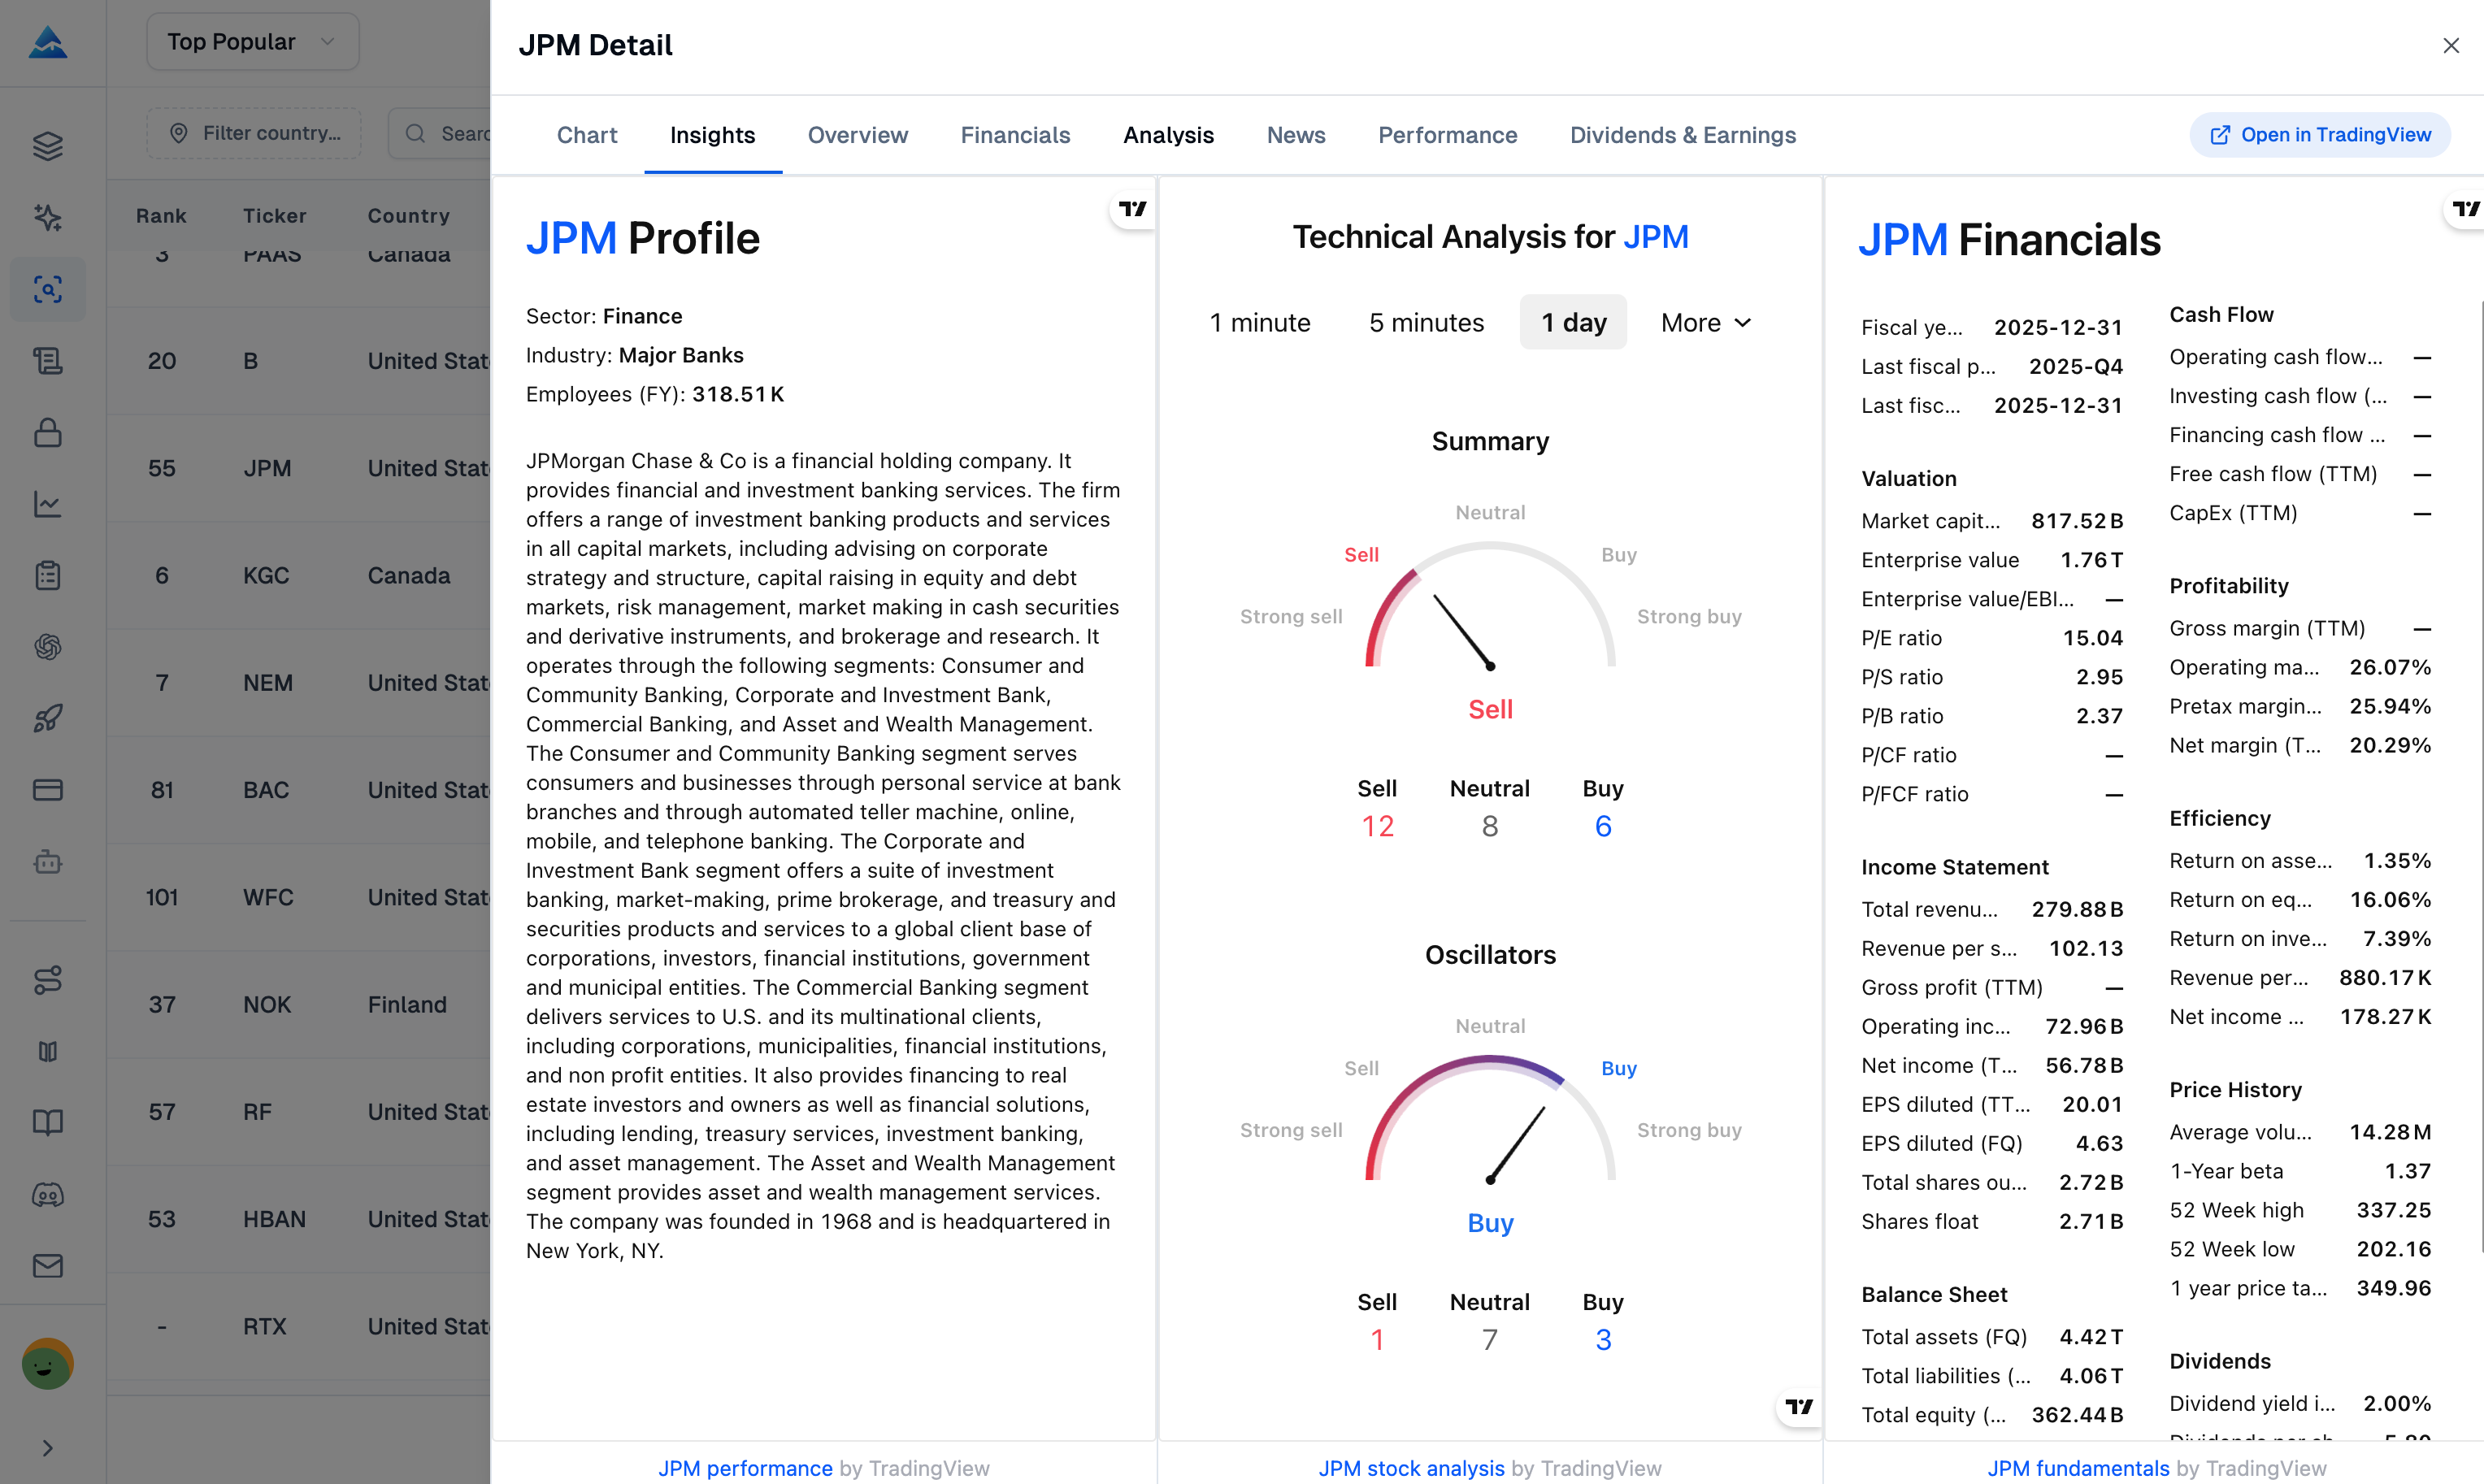
- Inspect income statements, balance sheets, cash flow, financial data, revenue growth, profit margins, and efficiency ratios.
- Compare analyst Buy, Hold, and Sell distribution, price target low, average, and high, valuation metrics, and rating changes.
Can you track performance, events, and news?
Yes. The panels provide context around historical performance, shareholder events, and the news that may change a research thesis.
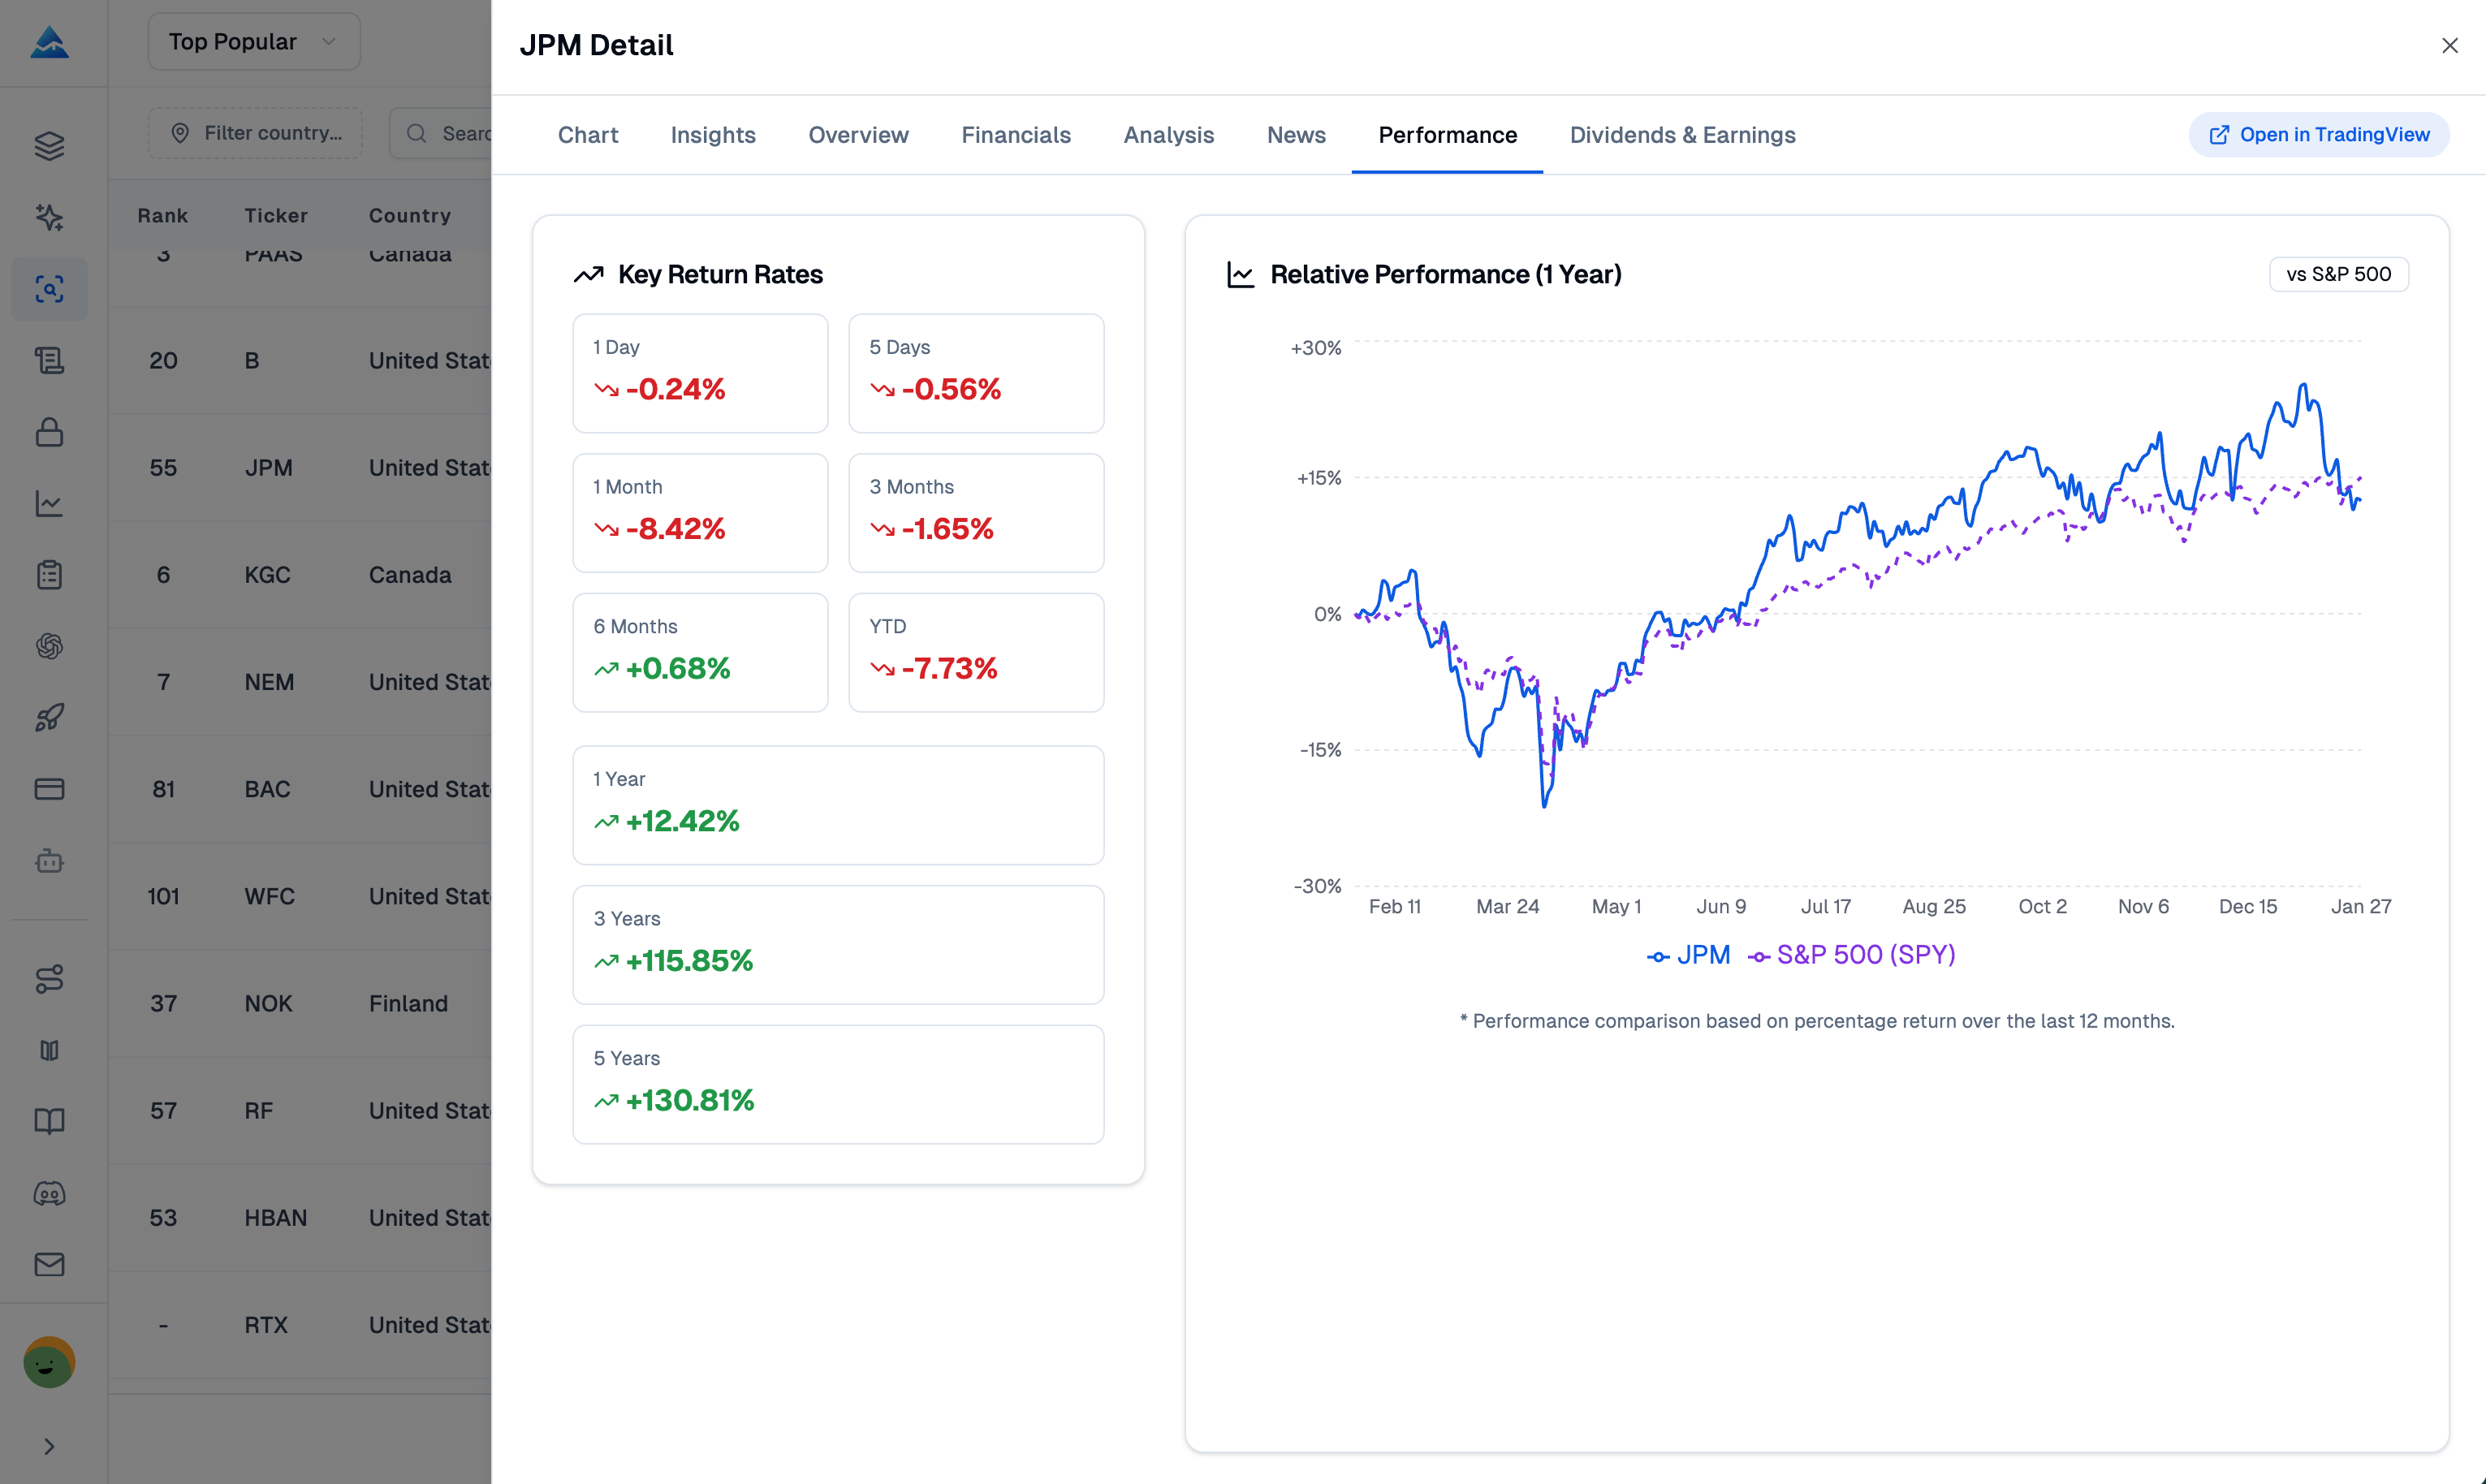
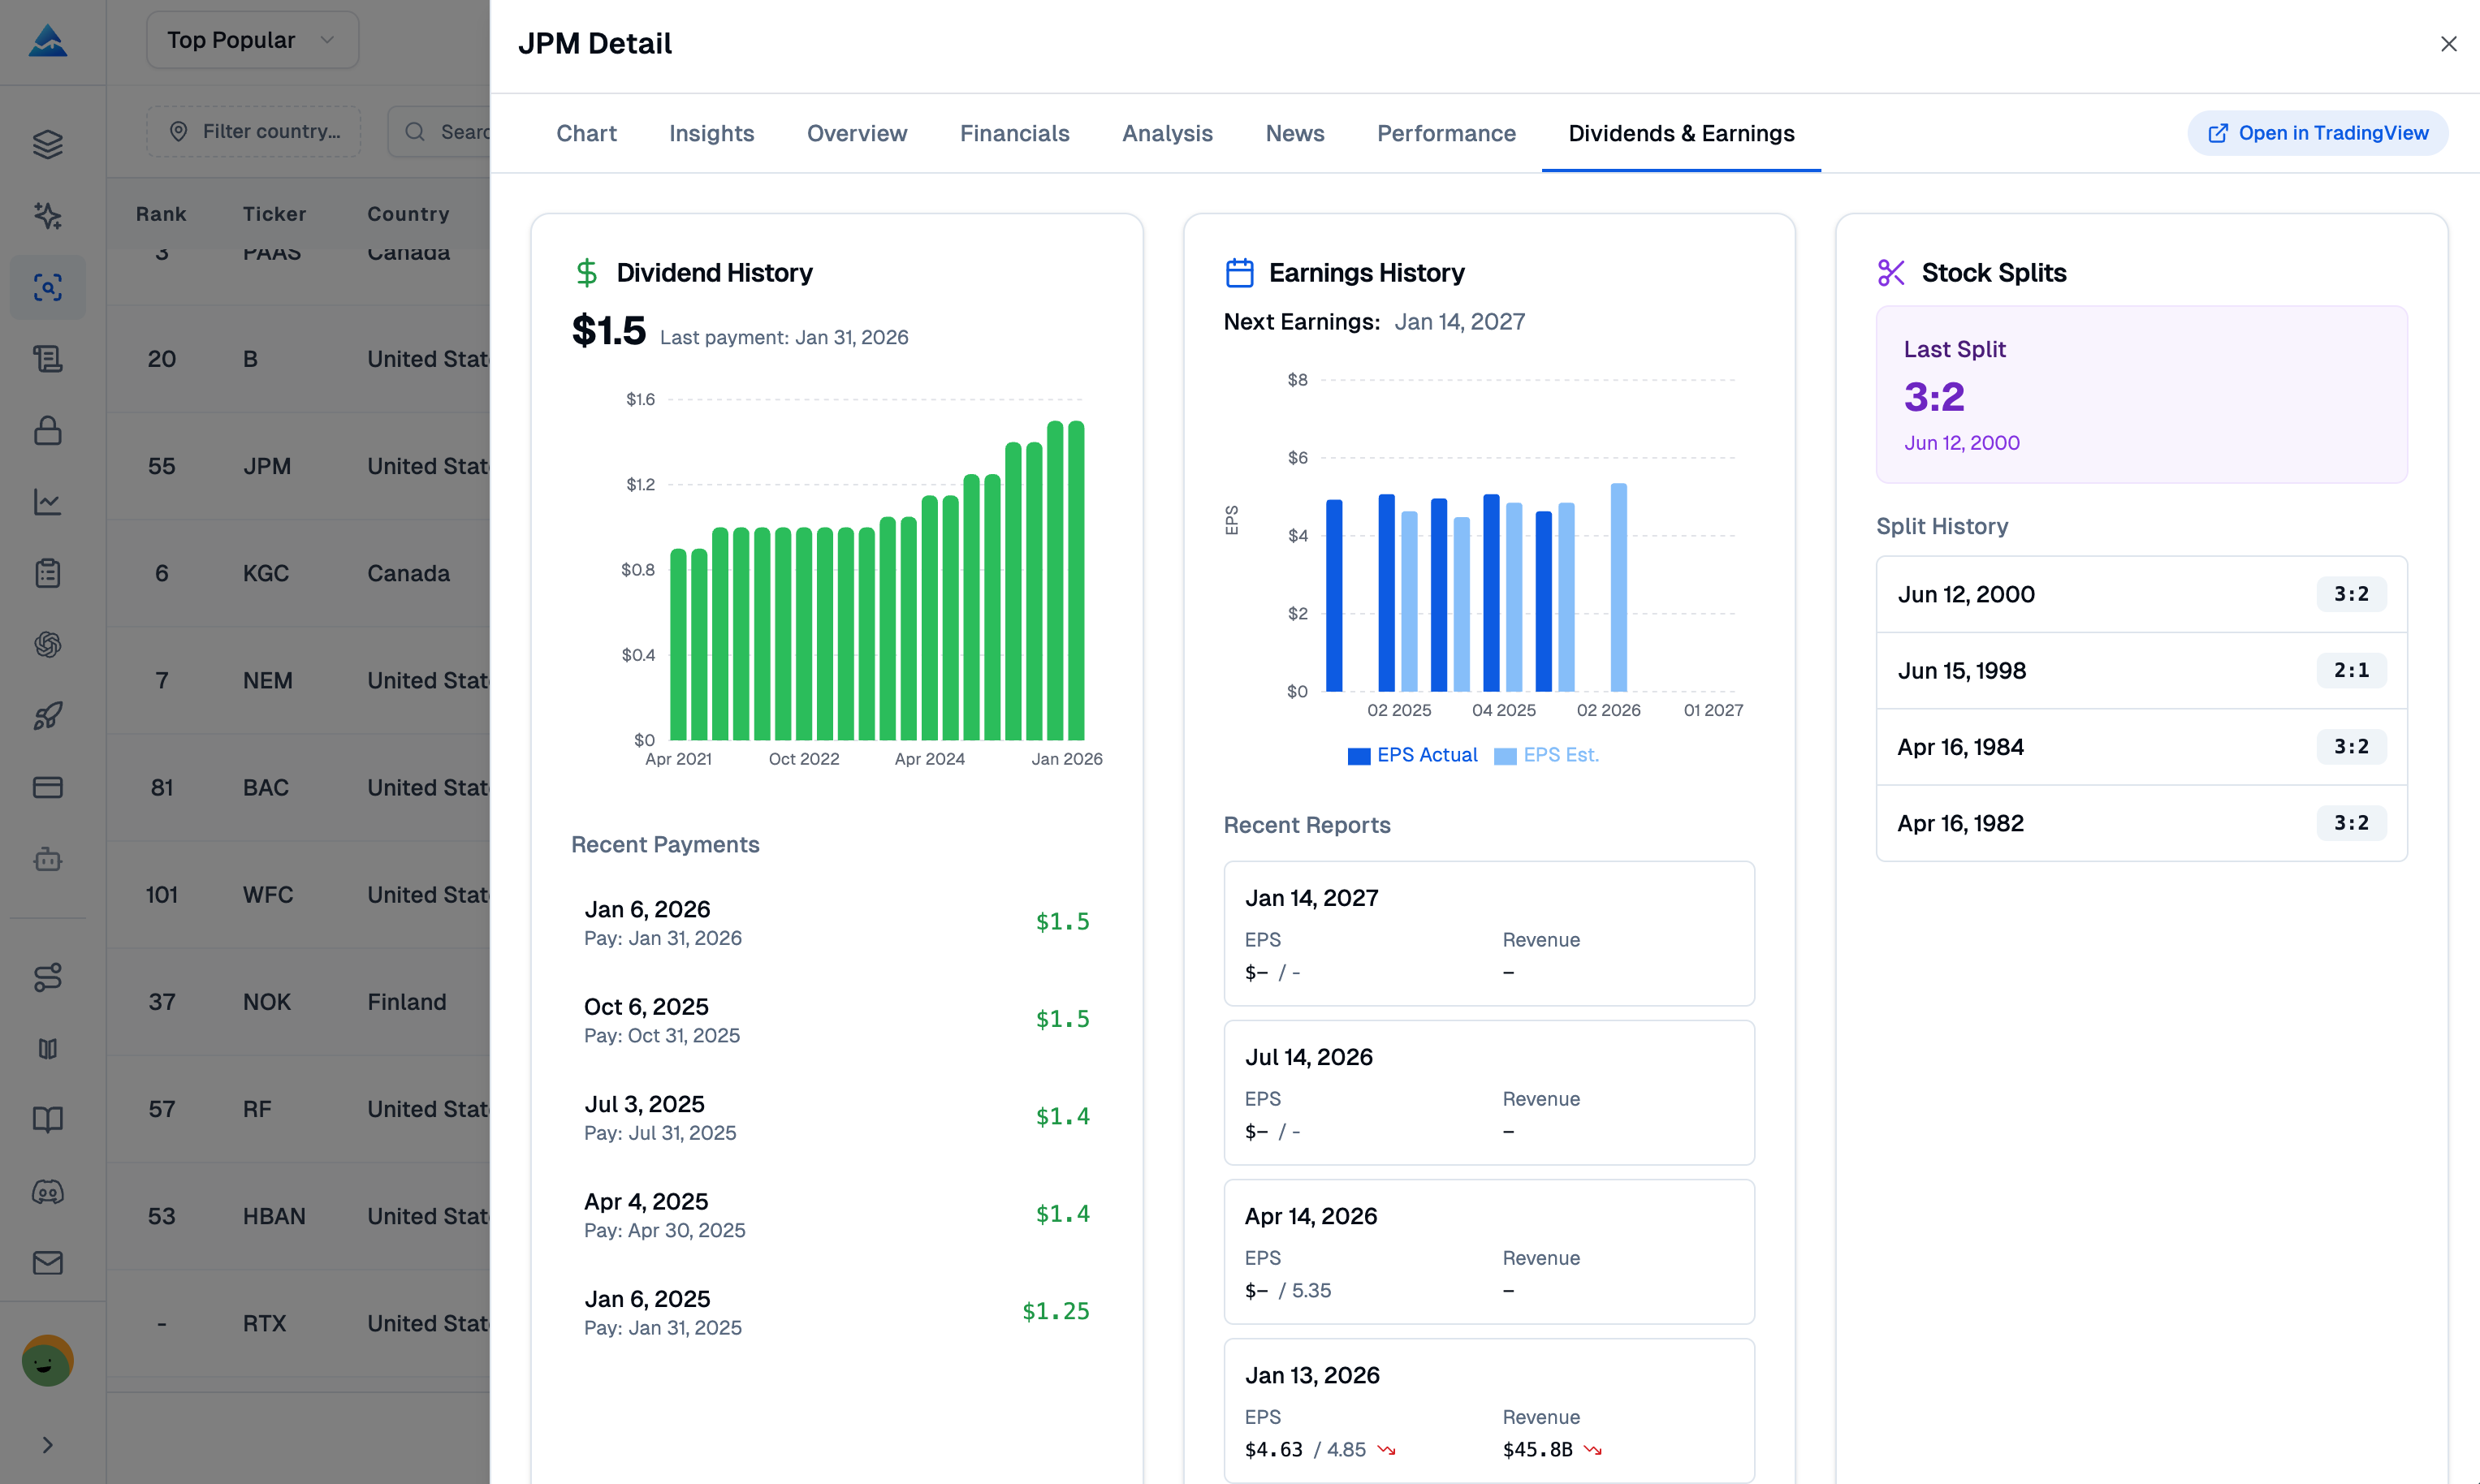
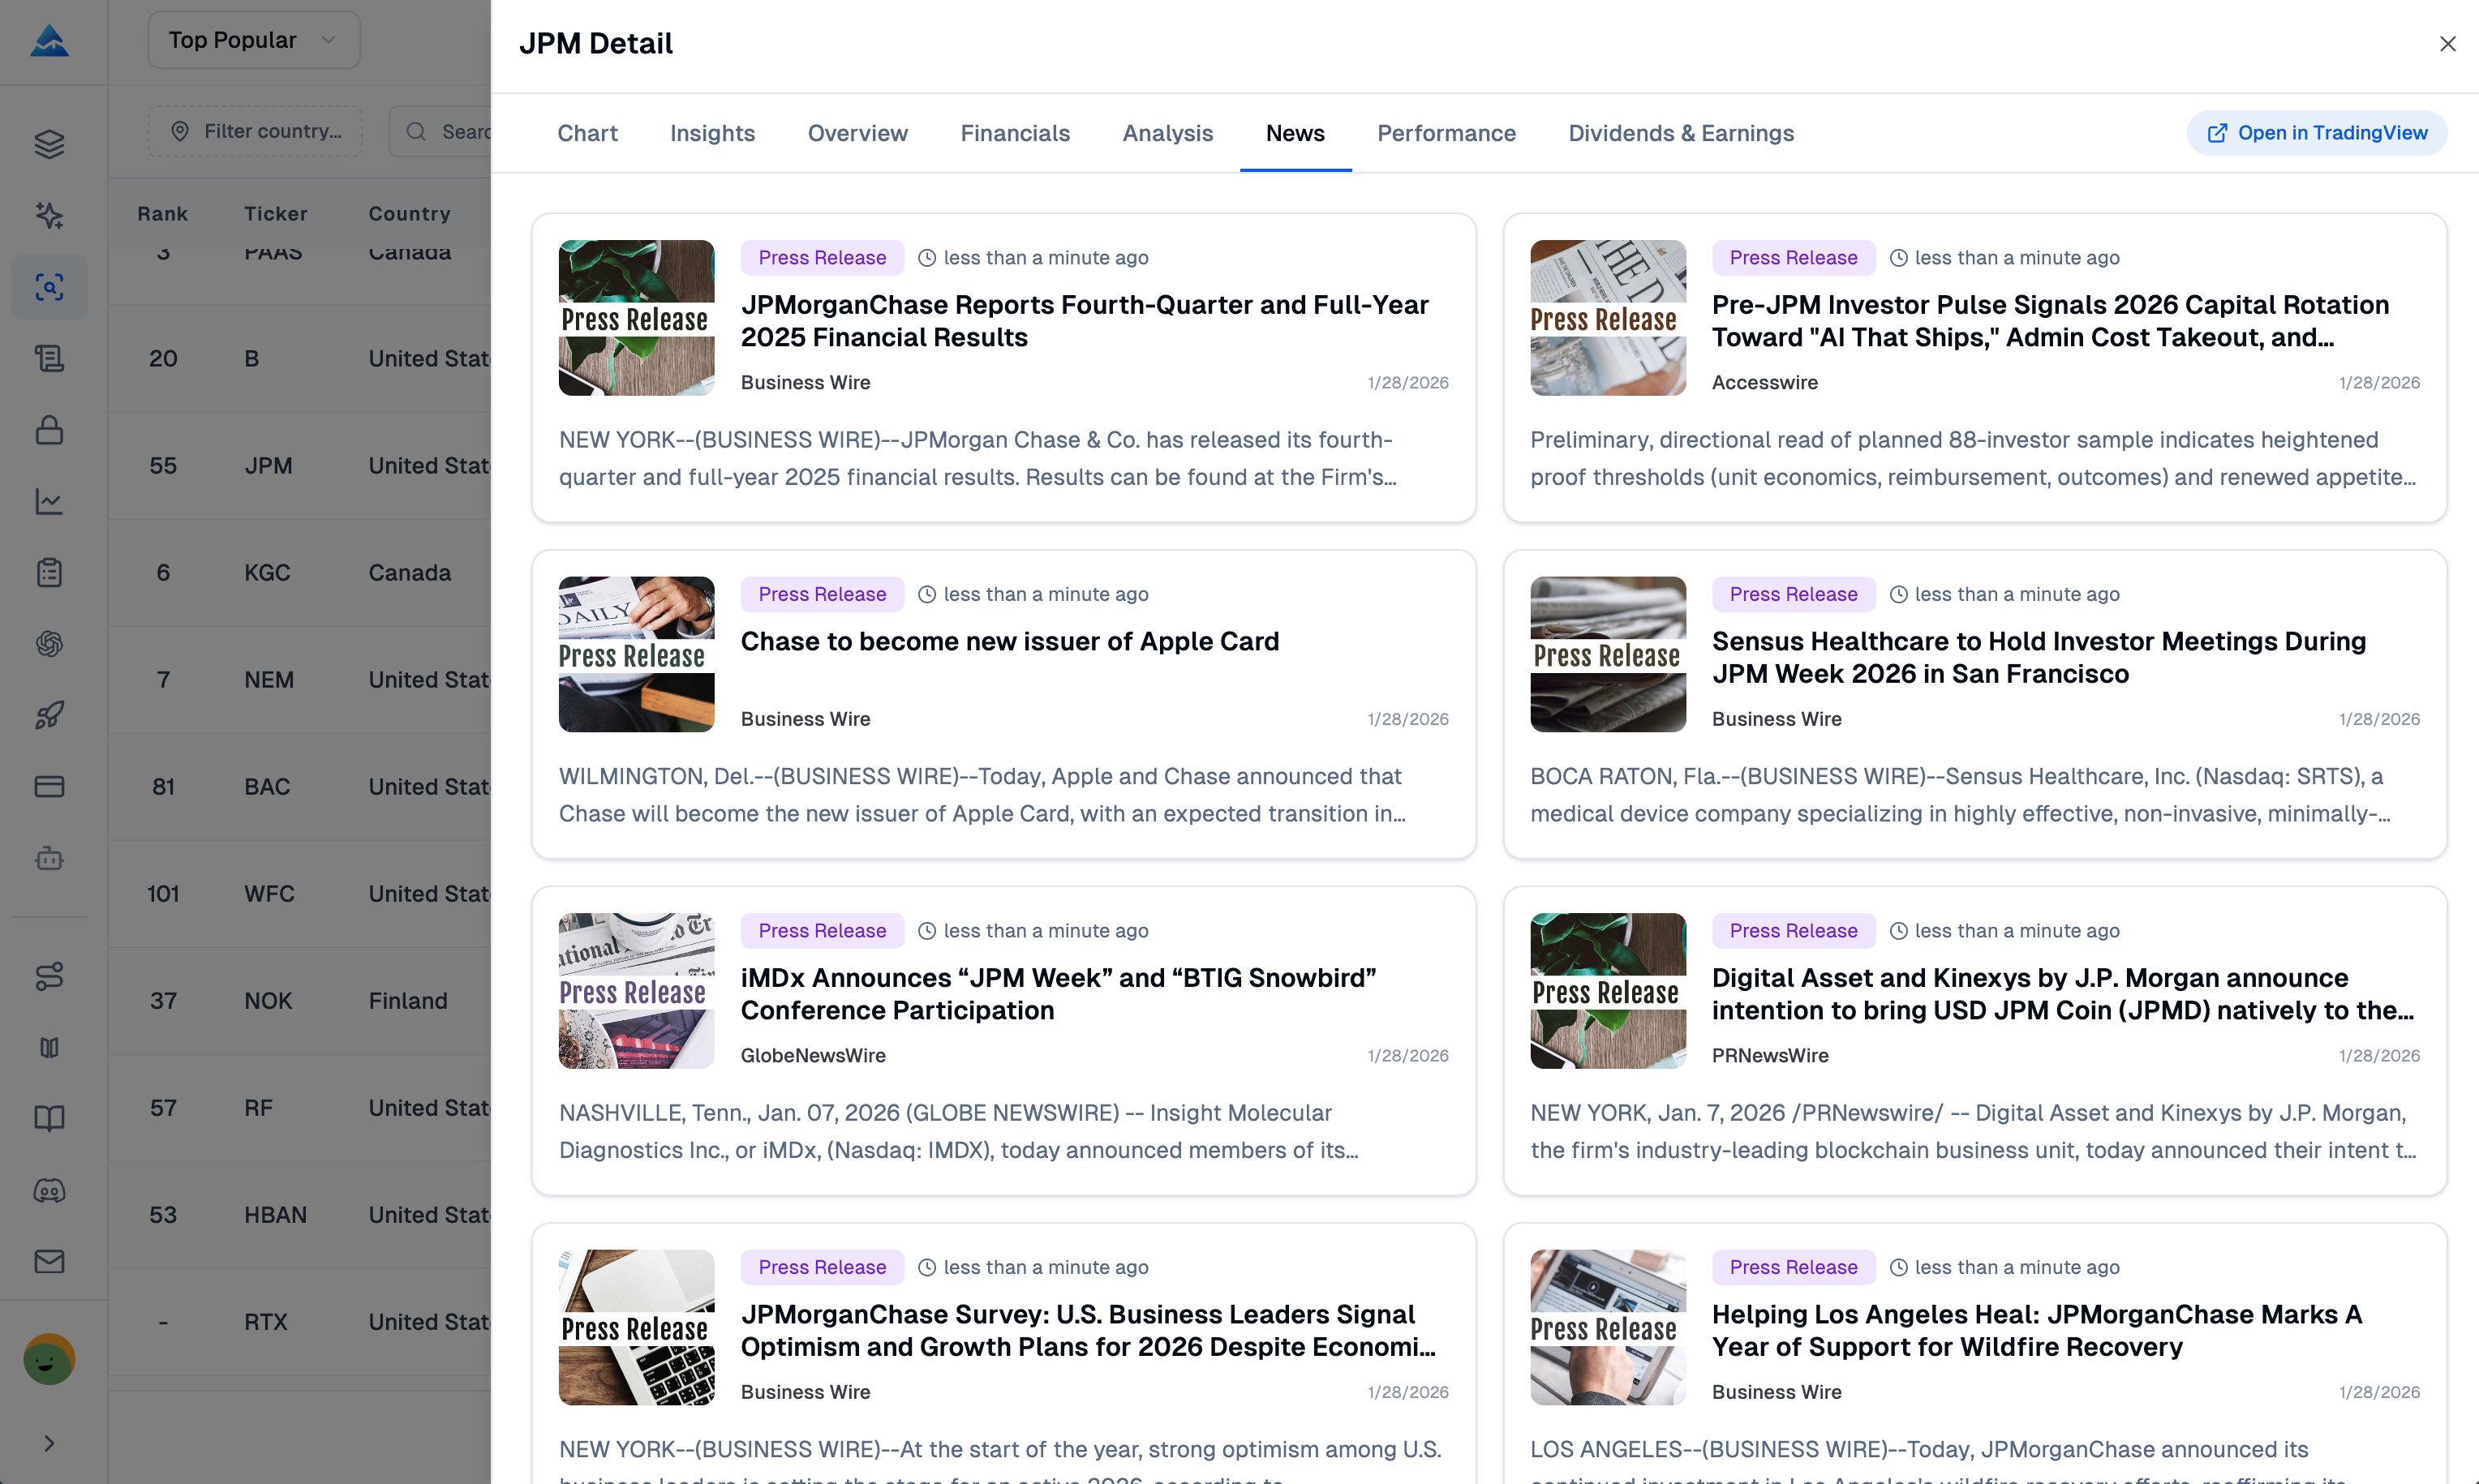
- Compare historical returns from one week through five years with S&P 500 context and volatility measures.
- Review dividend history, payout ratio, earnings surprises, stock splits, and upcoming ex-dates or payment dates.
- Read aggregated financial news, corporate announcements, SEC filings, and per-article sentiment with source filtering.
How should you interpret the 1-10 score?
The 1-10 score is a multi-factor ranking output. Pineify presents scores from 7 to 10 as higher-potential candidates within its model, but the score does not predict future returns, establish a probability of profit, or constitute investment advice.
Use the score to decide which tickers deserve attention, then open the underlying panels and record the reasons for your conclusion. Market conditions, data freshness, liquidity, and sudden news can change the evidence after a daily refresh. For broader context, compare the picker with Market Insights, including options flow and dark pool views.
Is the AI stock picker right for every workflow?
It is useful when you need a repeatable first pass across a large stock universe or want stock and options analysis in one workspace. It is less suitable as a standalone execution rule, a substitute for reading filings, or a guarantee that a highly ranked ticker will outperform.
The app supports filters for country, sector, industry, market cap, P/E ratio, and other financial metrics. Coverage varies by ticker, exchange, plan, and session, so check the detail panels before relying on any field.
AI stock picker FAQ
How does Pineify's AI stocks and options picker work?
It combines fundamental data, technical context, analyst consensus, options data, and news sentiment into a daily 1-10 score. The score narrows the research universe, while the ticker panels let you verify the evidence.
Is an AI stock picker a prediction tool?
No. Pineify's score is a ranking and research input, not a promise about returns, timing, or accuracy. Treat it as one input in a documented decision process and apply your own risk controls.
What options analysis is available in the picker?
You can inspect bid and ask prices, the Greeks, implied volatility, open interest, max pain, unusual activity, put/call ratios, and expected moves by expiration. These metrics describe the options market and do not remove the risk of the contract you choose.
Which plan includes the AI Stocks & Options Picker?
The app marks the feature as Expert only. Plan names, limits, and included data can change, so confirm access on the pricing page and in the app's access message.
Can I search any stock ticker?
You can start with curated Popular, Dividend, and Growth lists or search a ticker when your plan permits the field. Coverage, market data, and options availability still depend on the instrument and the current market session.
AI Finance Agent
Use Pineify's AI finance agent for stock analysis, financial research, market data, company fundamentals, screening, and evidence-aware investing workflows.
AI Chart Analysis
Pineify's AI chart analysis interprets stock or crypto screenshots, maps technical levels, and adds risk context without presenting a price forecast.