

Custom Stock Screener
Use Pineify's custom stock screener to compare technical fields across stocks, crypto, and ETFs with collections, timeframes, sorting, and 60-second refresh.
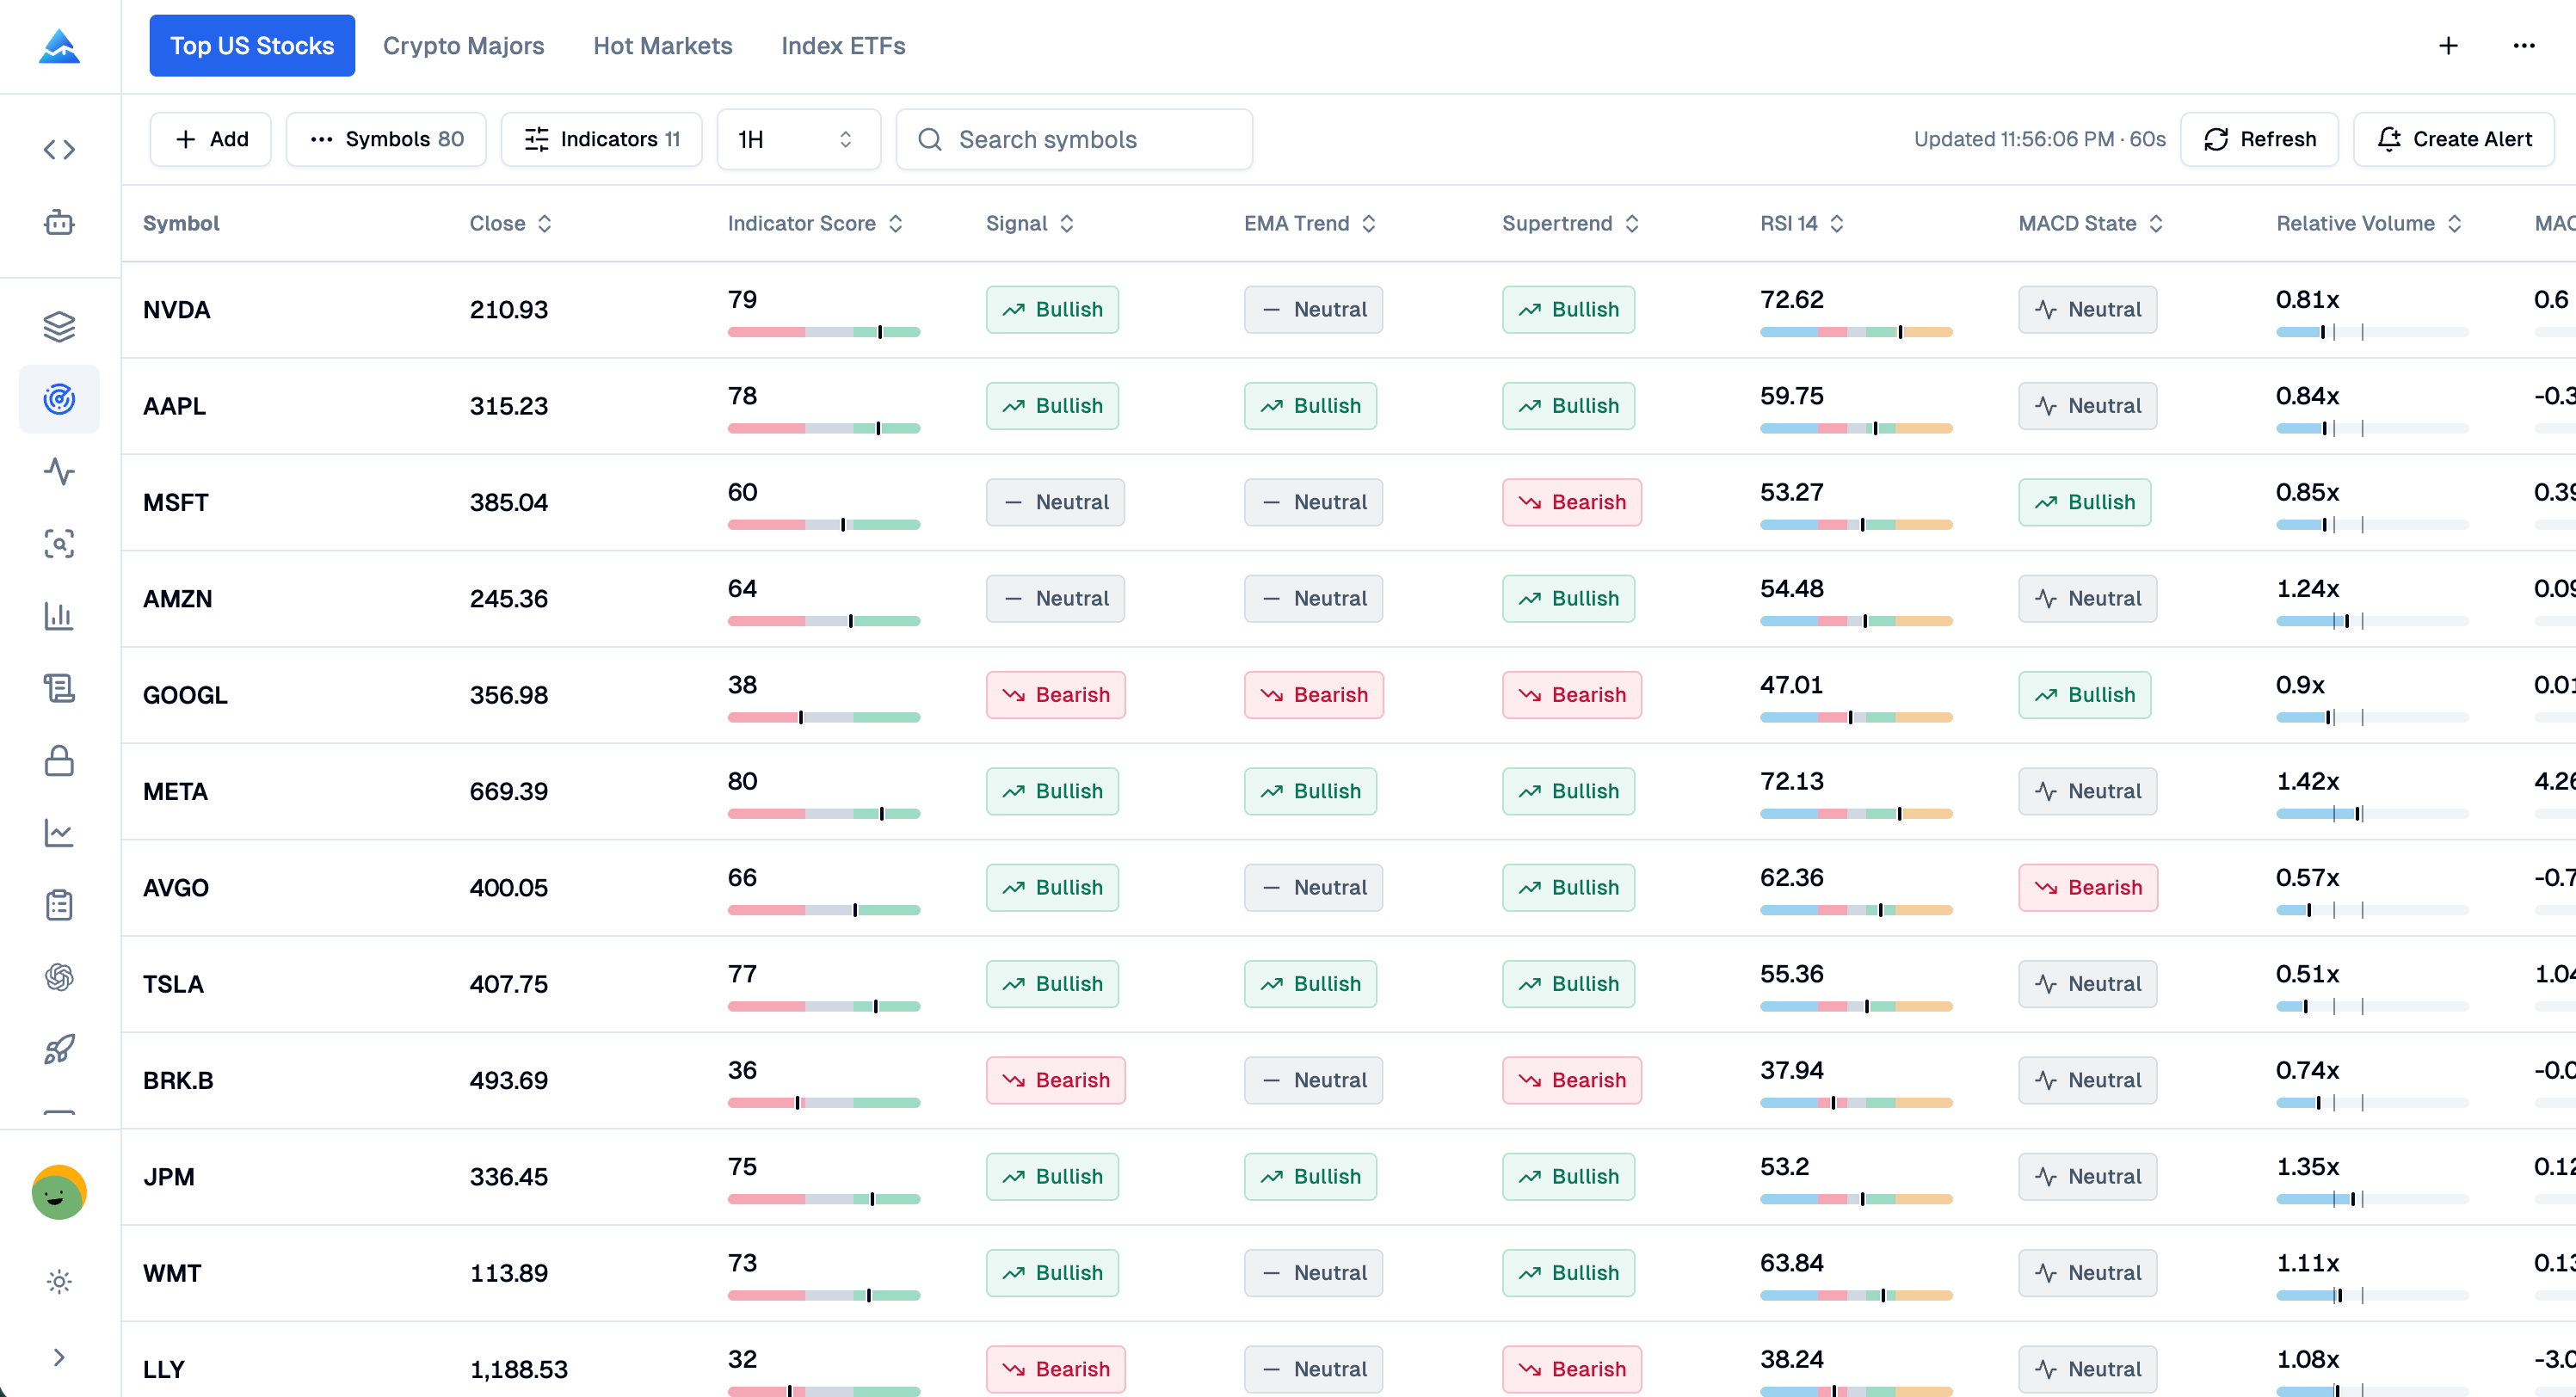
The Custom Stock Screener is Pineify's configurable technical indicator screener for comparing supported stocks, crypto assets, ETFs, and other instruments in saved collections. It presents TradingView Alert pipeline values in one sortable workspace, so you can review the same fields and timeframe across symbols without opening each chart. It filters research candidates; it does not predict price or execute trades.
What can you do with a custom stock screener?
The screener turns a symbol list into a repeatable comparison workspace. Choose fields, keep them in visible columns, and sort or search the collection to identify symbols for chart review. It is useful when one chart is too narrow and a spreadsheet is too slow to maintain.
Which signals and instruments are supported?
The field library covers price action, trend, momentum, volatility, volume, performance, and composite signals. Use the same layout for supported stocks, crypto assets, ETFs, and other instruments. Check the app's coverage before comparing markets with different sessions or liquidity.
How do you set up a TradingView screener workflow?
Pineify uses TradingView Alert pipeline values in a separate collection interface. It is a configurable TradingView screener companion, not a replacement for TradingView's built-in Stock Screener. Follow this sequence:
- Open Custom Stock Screener and start with Top US Stocks, Crypto Majors, Hot Markets, or Index ETFs, or create an editable collection.
- Add supported symbols in a batch and arrange their saved order so the list matches your research universe.
- Search the field library and select the columns you need. Keep the visible set focused so each value remains easy to compare.
- Apply one shared timeframe, or assign a different supported timeframe to each symbol when your research requires it.
- Sort a column, search by ticker, and compare the rows whose values match your stated criteria.
- Open the underlying chart before forming a thesis. A row filters attention; it does not explain full market context.
How does the technical indicator screener refresh?
Active collections refresh every 60 seconds and support manual refresh. Inactive collections pause until you return. This is not tick-level real-time data and is not designed for latency-sensitive execution or intrabar monitoring.
What are the current limits?
These limits define the current editable collection model.
| Setting | Current behavior |
|---|---|
| Technical fields | 300 fields across price action, trend, momentum, volatility, volume, performance, and composite signals |
| Visible columns | Up to 20 per collection |
| Symbols | Up to 100 per collection |
| Collections | Up to 15 |
| Timeframes | 1m, 5m, 15m, 30m, 1h, 2h, 4h, and 1d |
| Refresh | Active collection refreshes every 60 seconds and supports manual refresh |
| Alerts | Screener-based alert creation is coming soon |
Creating and using an editable collection currently requires an Expert or higher plan. If the app shows a locked demo or a different access message, use that in-app message and the pricing page as the current source of truth.
How should you read screener results?
Treat each result as a technical snapshot, not a trade instruction. Badges summarize selected fields and timeframe; they do not establish a full setup or predict the next return.
- Sort by one field to create a review queue, then inspect several fields before drawing a conclusion.
- Search by ticker when you need to revisit a known symbol without changing the saved collection.
- Compare like-for-like timeframes and remember that extended hours, market sessions, and liquidity can change how values should be interpreted.
- Open the underlying chart to verify price structure, support and resistance, volume context, and the timestamp of the data.
- Apply independent risk rules before placing any order. Pineify does not execute trades from the Custom Stock Screener.
For broader event and flow context, compare the rows with Market Insights. For a single-chart review, use AI Chart Analysis. If you want to test a completed strategy across parameter combinations, use the Strategy Optimizer. Teams building repeatable research workflows can also connect read-only tools through Pineify MCP.
Custom Stock Screener FAQ
Is this the same as the TradingView Screener?
No. Pineify's Custom Stock Screener is a separate collection interface that organizes values from the TradingView Alert pipeline. It has its own field, column, symbol, collection, timeframe, and refresh limits.
Can I use it as a crypto and ETF screener?
Yes, when the symbols are supported by the current data coverage. You can create or use collections such as Crypto Majors and Index ETFs, then compare the available technical fields at a supported timeframe.
How many indicators can one collection show?
The current field library contains 300 technical fields, while one collection can show up to 20 visible columns. Selecting fewer columns usually makes row-by-row comparison easier.
Does it scan every tick or send alerts?
No. Active collections refresh every 60 seconds, inactive collections pause, and the product page marks screener-based alert creation as coming soon. The current workflow is for periodic research and comparison, not tick-level monitoring.
Which Pineify plan is required for the Stock Screener?
Creating and using an editable collection currently requires an Expert or higher plan. Access and plan limits can change, so check the in-app message or the pricing page before planning a larger research workflow.
Pineify MCP: 40 Research and Journal Tools
Connect AI agents to 40 Pineify tools for code validation, stock research, financial analysis, and bounded workflows over Streamable HTTP.
Market Insights Dashboard
Explore Pineify's market insights dashboard for options flow, dark pool data, Congress trades, and market tide signals with clear research limits.