

What is TradingView?
Discover TradingView, a powerful charting platform for traders to analyze markets like Stocks, Forex, and Crypto. Enhance your trading with Pineify.
TradingView is a charting platform and social network for traders and investors. It supports financial charts across markets such as stocks, forex, crypto, futures, and commodities, and some users can connect supported brokers. Several Pineify workflows use TradingView, including Pine Script generation, the Visual Pine Script Editor, Strategy Optimizer, Backtest Deep Report, Premium Scripts, and the Invite-Only Indicator. Pineify's MQL5, cTrader, and standalone market-research tools do not require TradingView.

How to Create a TradingView Account
-
Visit the TradingView Homepage.
-
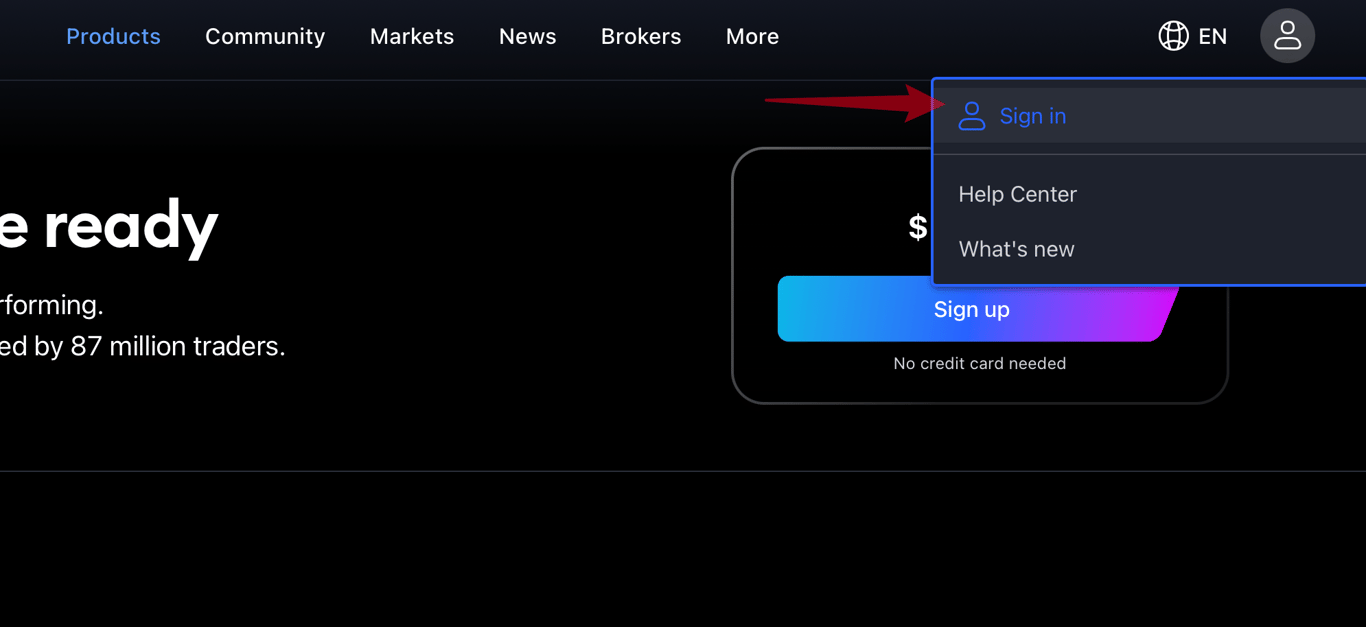
Click "Sign in" at the top right, then select "Sign up" at the bottom of the window.
-
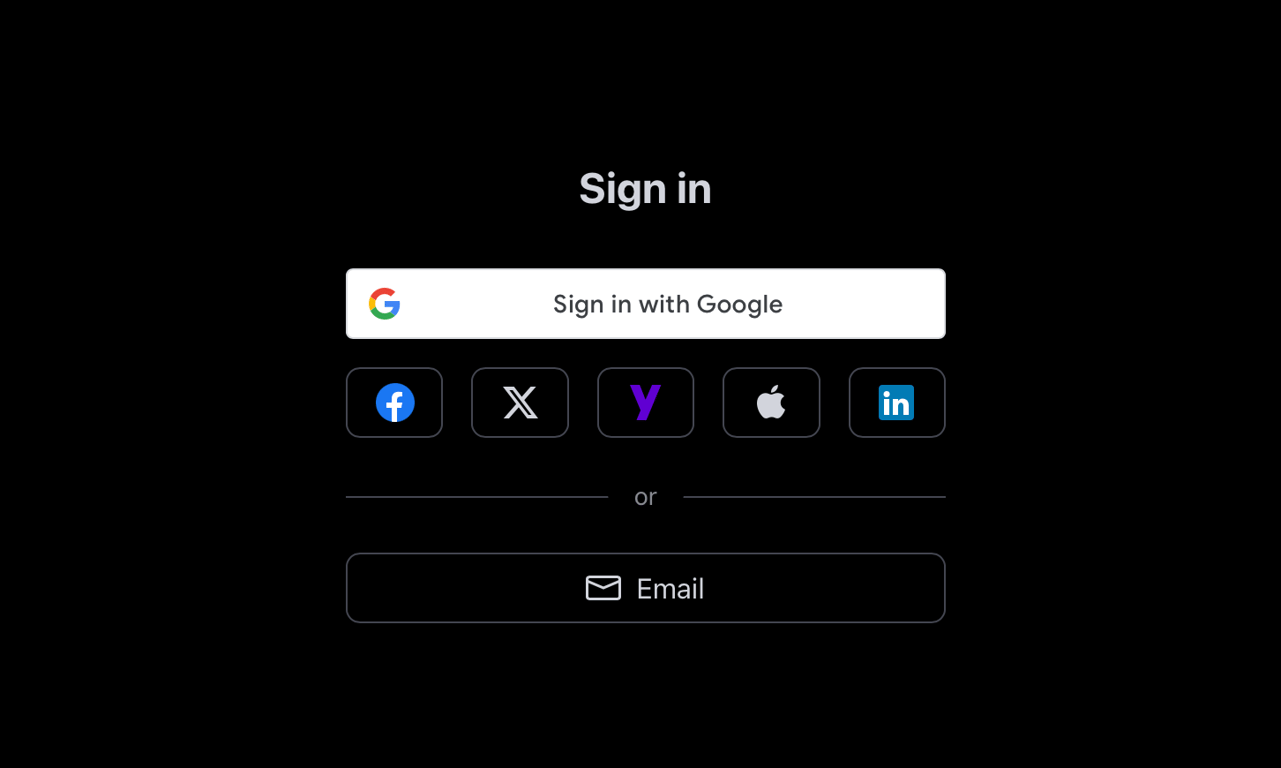
You can register using your social media accounts or an email address.
TradingView Charts
How to Open a Chart
To open a chart, log in to TradingView and click "Chart" at the top left of the page.

How to Change a Symbol
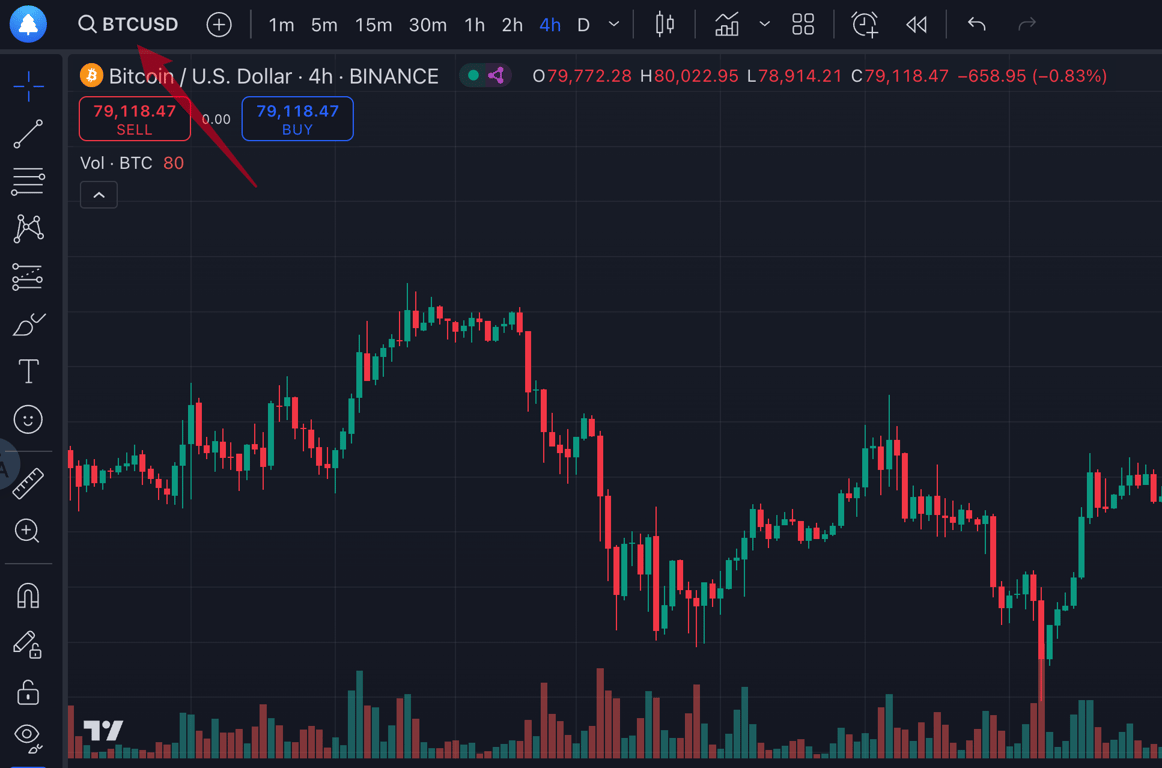
To change the symbol on a chart:
-
Click on the current ticker symbol at the top left of the chart.
-
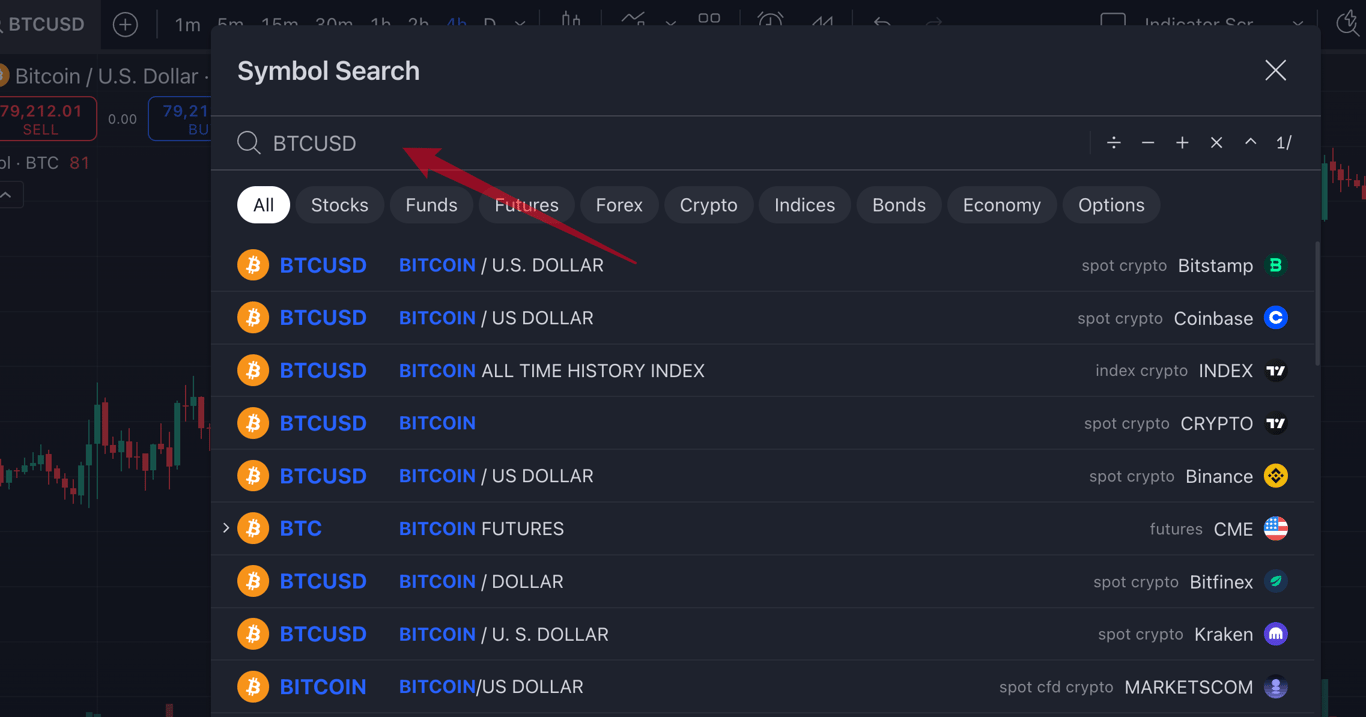
Type the name of the symbol or use filters to search by market or exchange.
How to Change Chart Timeframe
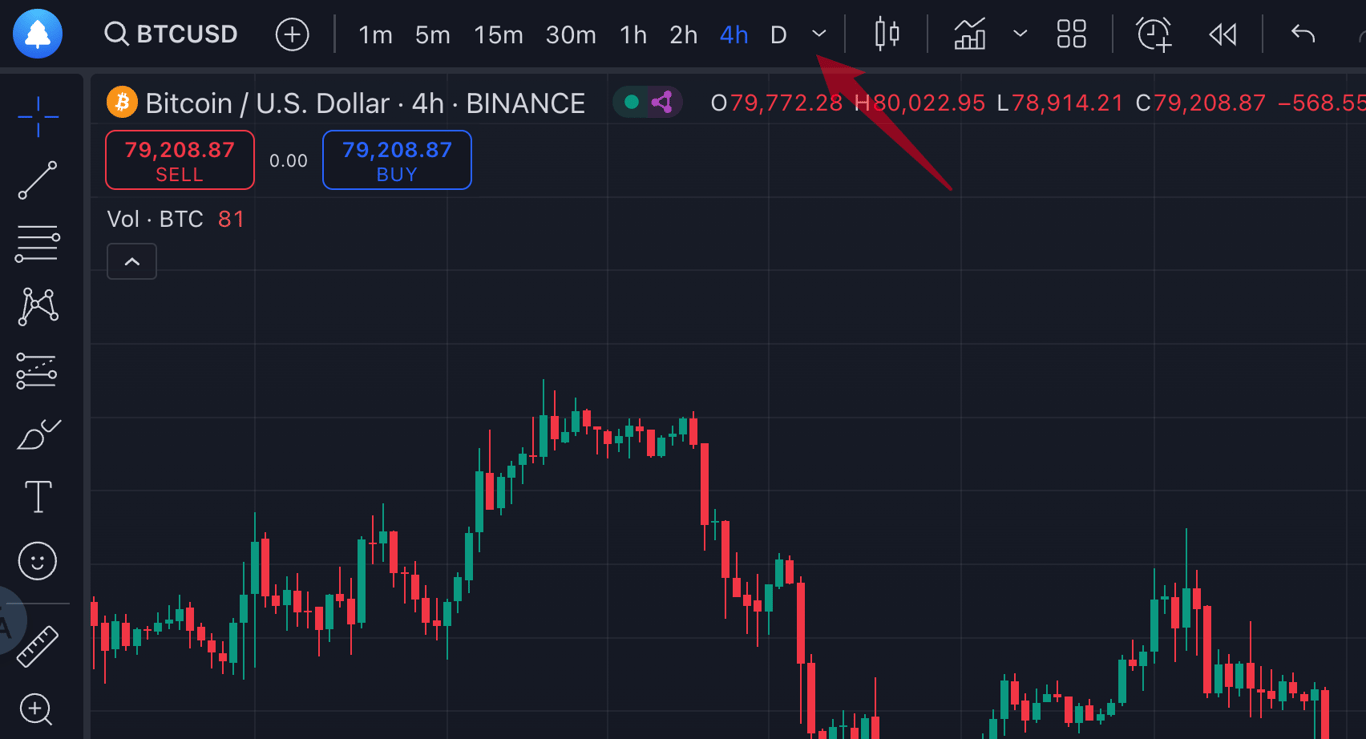
Timeframes control how often new candles appear on a chart. To change it:
-
Click next to the ticker name.
-
Select your preferred timeframe or type it directly on your keyboard.
How to Add Indicators
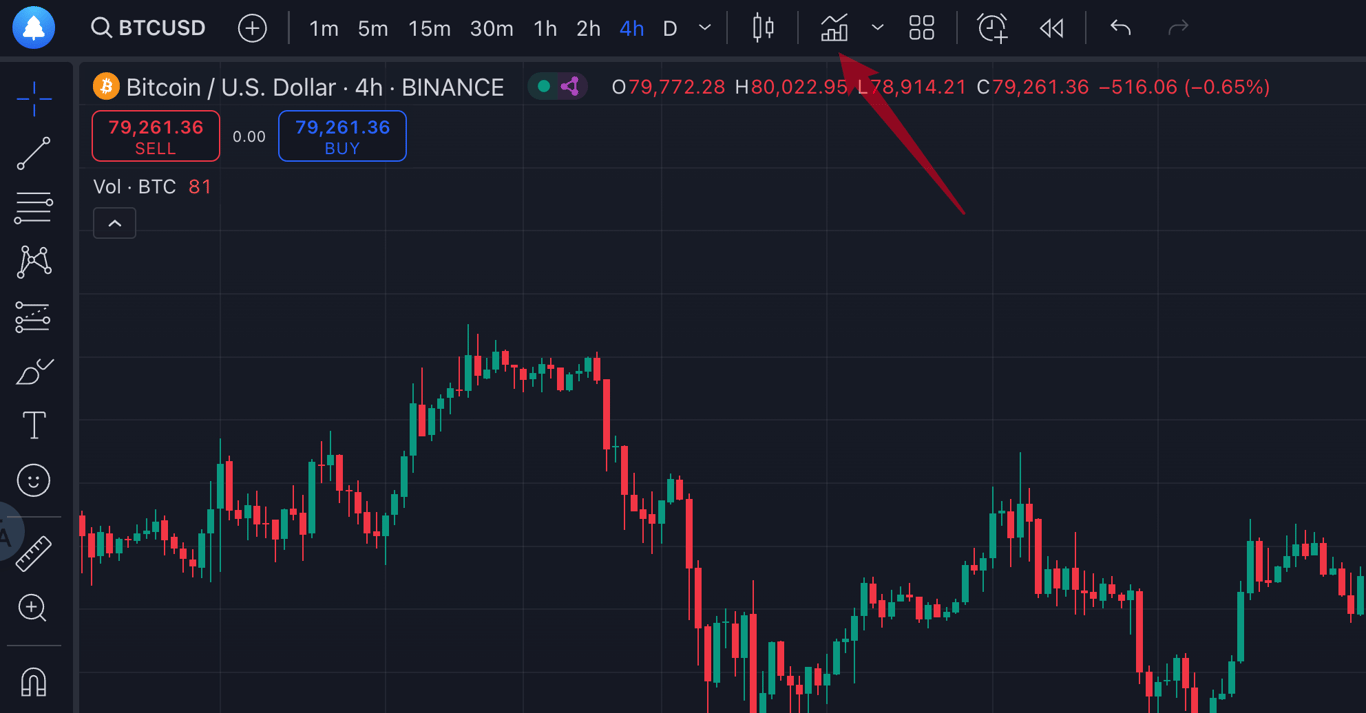
To add indicators:
-
Click "Indicators" at the top of the chart.
-
Search for and select your desired indicator from the menu.
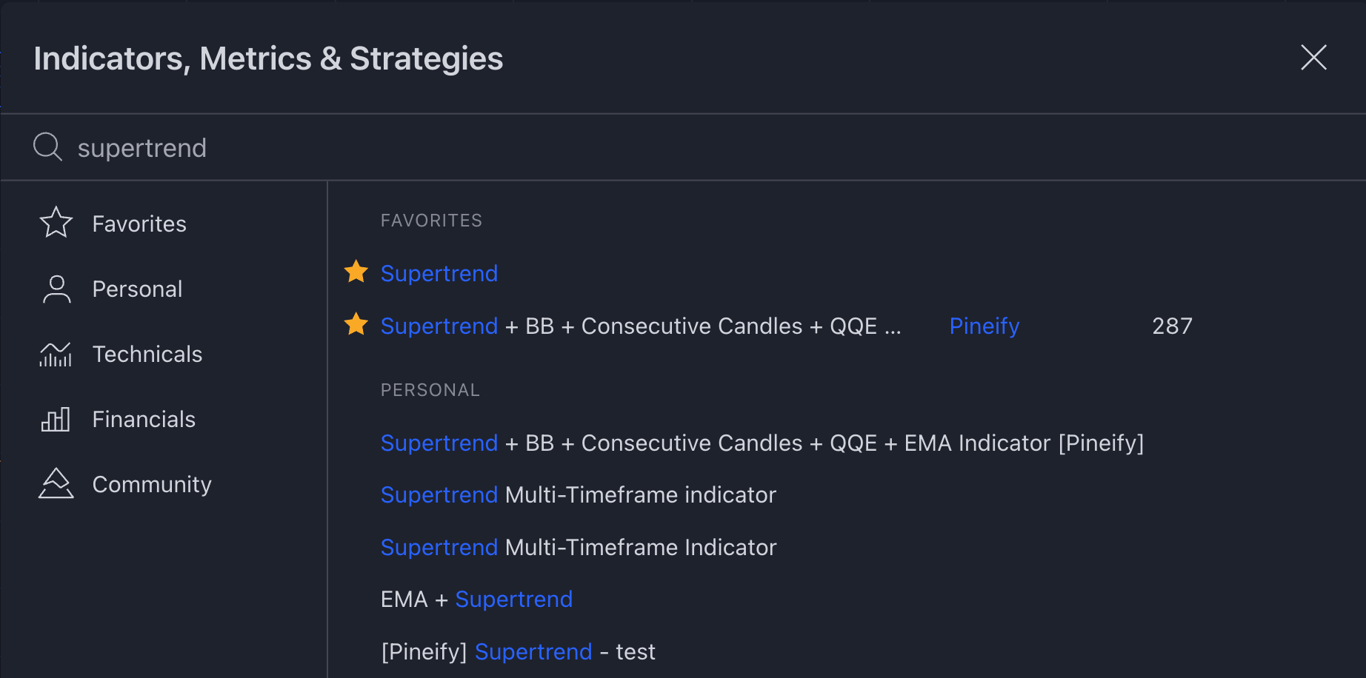
How to Add Custom Indicator
To add indicators:
- Click "Pine Editor" at the bottom of the chart.
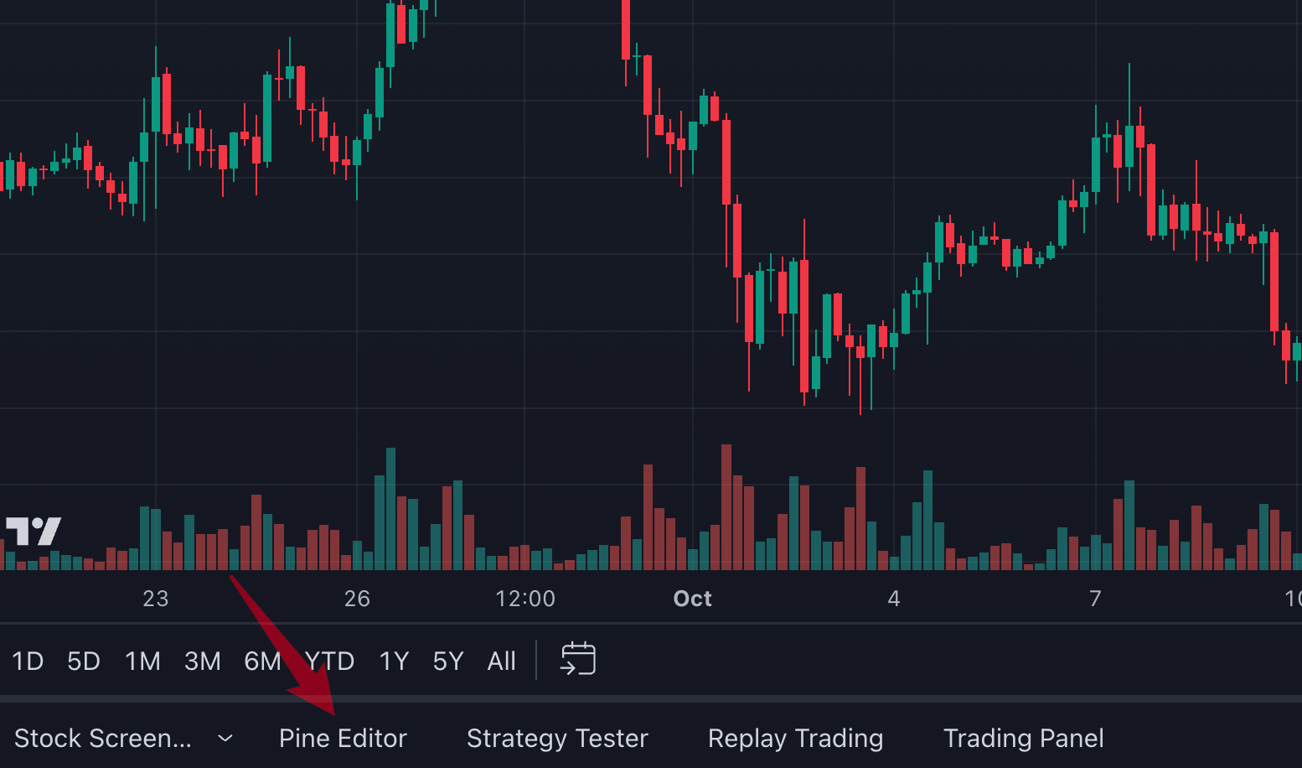
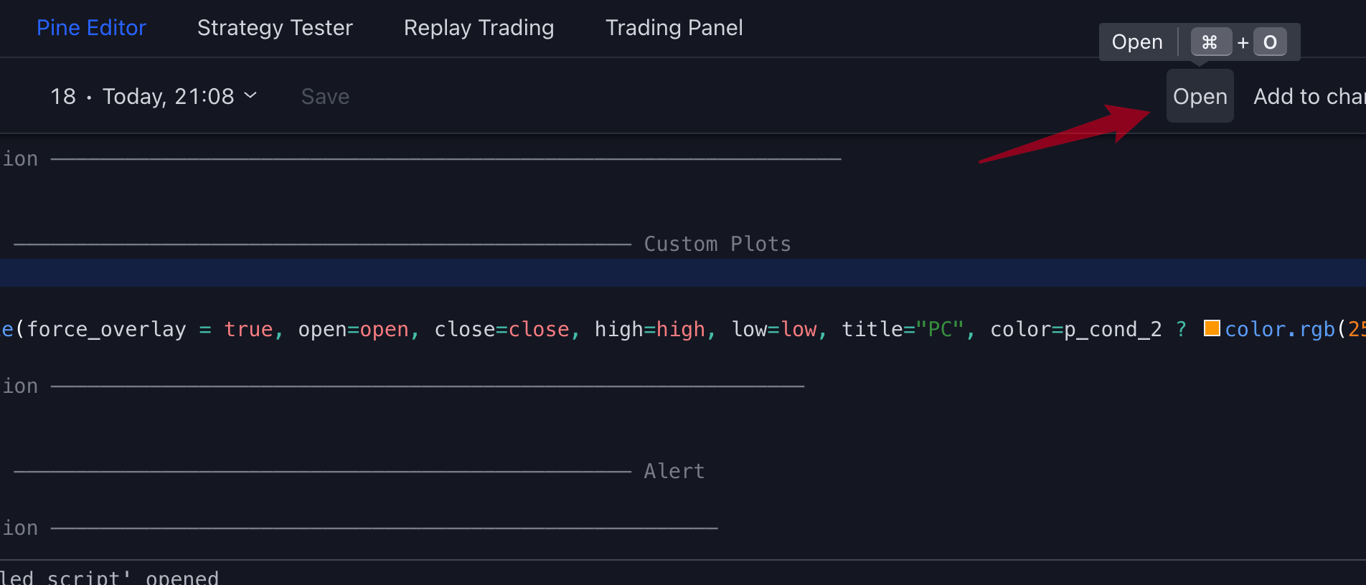
- Click “Open” Button.
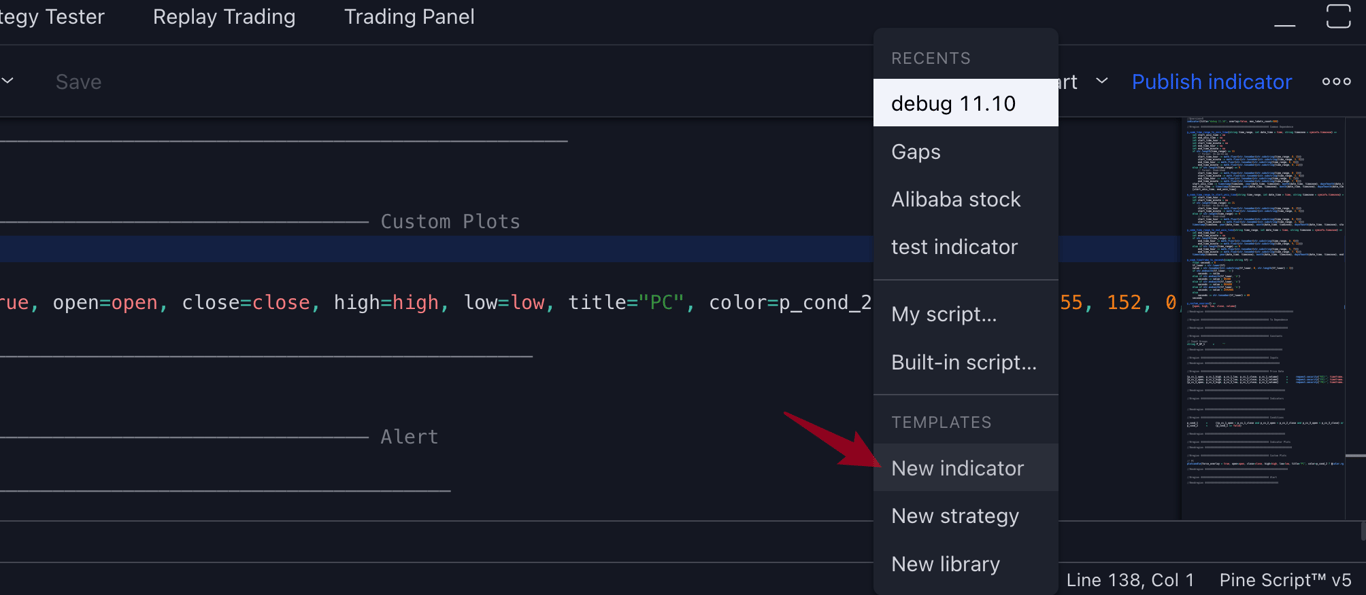
- Click “New Indicator”
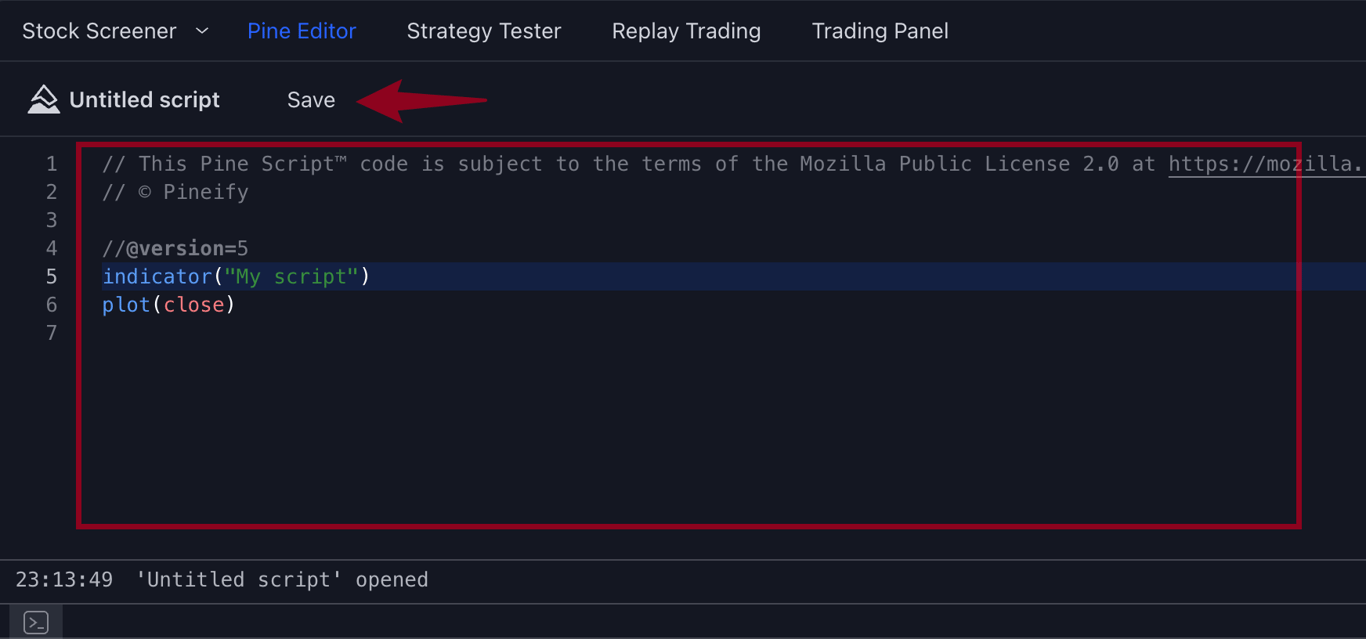
- Paste the code and click “Save”.
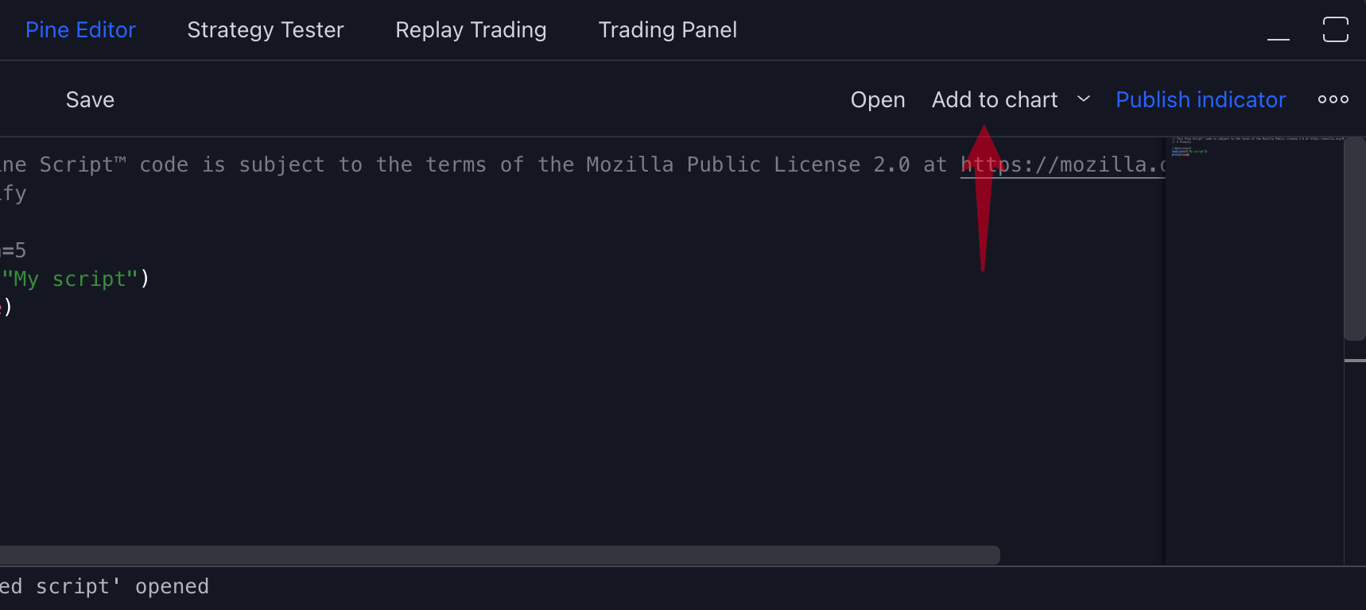
- Click “Add to chart”, Indicators or strategies will be added to the chart.
How to Save a Chart Layout
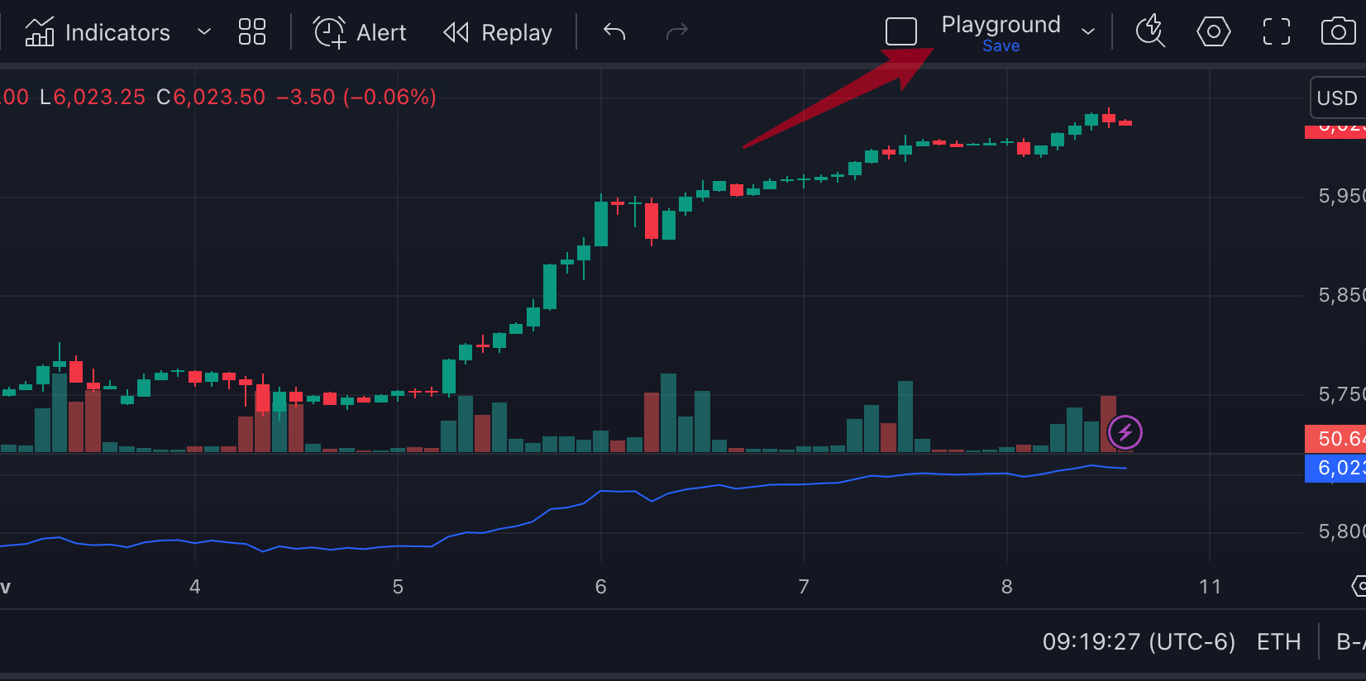
You can save chart settings, including indicators and timeframes, from TradingView's chart-layout controls. You can also use Ctrl + S on Windows or Cmd + S on macOS when the chart has focus.