

Market Insights Dashboard
Explore Pineify's market insights dashboard for options flow, dark pool data, Congress trades, and market tide signals with clear research limits.
The Market Insights dashboard brings four kinds of reported market activity into one research workspace: options flow, Market Tide, dark pool data, and Congress trading disclosures. Use the modules to organize evidence, compare activity across sectors or tickers, and record what is known without treating a flow label as proof of intent or a forecast.
How do you use the Market Insights dashboard?
Start with one question, select the relevant module, and then narrow the results with the filters available in that view. A simple workflow keeps the source, timestamp, and interpretation separate:
- Open Market Insights and choose Options Flow, Market Tide, Dark Pool, or Congress.
- Filter by ticker, sector, trade-size tier, or date range where the module supports that filter.
- Read the table, chart, or heat map together with its timestamp and coverage notes.
- Compare a pattern with another module, the price chart, and your own risk rules before taking action.
Options flow and dark pool views cover intraday activity as the underlying data is reported. Market Tide summarizes premium flow for the selected period. Congress data follows public STOCK Act disclosures, so transaction and filing dates can differ. Coverage is subject to the source's reporting schedule.
What does Options Flow show?
Options Flow helps you inspect unusual or large options transactions, their execution context, and where activity is concentrated. It prioritizes research but cannot label who traded or why.
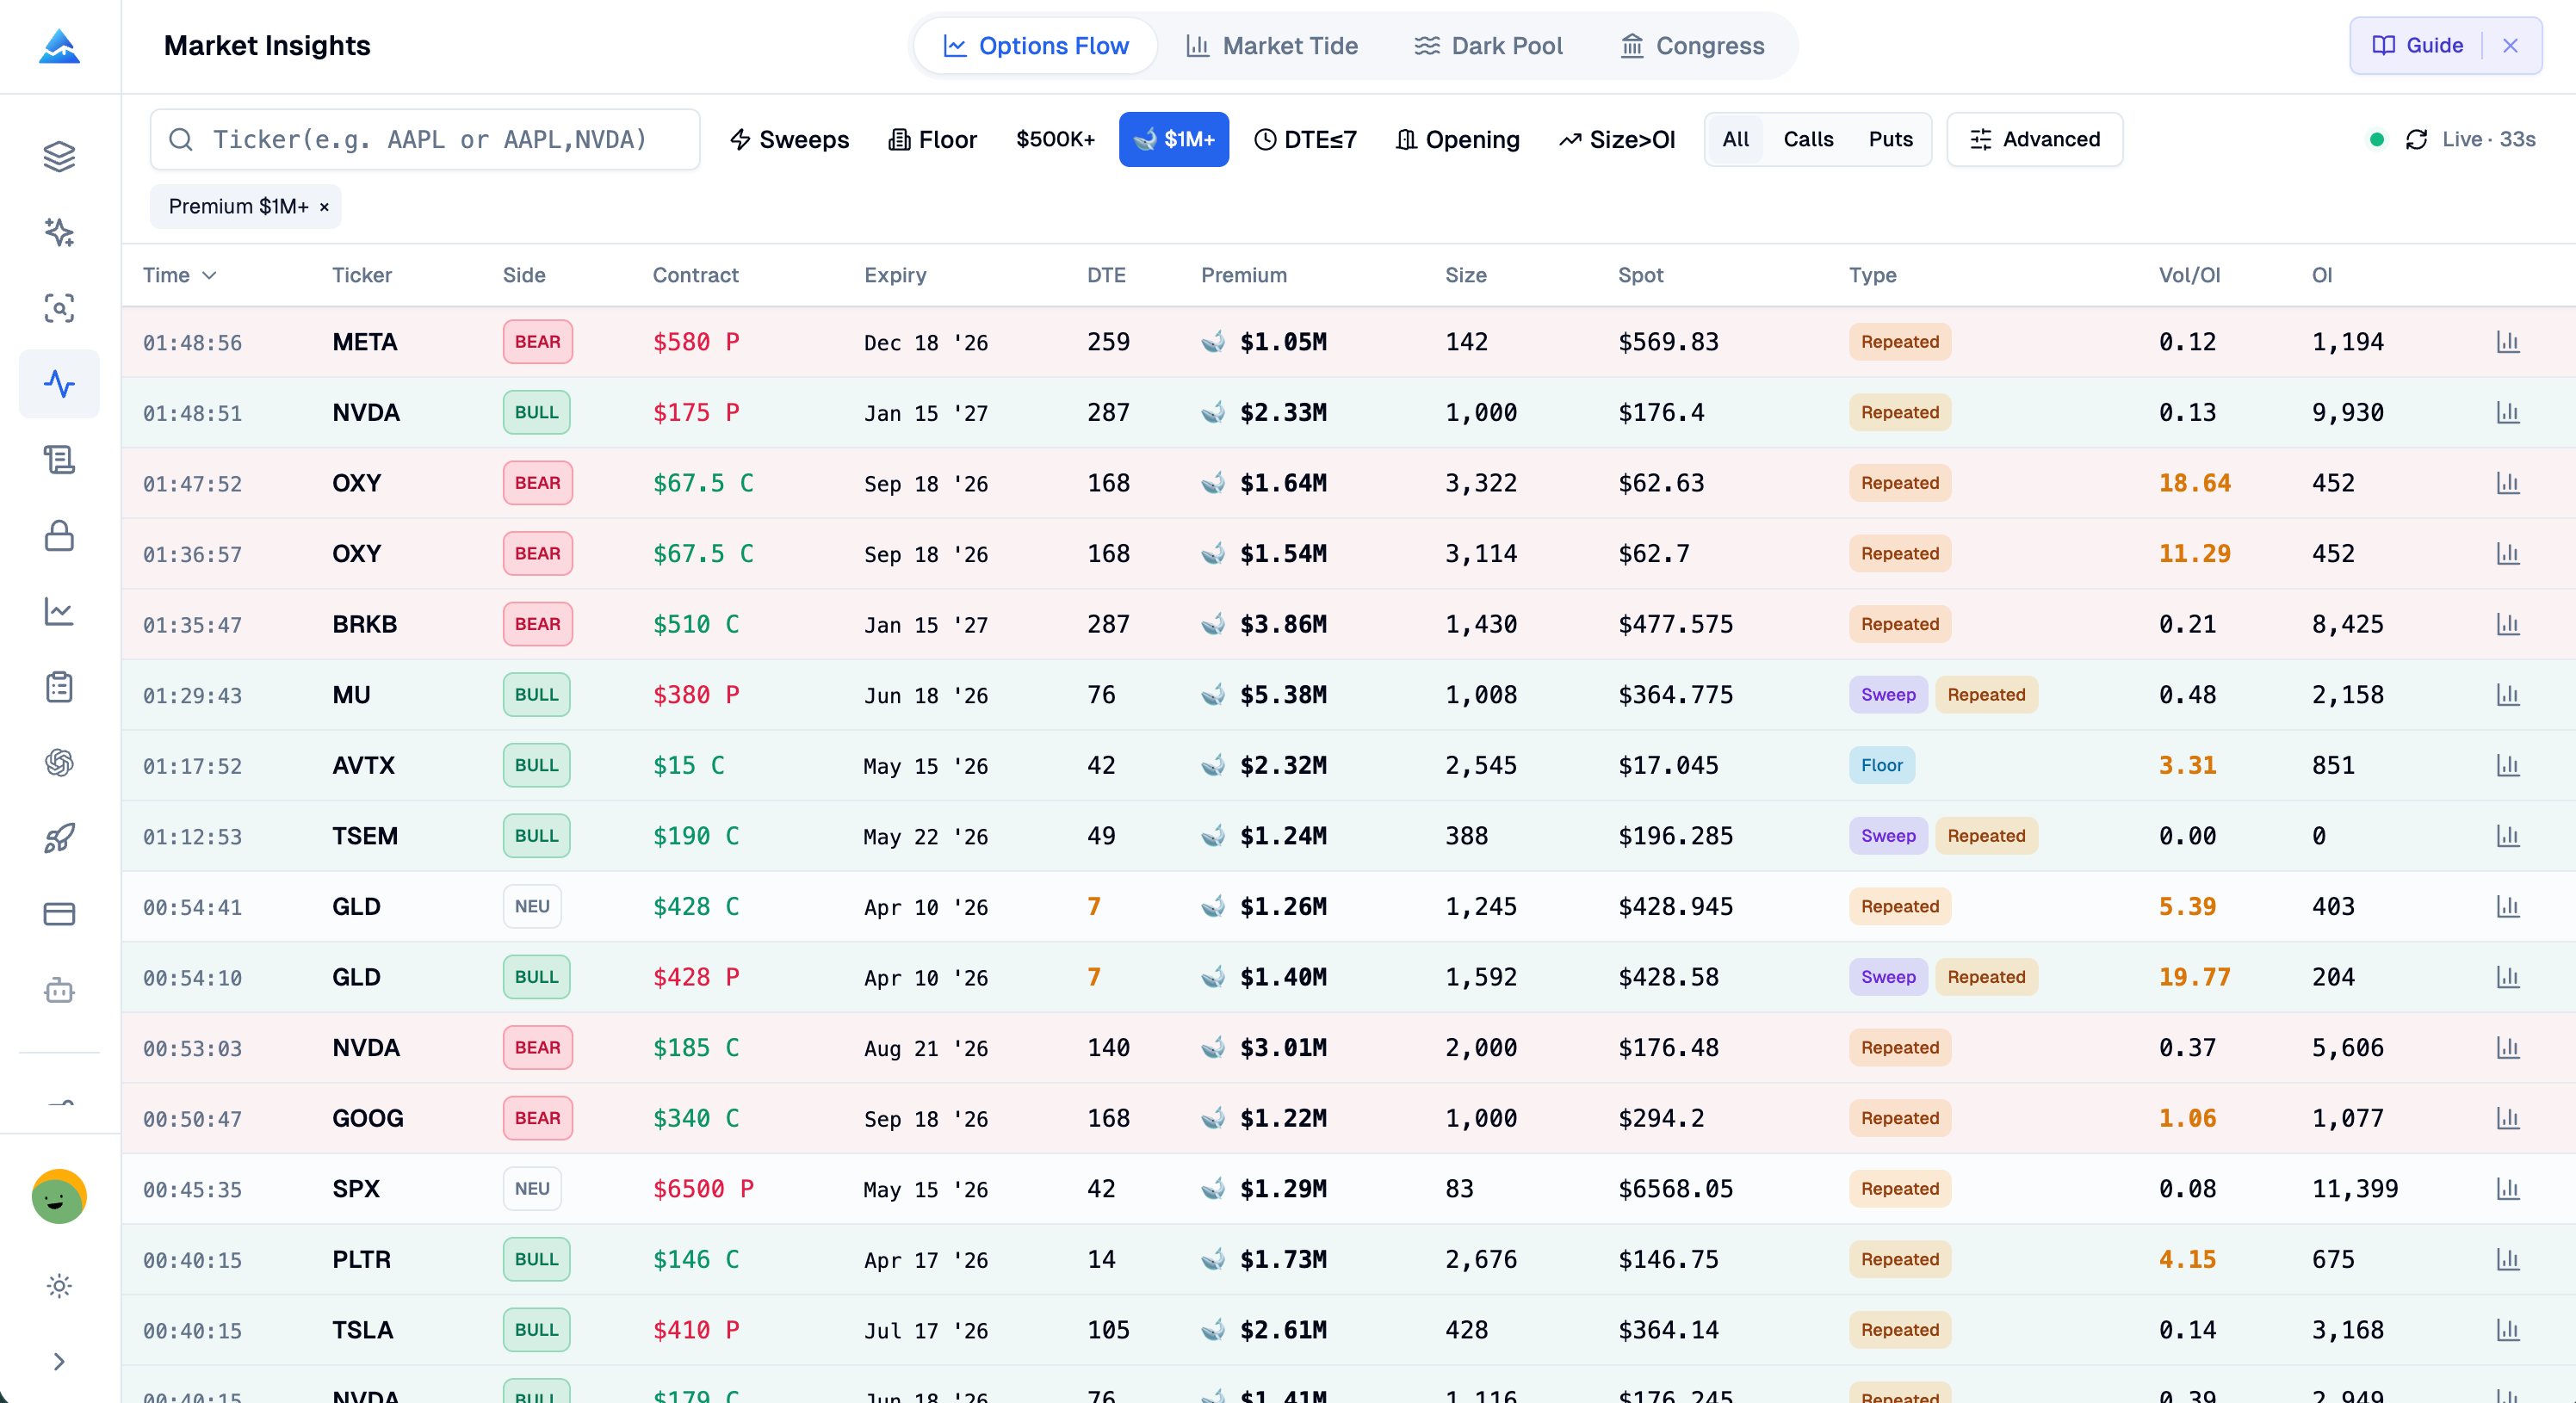
- Block trade detection: Review individual options trades above the configured size thresholds.
- Unusual options activity: Compare volume with open interest to find contracts that merit a closer look.
- Above-ask and below-bid context: See whether a reported execution occurred above the ask or below the bid. This is execution context, not a confirmed buy or sell intention.
- Flow scoring: Use algorithmic scores to sort unusual or large trades. The score cannot identify the trader, the hedge, or the purpose of the order.
- Sector aggregation: Check where the reported options activity is concentrated by sector and industry.
Review expiry, strike, premium, and execution side together. A print can be part of a spread, hedge, roll, or closing transaction, so compare it with AI Stocks & Options Picker before drawing a directional conclusion.
What is Market Tide?
Market Tide visualizes net premium flow and sector-level activity so you can see how the reported balance between call and put premium changes over a session. A rising or falling line describes the calculation; it does not establish participant intent or predict the next price move.
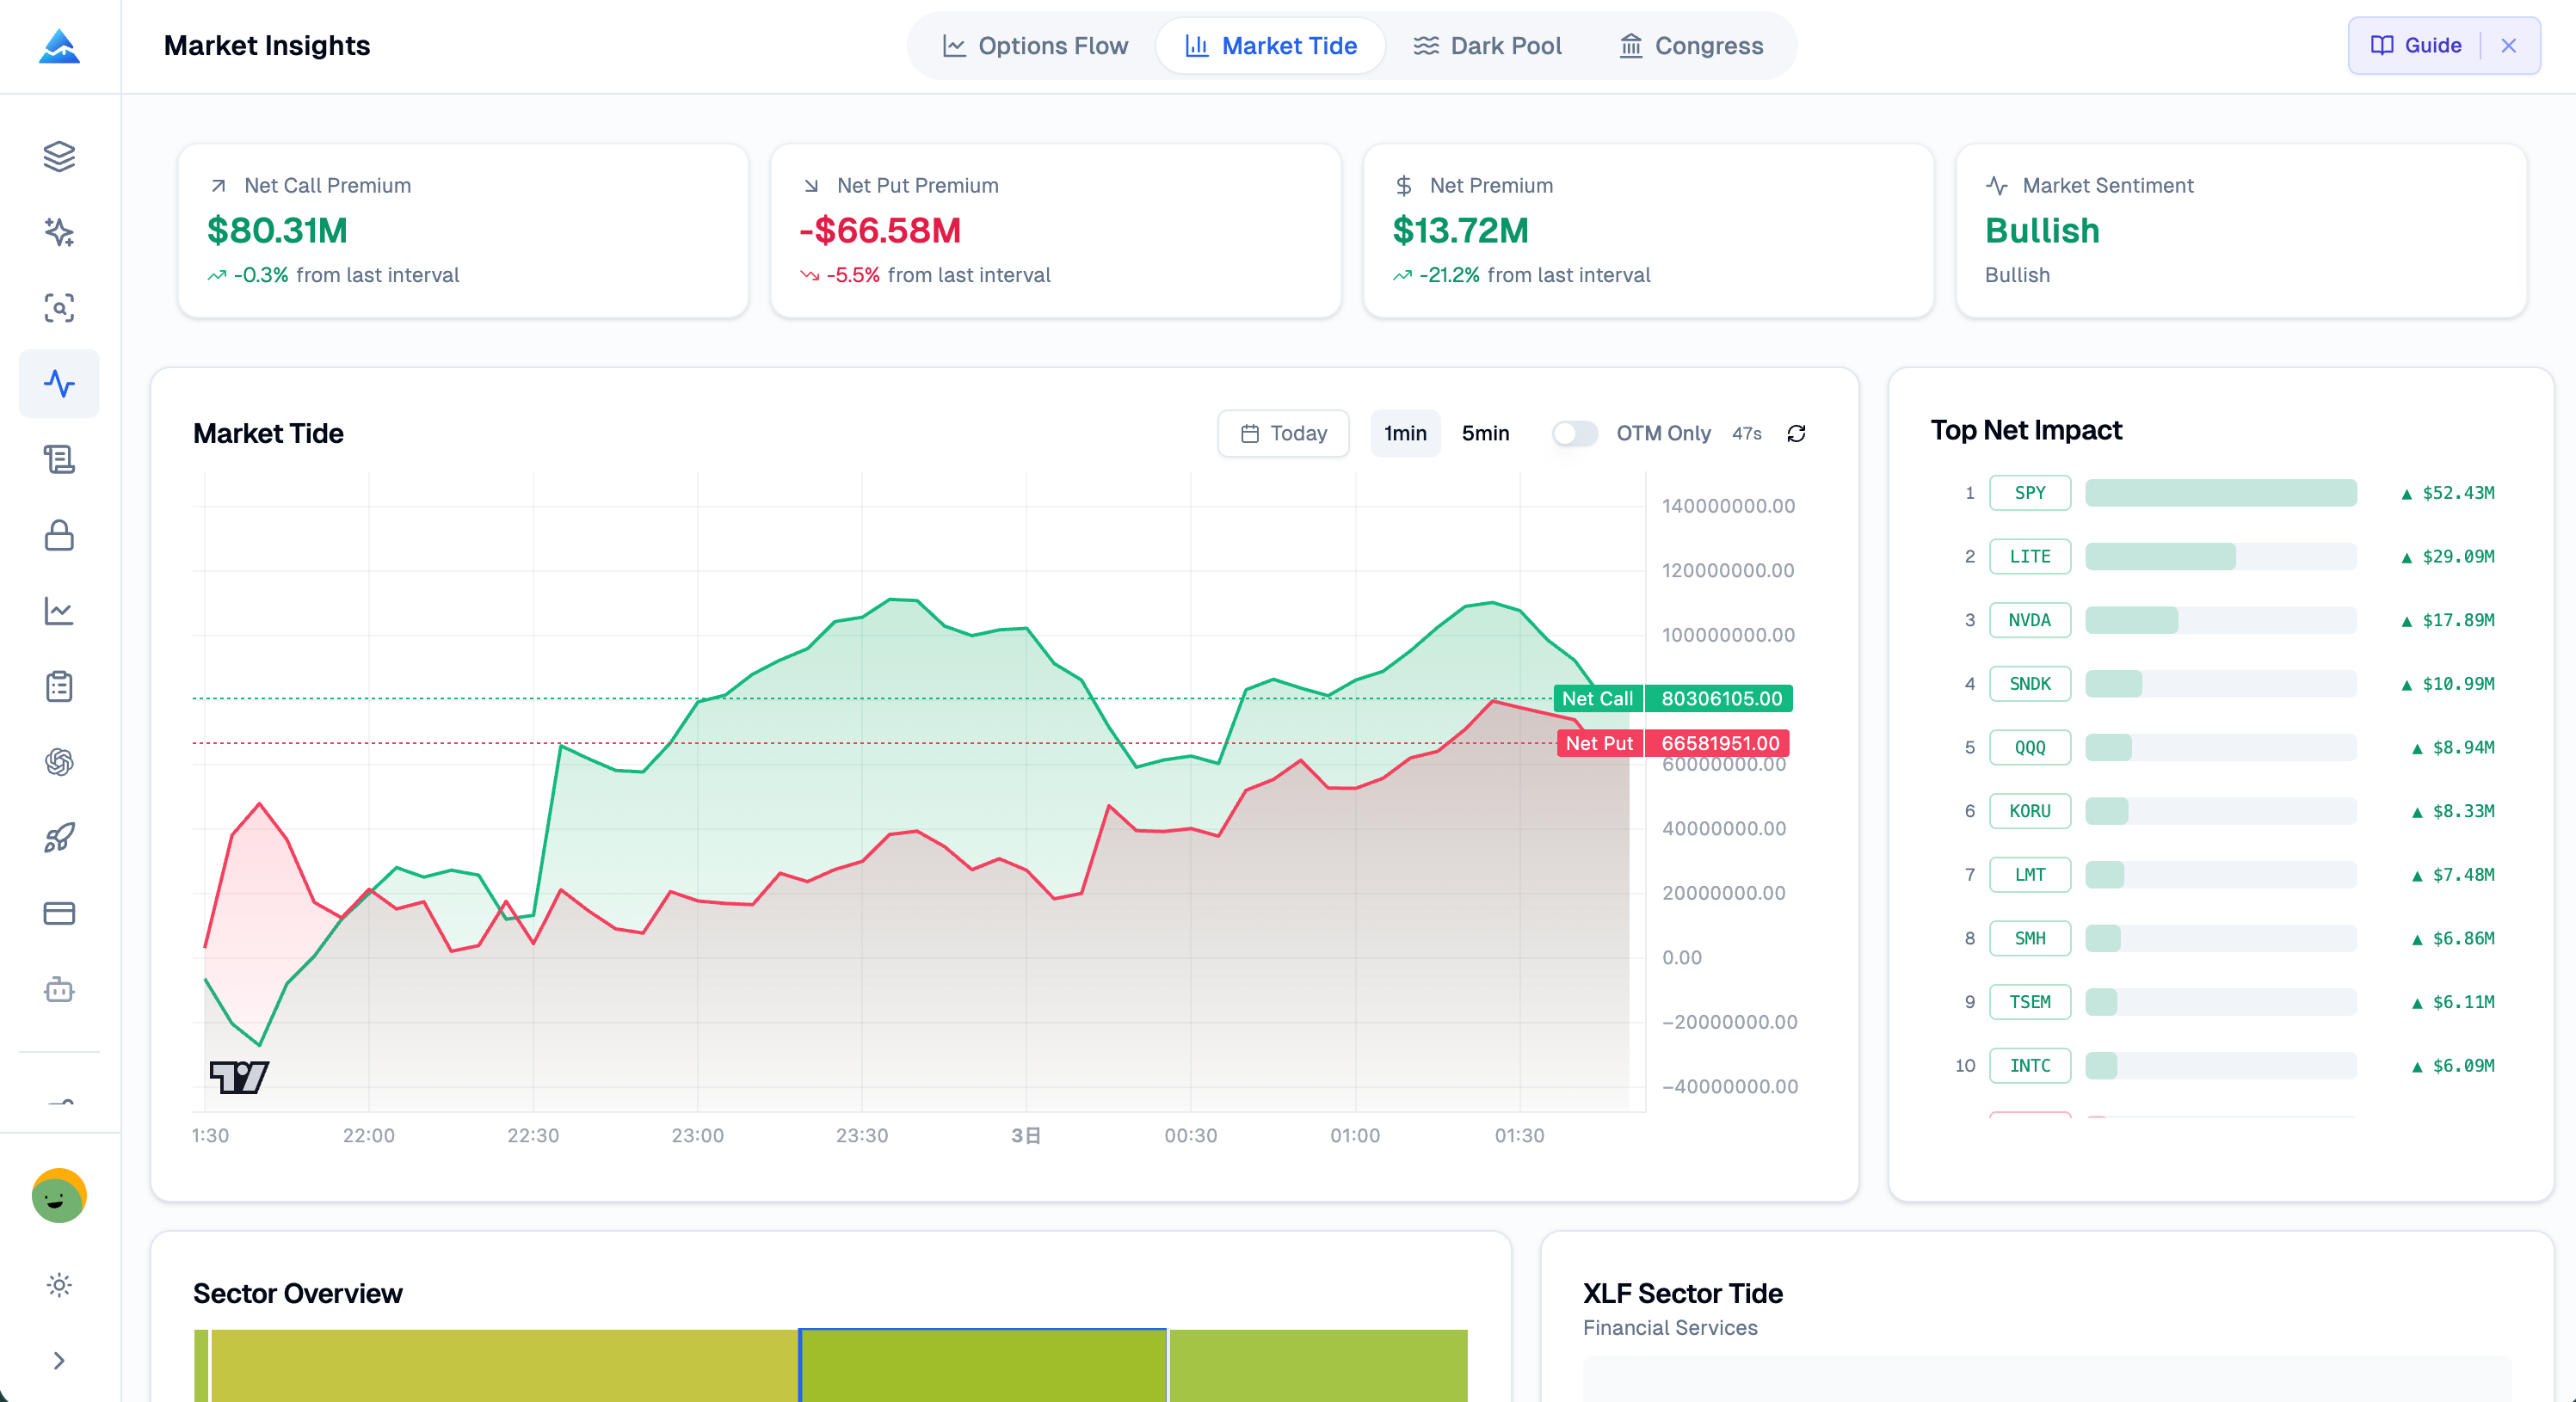
- Net premium time series: Follow the cumulative difference between call and put premium in the selected period.
- Sector heat maps: Compare activity across the major sector ETFs covered by the dashboard.
- Intraday changes: Use the shape and timing of the series to identify when the reported balance changed.
- Historical comparison: Compare the current session with available prior sessions for context.
Use Market Tide as context: check whether a move is broad or concentrated, then confirm contracts and prices in Options Flow. It summarizes reported premium, not all market positioning.
How does Dark Pool data work?
Dark Pool surfaces reported large equity trades, price levels, and distribution over time. It shows where displayed off-exchange volume clustered, but a print alone cannot prove accumulation, distribution, support, or resistance.
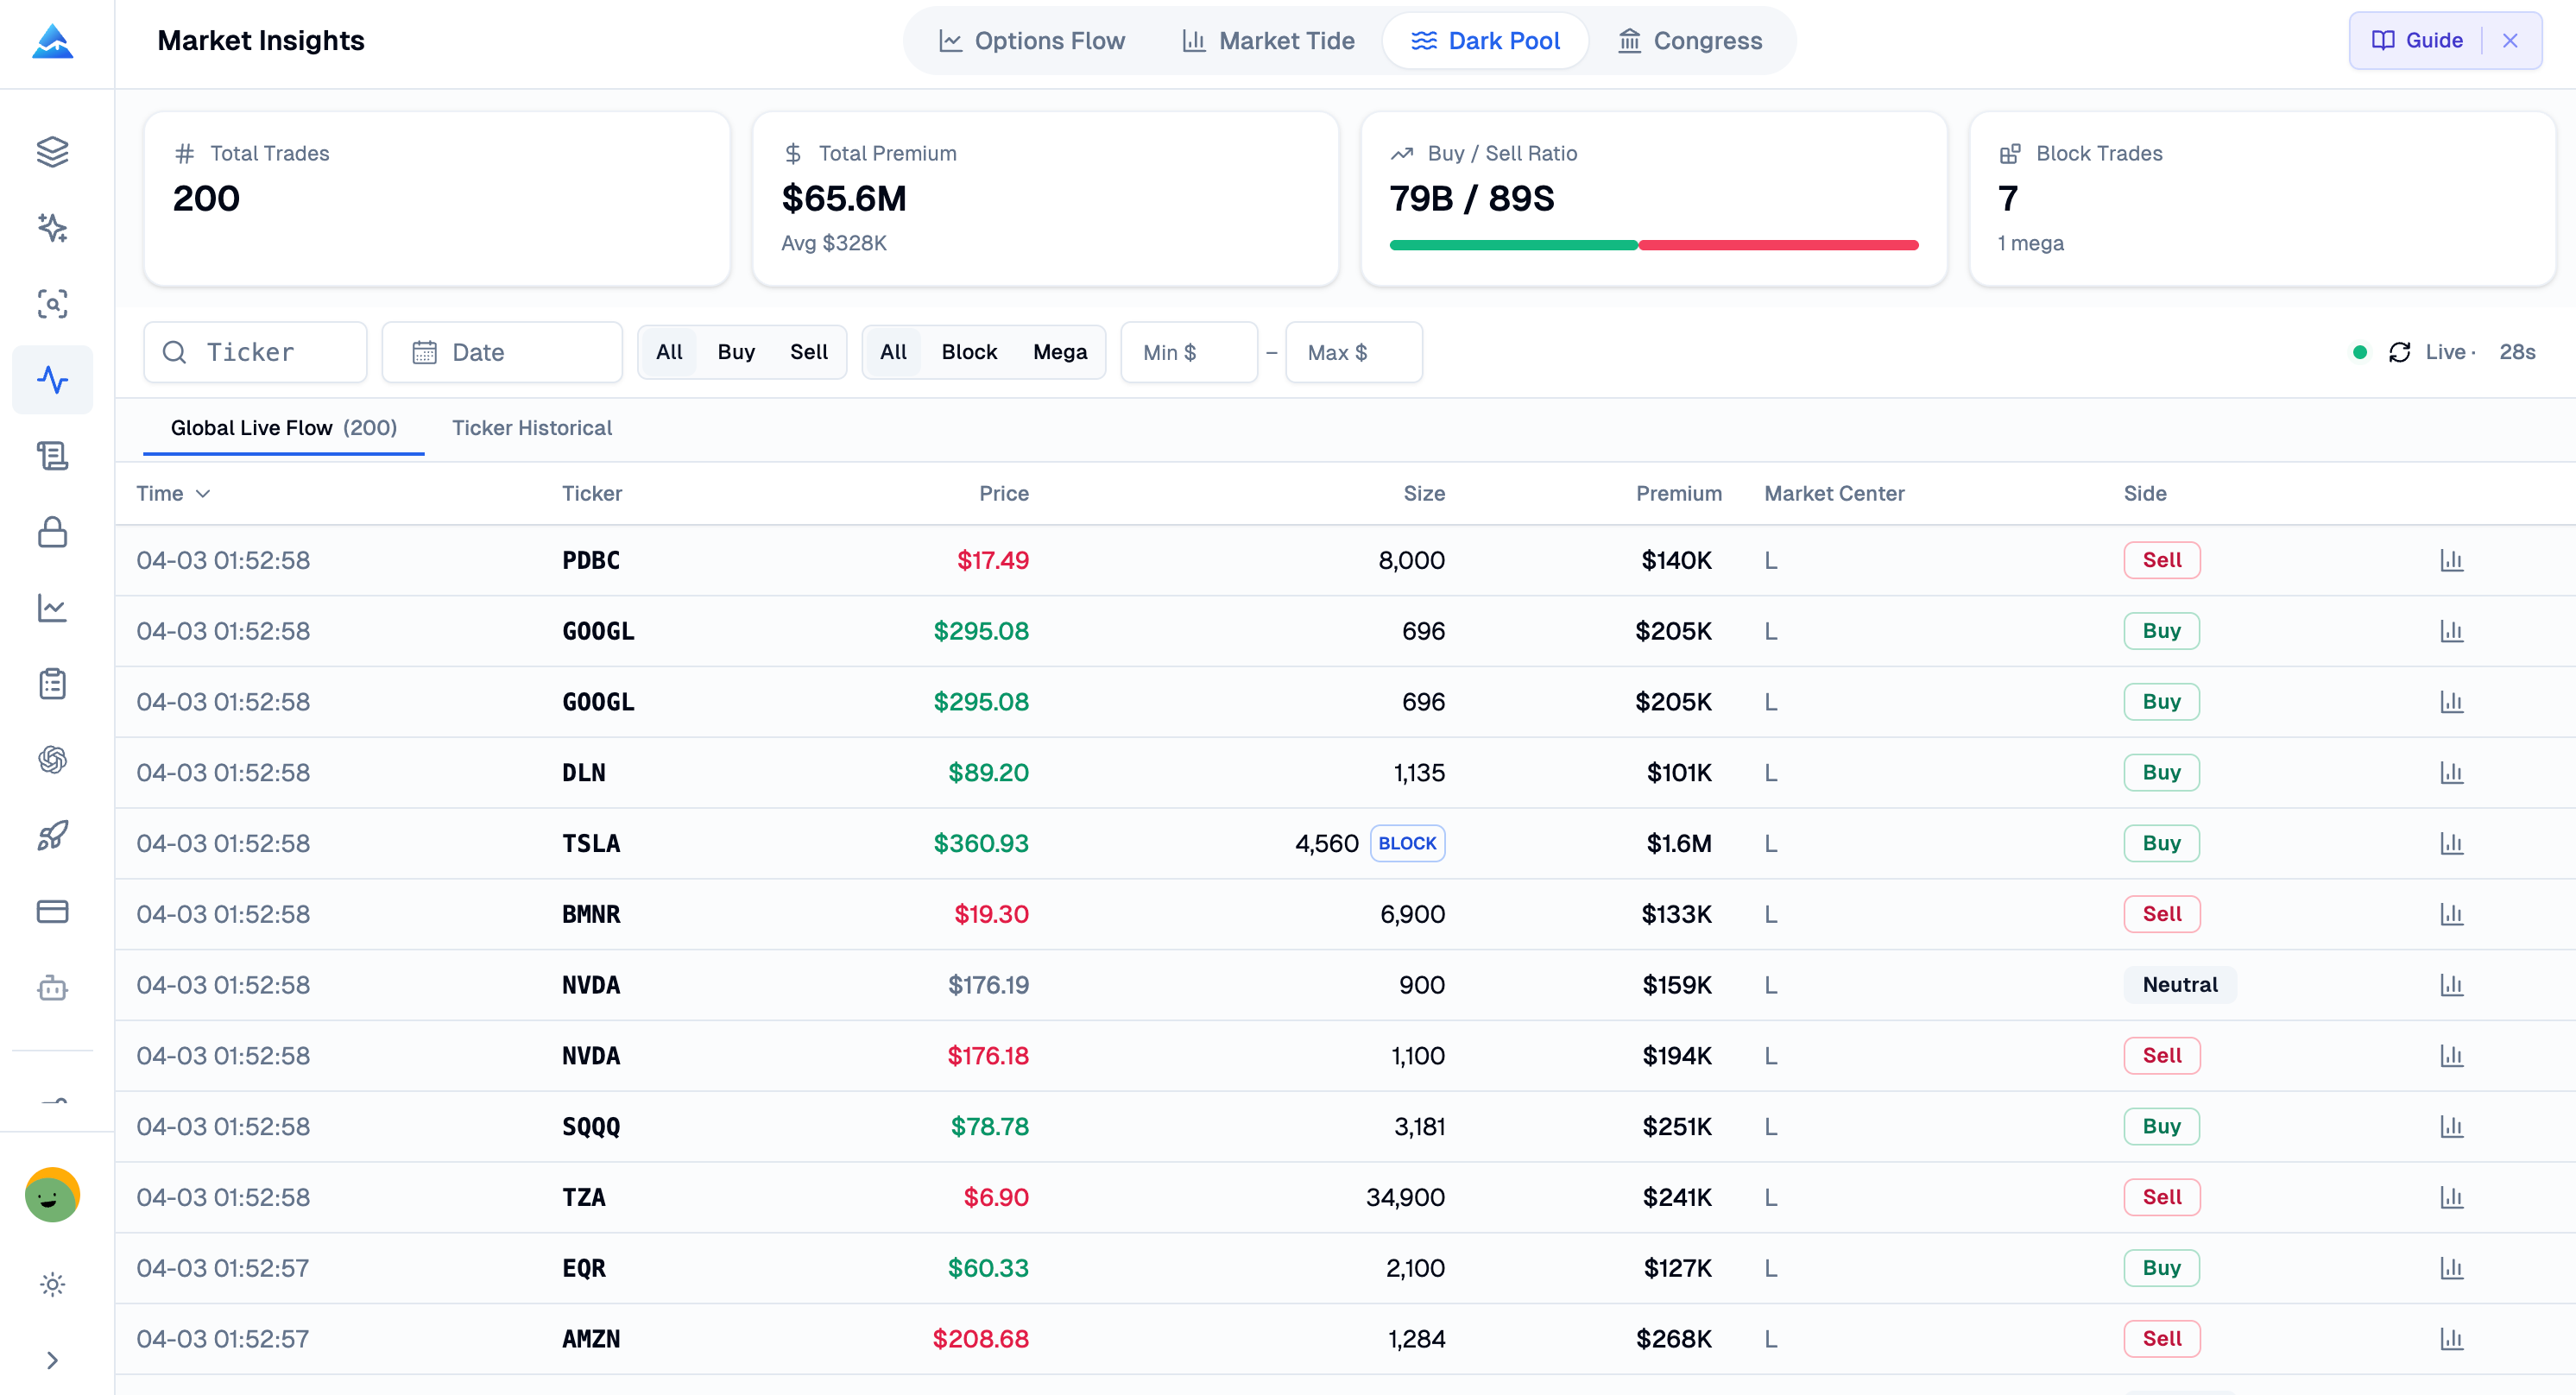
- Block trade tracking: Review reported price, size, venue context, and timestamp when available.
- Volume distribution and point of control: Locate price levels where the displayed dark pool volume is concentrated.
- Trade-size tiers: Narrow the view with tiers such as $1M+, $5M+, or $10M+ when available.
- Multi-session patterns: Compare dark pool data across sessions before describing a pattern as sustained buying or selling.
Coverage depends on the data source and reporting process. Treat records as observations, cross-check price and volume, and do not infer a participant's identity or future action from a venue label.
What does the Congress trading tracker include?
Congress organizes public trade disclosures from U.S. senators and representatives. It is not a live feed of every transaction because filings can arrive after the underlying trade.
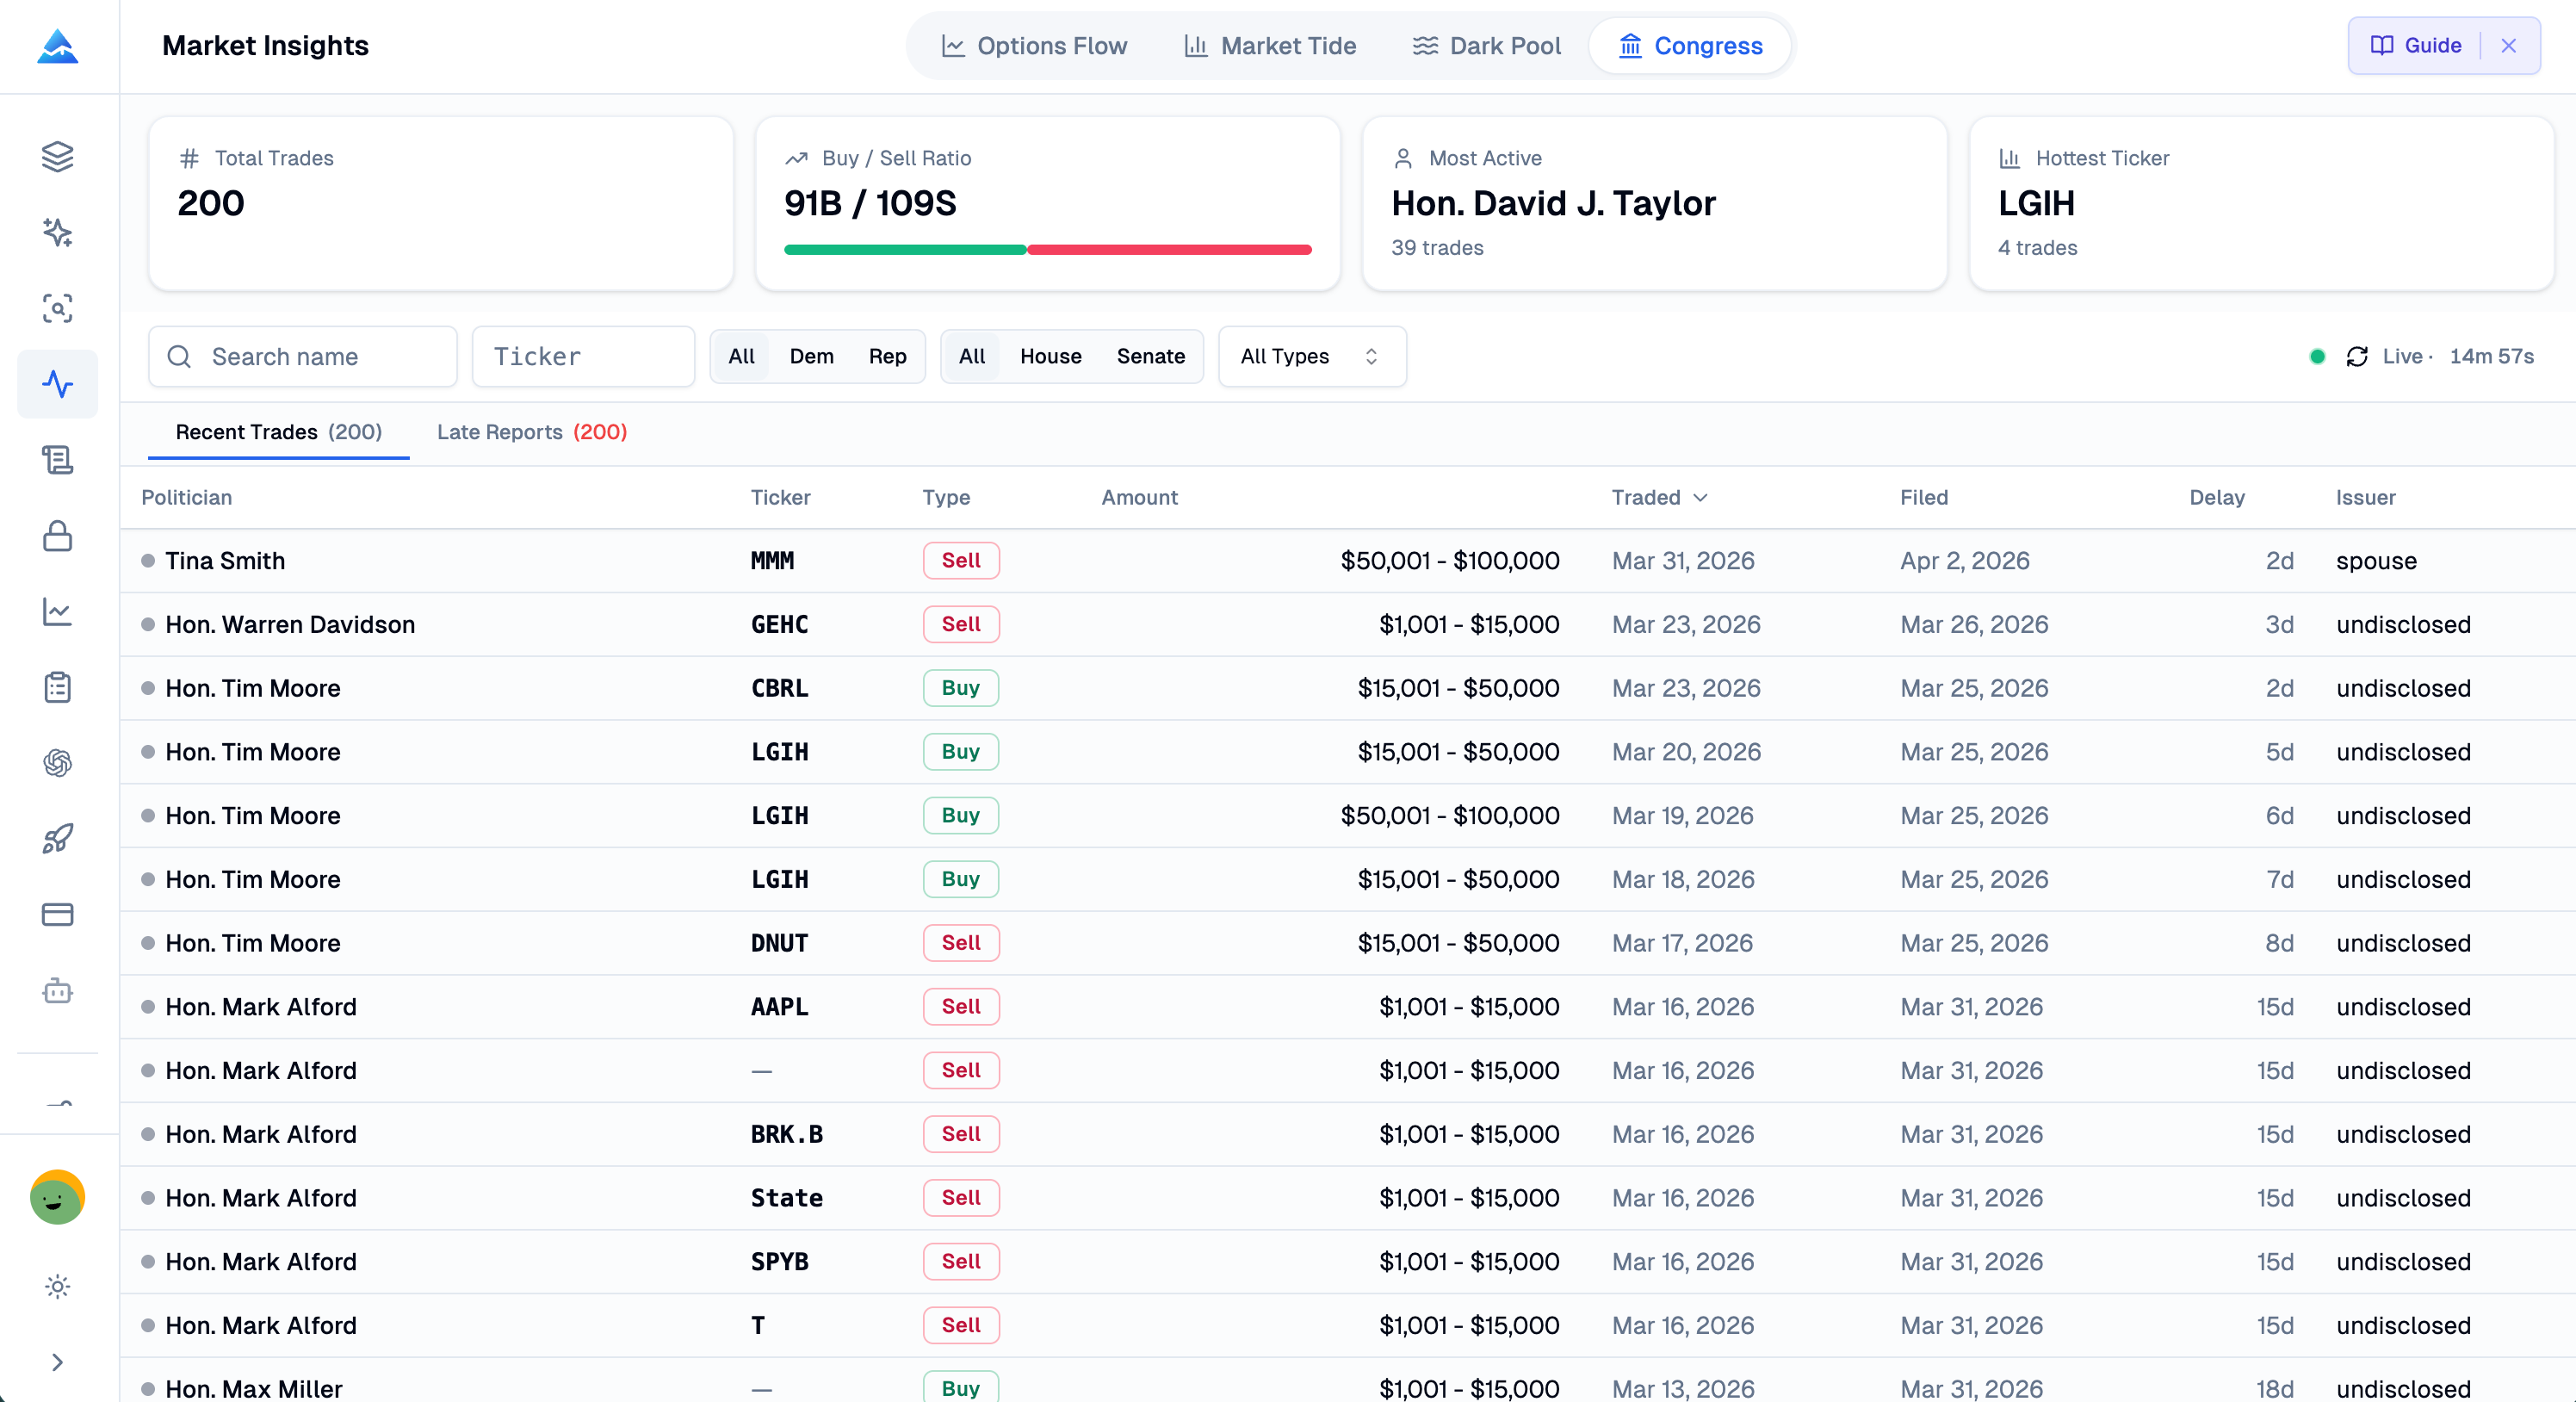
- Recent filings: Review buy and sell disclosures as public STOCK Act filings become available.
- Late-filing flag: Identify disclosures filed more than 45 days after the transaction for additional review.
- Net-impact ranking: Compare the displayed net buy or sell position by member within the available records.
- Member search: Search disclosed activity from covered senators and representatives.
Use transaction date, filing date, security, and amount range together. A disclosure does not reveal the member's full portfolio or reason for the trade, and it is not a performance signal.
How should you interpret Market Insights data?
Interpret the dashboard descriptively: record what it reports, when it was reported, and which alternatives remain.
| Check | Question to answer |
|---|---|
| Source and time | Which module produced the observation, and what timestamp or filing date is shown? |
| Scope | Is the result a single contract, ticker, sector, venue, member, or a broader aggregation? |
| Alternatives | Could the activity be a hedge, spread, roll, closing trade, or delayed disclosure? |
| Confirmation | Does price, volume, chart structure, or another module support the same observation? |
| Risk | What would invalidate the interpretation, and how much exposure is acceptable? |
For technical context, use AI Chart Analysis. For a record of the decision and outcome, use Trading Journal. Neither converts reported activity into a guarantee.
Access and data coverage
Full Market Insights access currently requires an Expert plan. Check the in-app access message and pricing page for current limits, history, and coverage. Update schedules differ by module: market-data reporting for options and dark pool, the selected period for Market Tide, and public disclosure timing for Congress.
Market Insights FAQ
Does Market Insights identify who is behind an options or dark pool trade?
No. The dashboard displays reported trade attributes and calculated summaries. It cannot establish the participant's identity, hedge, or intent from a print or score.
Is the Congress trading tracker real time?
No. Congress results appear as public disclosures become available, and the filing date can be later than the transaction date. Treat the disclosure timestamp as part of the evidence.
Does Market Tide predict the market direction?
No. Market Tide summarizes the selected net premium flow and sector activity. It can describe a reported change in flow, but it cannot guarantee or forecast a future price move.
What does the Expert plan include?
The current product access message identifies Expert as the requirement for full Market Insights access. Plan limits and data coverage can change, so confirm the entitlement in the app and on the pricing page.
Can I use one module without the others?
Yes. Choose a single module from the Market Insights workspace, then add another module only when it helps confirm the same observation. Each module has its own data type, filters, and reporting limitations.
Custom Stock Screener
Use Pineify's custom stock screener to compare technical fields across stocks, crypto, and ETFs with collections, timeframes, sorting, and 60-second refresh.
Visual Pine Script Editor
Build TradingView indicators, strategies, and screeners with Pineify's visual Pine Script editor. No-code controls generate editable Pine Script V6.