

AI Chart Analysis
Pineify's AI chart analysis interprets stock or crypto screenshots, maps technical levels, and adds risk context without presenting a price forecast.
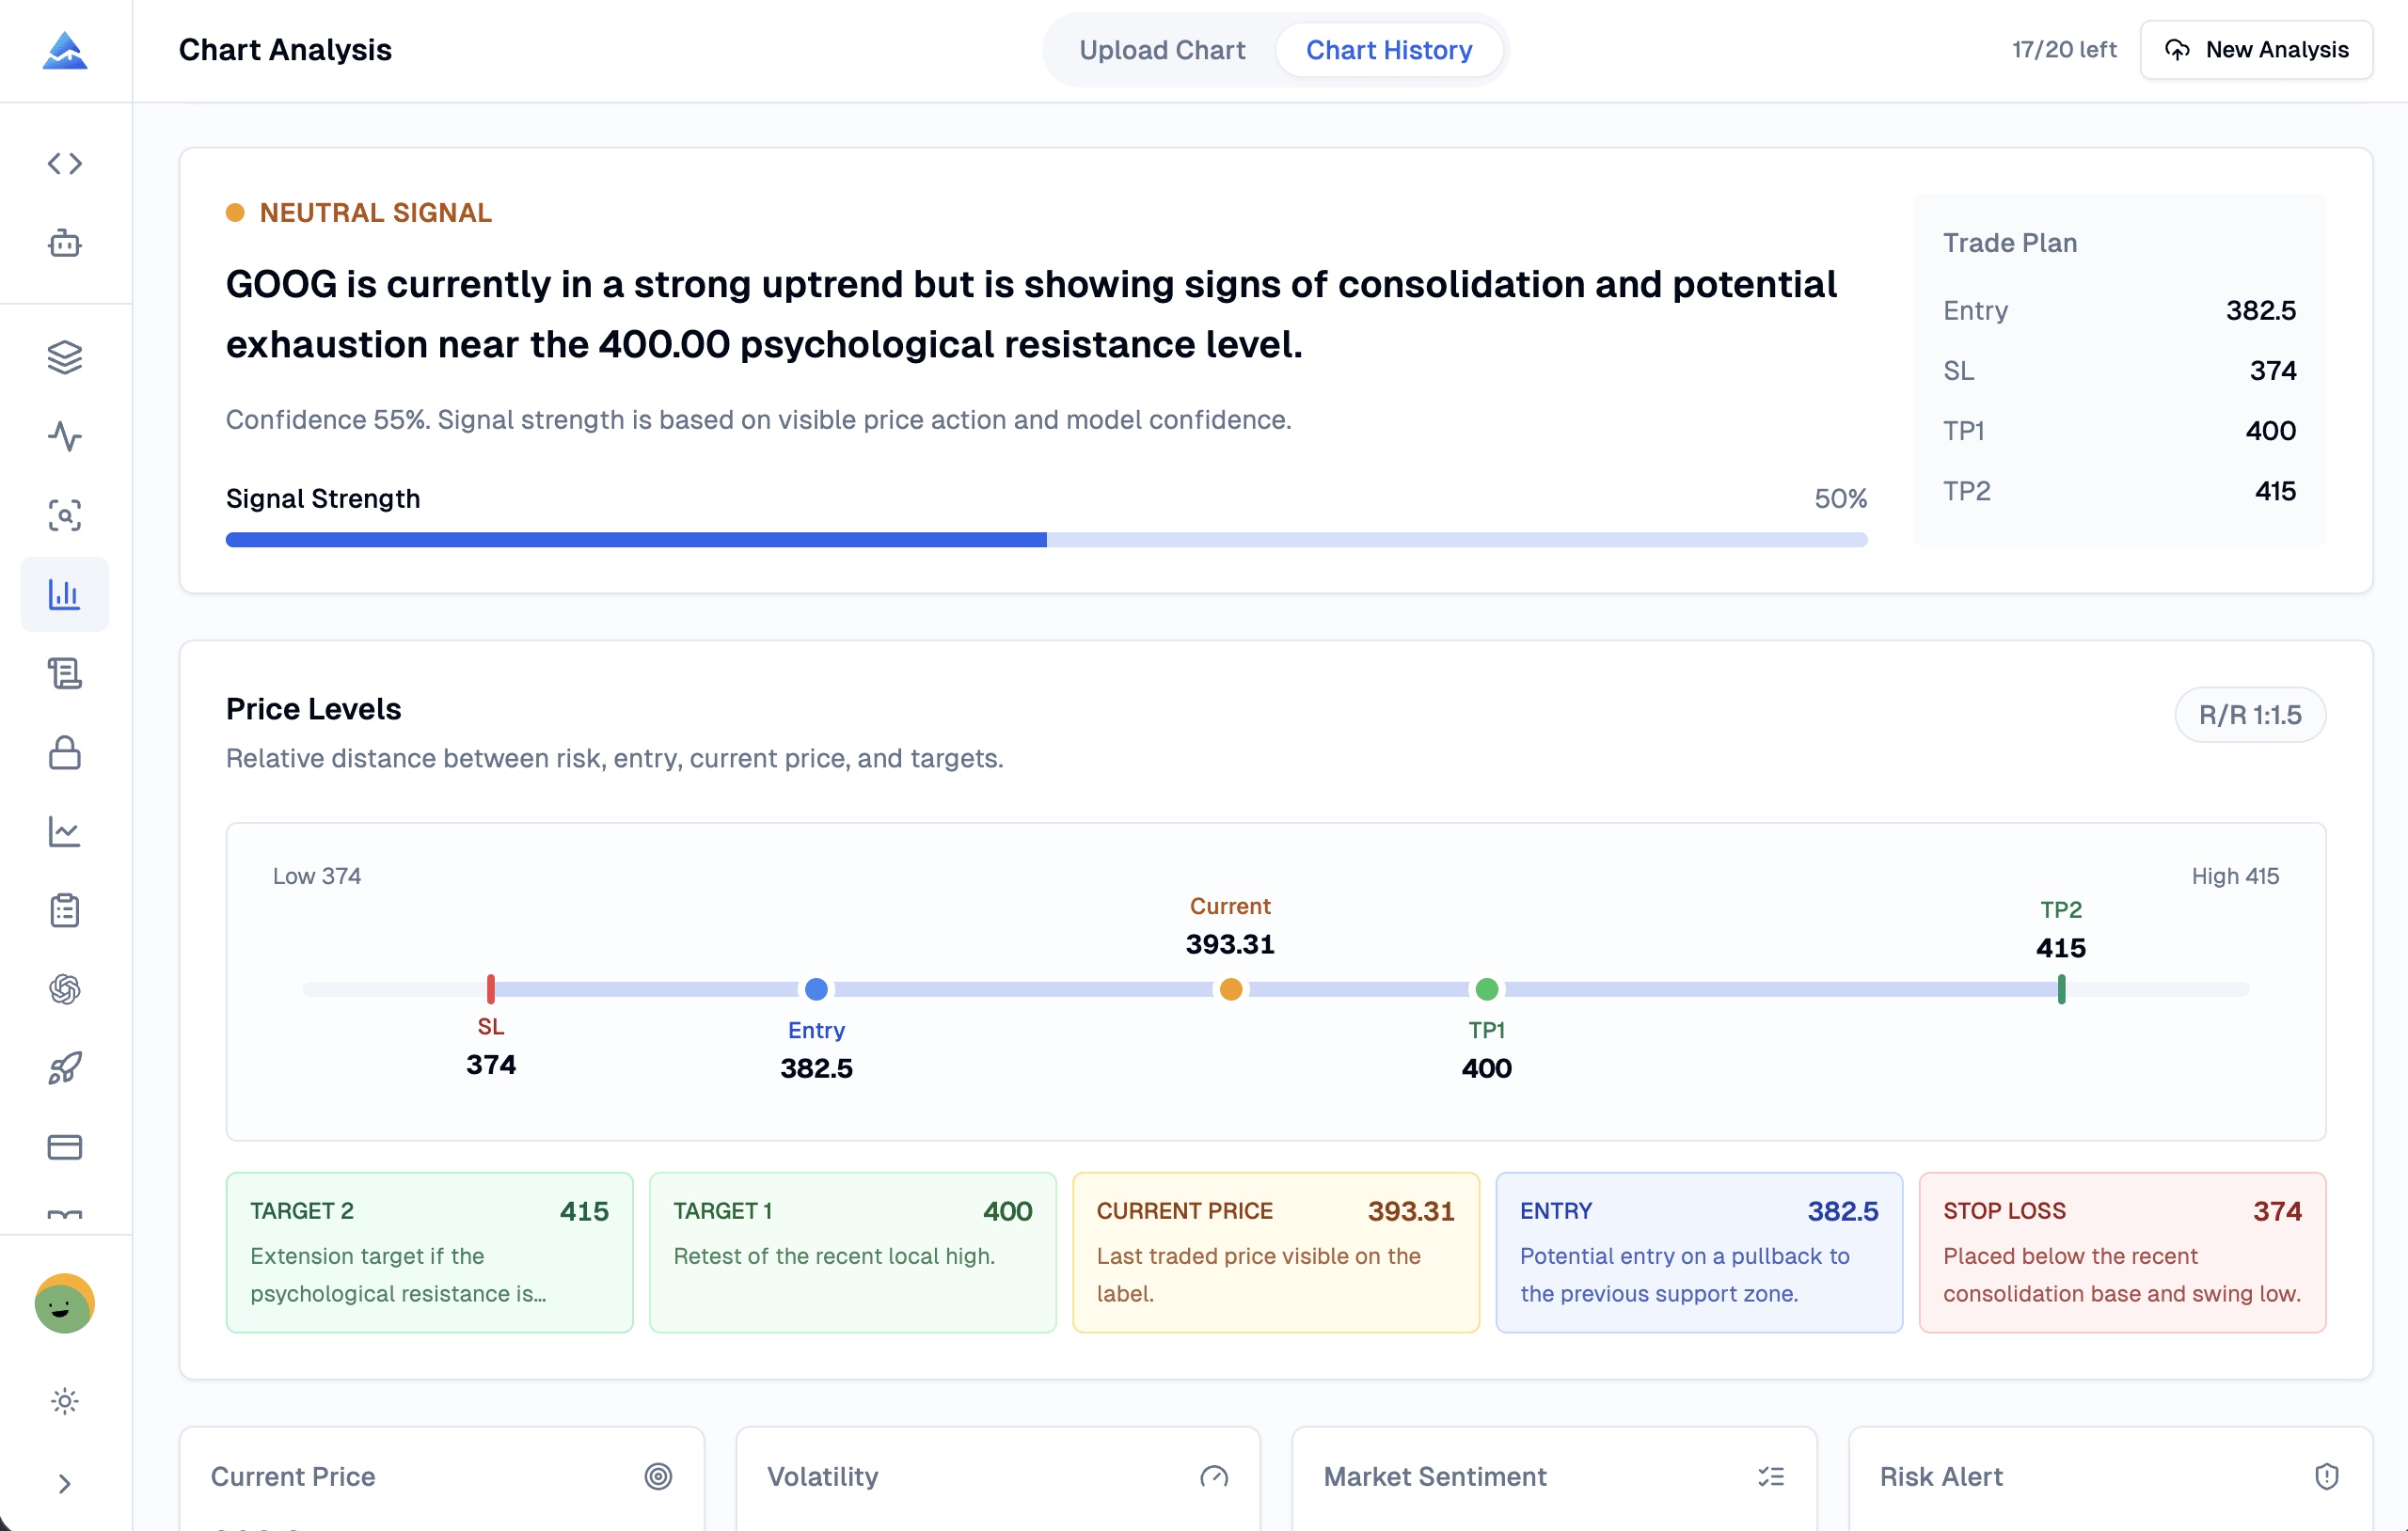
AI chart analysis is the process of reading a chart image for visible market structure, levels, and risk context. Pineify's AI Chart Analysis applies that workflow to one candlestick screenshot: it can identify a readable symbol and timeframe, describe trend, and map support, resistance, entry, stop-loss, and target zones. It does not forecast returns.
How do you use AI Chart Analysis?
The shortest workflow is upload, inspect, and verify. A single clean image is enough to start, so you do not need to enter a separate symbol or timeframe before the analysis.
- Capture one candlestick chart screenshot with price action and the price axis visible.
- Open AI Chart Analysis and upload the image.
- Review the directional bias, technical rationale, support and resistance, entry area, stop-loss, targets, confidence, and risk notes.
- Save or revisit the result in analysis history, then compare the thesis with later price action.
What does chart screenshot analysis return?
Pineify's chart screenshot analysis turns visible chart evidence into a structured review. The result depends on what the image actually shows, so a clear chart can provide more useful context than a cropped or obstructed one.
| Visible chart evidence | Possible analysis output | How to use it |
|---|---|---|
| Symbol, timeframe, candles, and price action | Extracted symbol or timeframe when readable; trend and market structure | Check that the extracted context matches the uploaded chart |
| Swings, ranges, and reaction areas | Support and resistance zones | Treat zones as areas for review, not exact execution prices |
| A clear setup with enough context | Entry area, invalidation, stop-loss, and take-profit zones | Define what would confirm or invalidate the idea before acting |
| Directional and volatility clues | Directional bias, confidence, and risk or reward context | Compare the rationale with your own plan and position sizing |
| An unclear or conflicting image | Caveats and low-confidence warnings | Improve the screenshot or leave the setup untraded |
This format is useful when you want a repeatable second look at a chart rather than a free-form explanation. It also makes the reasoning easier to save, compare, and revisit as new price action develops.
How should you prepare a screenshot?
Input quality is the main constraint on any stock chart analyzer that works from an image. Pineify can only interpret details that are legible in the uploaded screenshot.
- Use a sharp, uncropped screenshot instead of a photo of a monitor.
- Keep candles, the price scale, and relevant overlays readable.
- Avoid menus, drawings, or overlapping indicators that cover the chart.
- Upload one chart per analysis so the symbol and timeframe are not ambiguous.
If the symbol or timeframe is too small to read, the analysis may describe the visible structure without reliably identifying the instrument. Re-upload a clearer image when the result includes a low-confidence warning or when key levels are hidden.
When is this AI technical analysis useful?
AI technical analysis is most useful for organizing observations before you make an independent decision. You can use it to check whether a visible trend, range, support zone, or resistance zone is reflected in your own notes, and you can compare the recorded thesis with later market behavior.
It is not a replacement for a live chart, order-book data, fundamental research, or a tested trading plan. If you need broader market context, compare this image-based review with Market Insights, or use AI Stocks & Options Picker for a separate research workflow. For a historical strategy review, see Backtest Deep Report.
What are the limits of AI Chart Analysis?
The feature analyzes the submitted image, not future market data. Mapped levels, directional bias, and confidence describe the visible evidence at the time of analysis; they do not guarantee an outcome, predict future returns, or provide financial advice. Confirm the setup independently and apply your own risk controls before placing any trade.
AI Chart Analysis FAQ
Does AI Chart Analysis need a symbol or timeframe field?
No separate fields are required. The feature attempts to identify the symbol and timeframe from the screenshot when those details are readable, so the chart should include the relevant labels and price axis.
Can it analyze crypto charts as well as stock charts?
Yes. The workflow accepts a readable stock or crypto candlestick chart screenshot. The quality of the returned context still depends on the image's clarity and the amount of visible price action.
Does the result tell me when to buy or sell?
It can describe directional bias and, when the setup is clear, map entry, invalidation, stop-loss, and target zones. Those are analytical reference points, not instructions or guarantees, and you remain responsible for validating the idea and managing risk.
What should I do if the analysis is low confidence?
Check that the screenshot is sharp, uncropped, and free of covered candles or labels. Upload one chart with a readable price scale and relevant overlays, then compare the revised result with your own analysis before using it.
AI Stock Picker
Learn how Pineify's AI stock picker ranks stocks with daily 1-10 scores, fundamentals, charts, news, and options analysis. Review evidence before investing.
Pineify MCP: 40 Research and Journal Tools
Connect AI agents to 40 Pineify tools for code validation, stock research, financial analysis, and bounded workflows over Streamable HTTP.