

TradingView Backtest Report
Analyze a TradingView backtest report from Strategy Tester CSV with 16+ KPIs, nine tabs, 1,000-run Monte Carlo, AI analysis, and Excel export.
A TradingView backtest report is a structured summary of a strategy's historical trades, returns, drawdowns, and risk metrics. Pineify's Backtest Deep Report imports a TradingView Strategy Tester CSV and provides 16+ KPIs, nine report tabs, 1,000 Monte Carlo simulations, and AI-assisted interpretation.
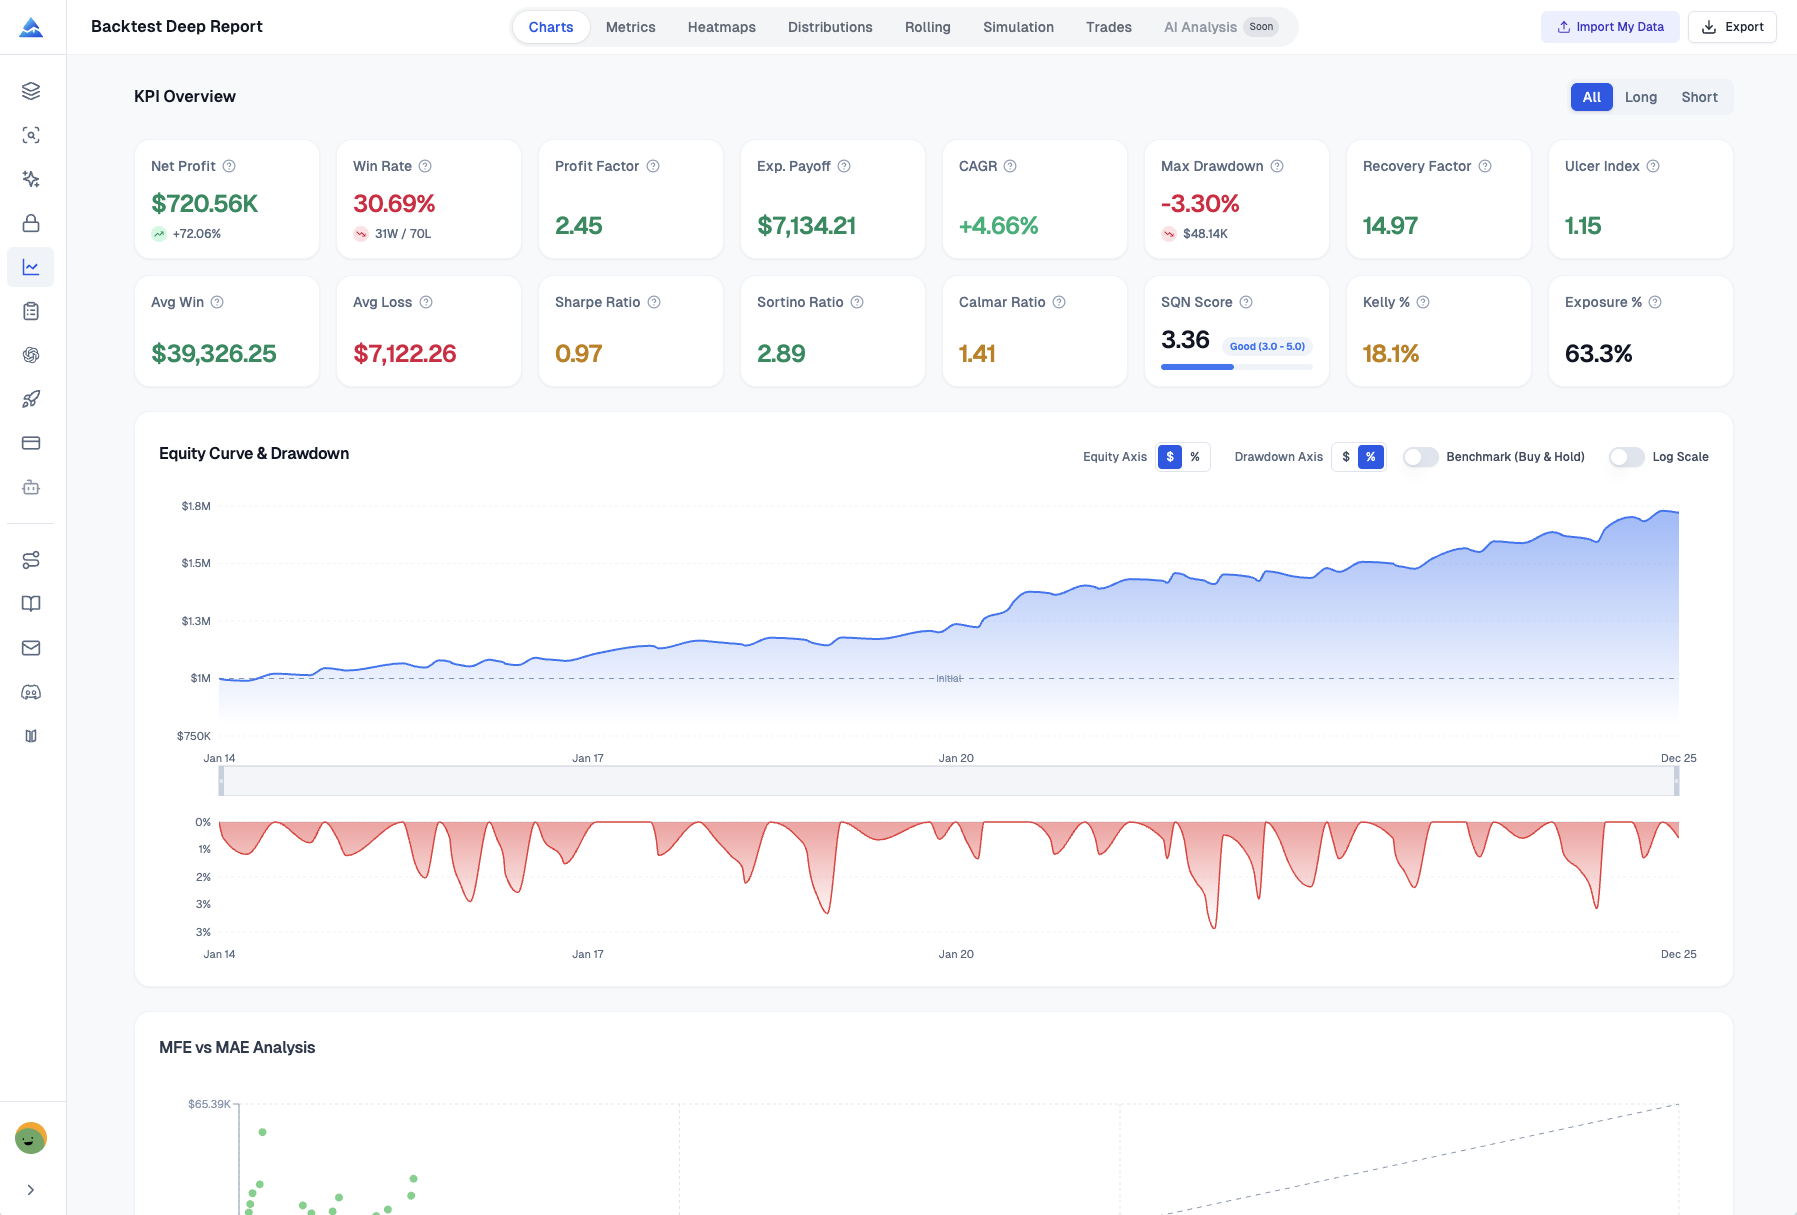
What does a TradingView backtest report include?
It combines return, drawdown, risk, distribution, and trade-level measures. KPI cards support all, long, and short trades.
| KPI group | Examples | What it helps you check |
|---|---|---|
| Profit | Net and gross profit, gross loss, profit factor | Return balance and loss concentration |
| Trade outcomes | Win rate, average and largest win or loss | Frequency and dispersion of outcomes |
| Drawdown | Maximum drawdown, percentage, recovery period | Depth and duration of equity declines |
| Risk adjusted | Sharpe, Sortino, expectancy per trade | Return relative to volatility and downside |
| Distribution | Skewness, kurtosis, percentiles, trade duration | Tail behavior and timing concentration |
Values depend on the imported trade list and report settings. A high value is an observation about the selected history, not a forecast or guarantee.
How do you create a TradingView backtest report from a CSV?
Use the List of trades export from TradingView Strategy Tester, then confirm the assumptions Pineify uses for its calculations. The same workflow can analyze compatible data exported by the Strategy Optimizer.
- Run the strategy in TradingView. Add a Pine Script strategy to a chart, open Strategy Tester, and select List of trades.
- Export the TradingView strategy CSV. Click the download icon in the List of trades panel and save the CSV file locally.
- Open the report and import the file. Open Backtest Deep Report, choose Import My Data, and upload the TradingView strategy CSV. The first load also includes a demo report for exploring the interface.
- Set the calculation inputs. Confirm initial capital, risk-free rate, and whether to include open trades. Review the report tabs, then use Export to create an Excel workbook if you need an offline copy.
Which backtest analysis modules are available?
The product page lists nine report tabs. The summary KPI area is visible across the report, while the core views answer different questions about the same imported sample.
| View | Main question | Outputs to inspect |
|---|---|---|
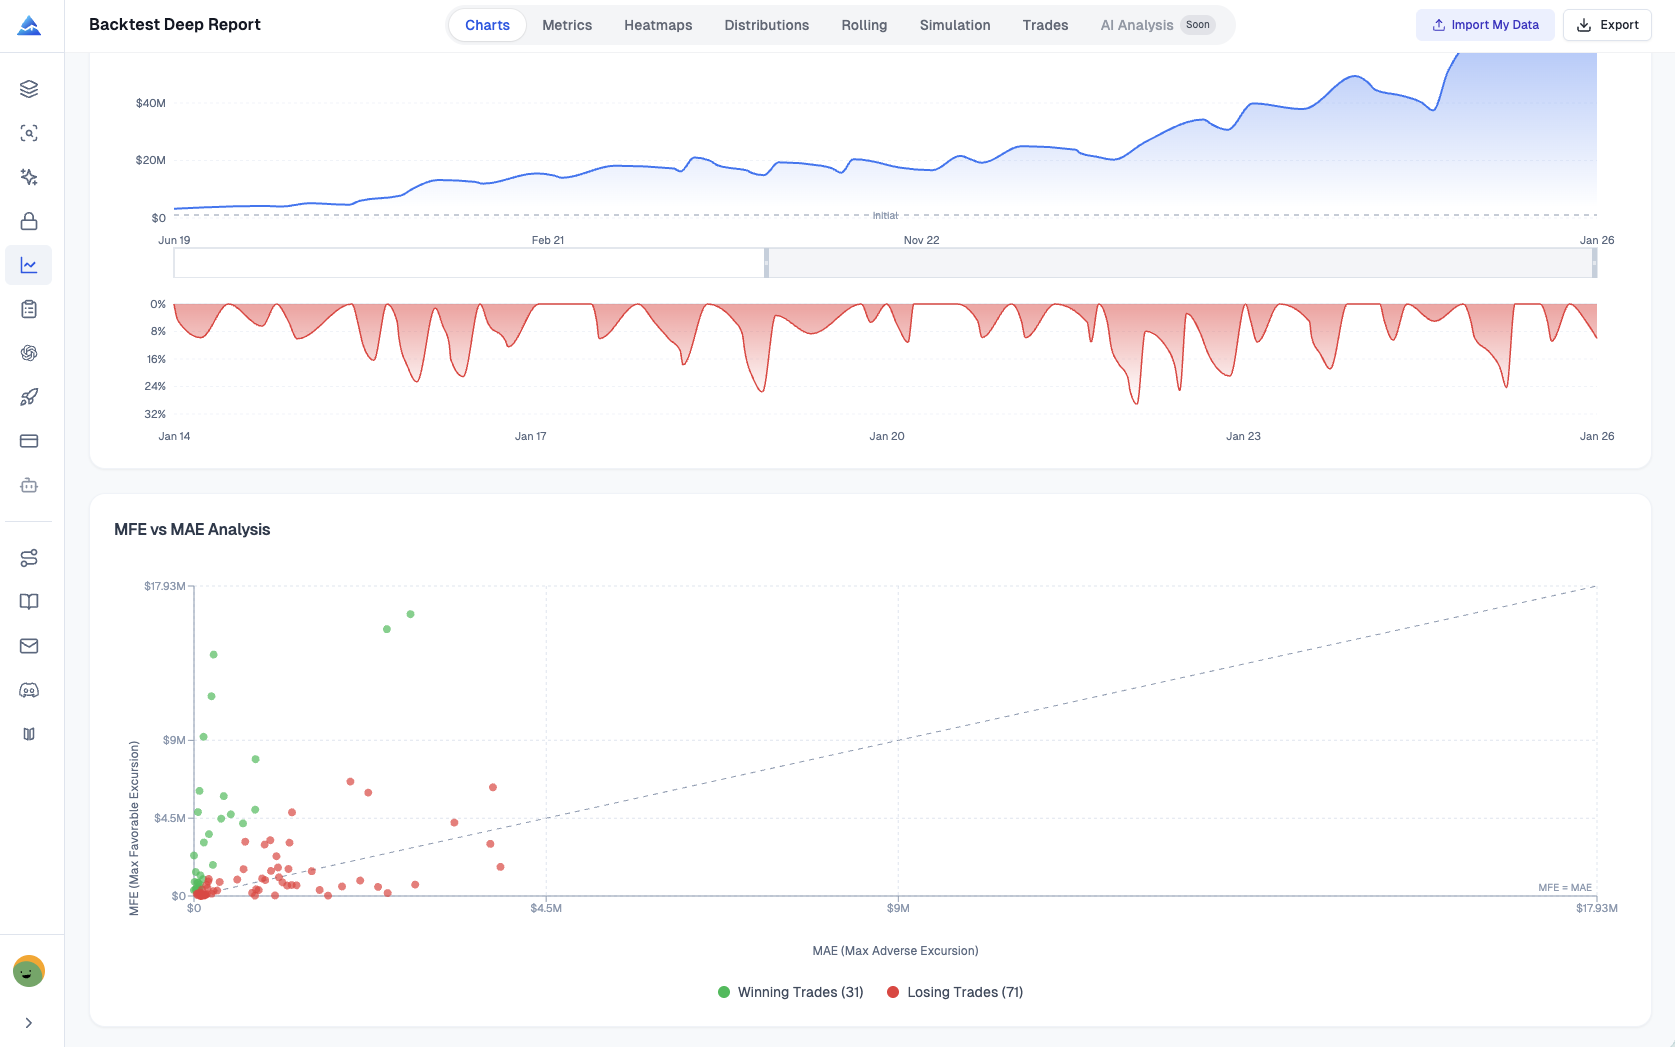
| Charts and MFE/MAE | How did the equity curve and each trade behave? | Equity curve, drawdown periods, maximum favorable excursion, and maximum adverse excursion |
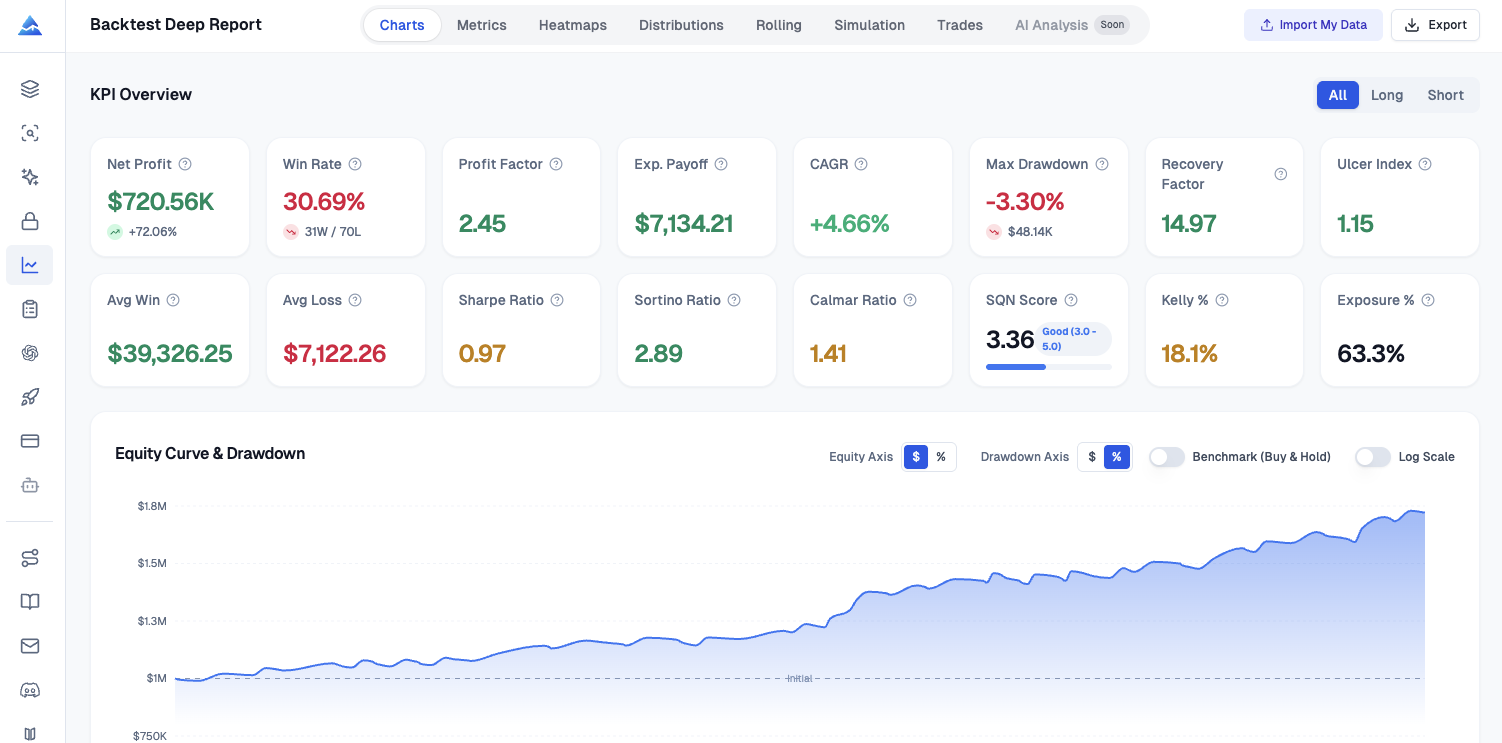
| Metrics | What are the headline results? | 16+ KPIs, with all, long-only, and short-only views |
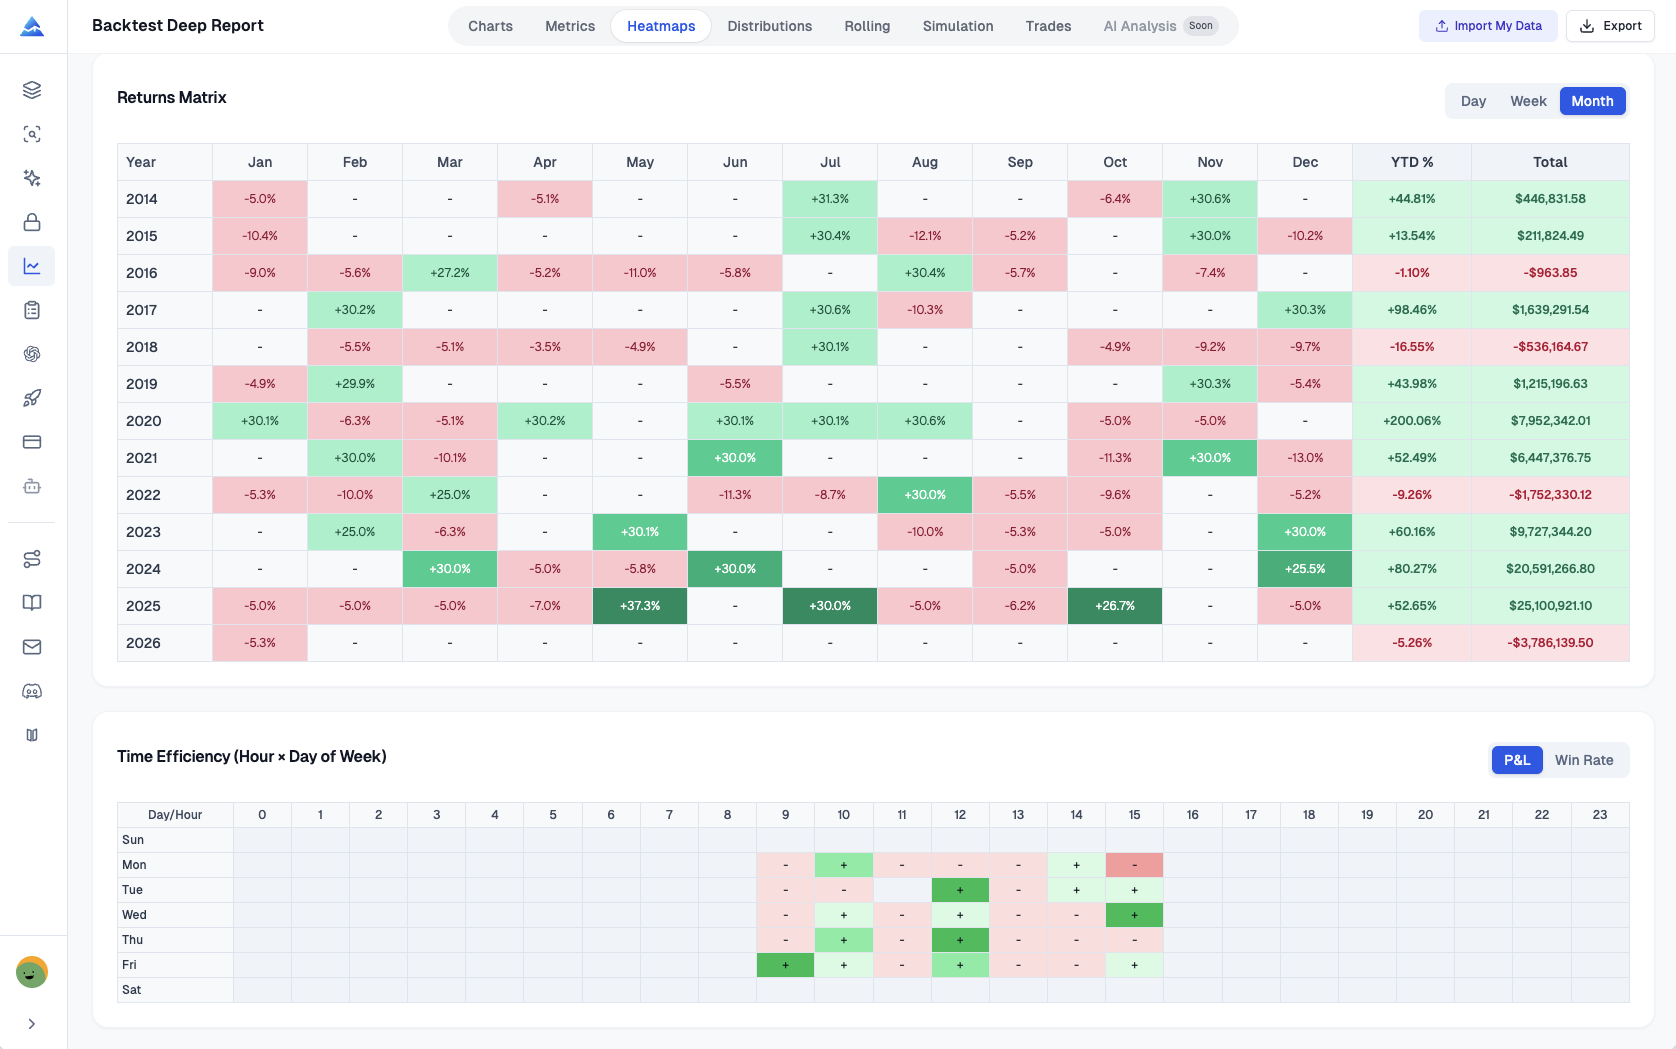
| Heatmaps | When did results concentrate? | Daily, weekly, monthly, and time-efficiency return patterns |
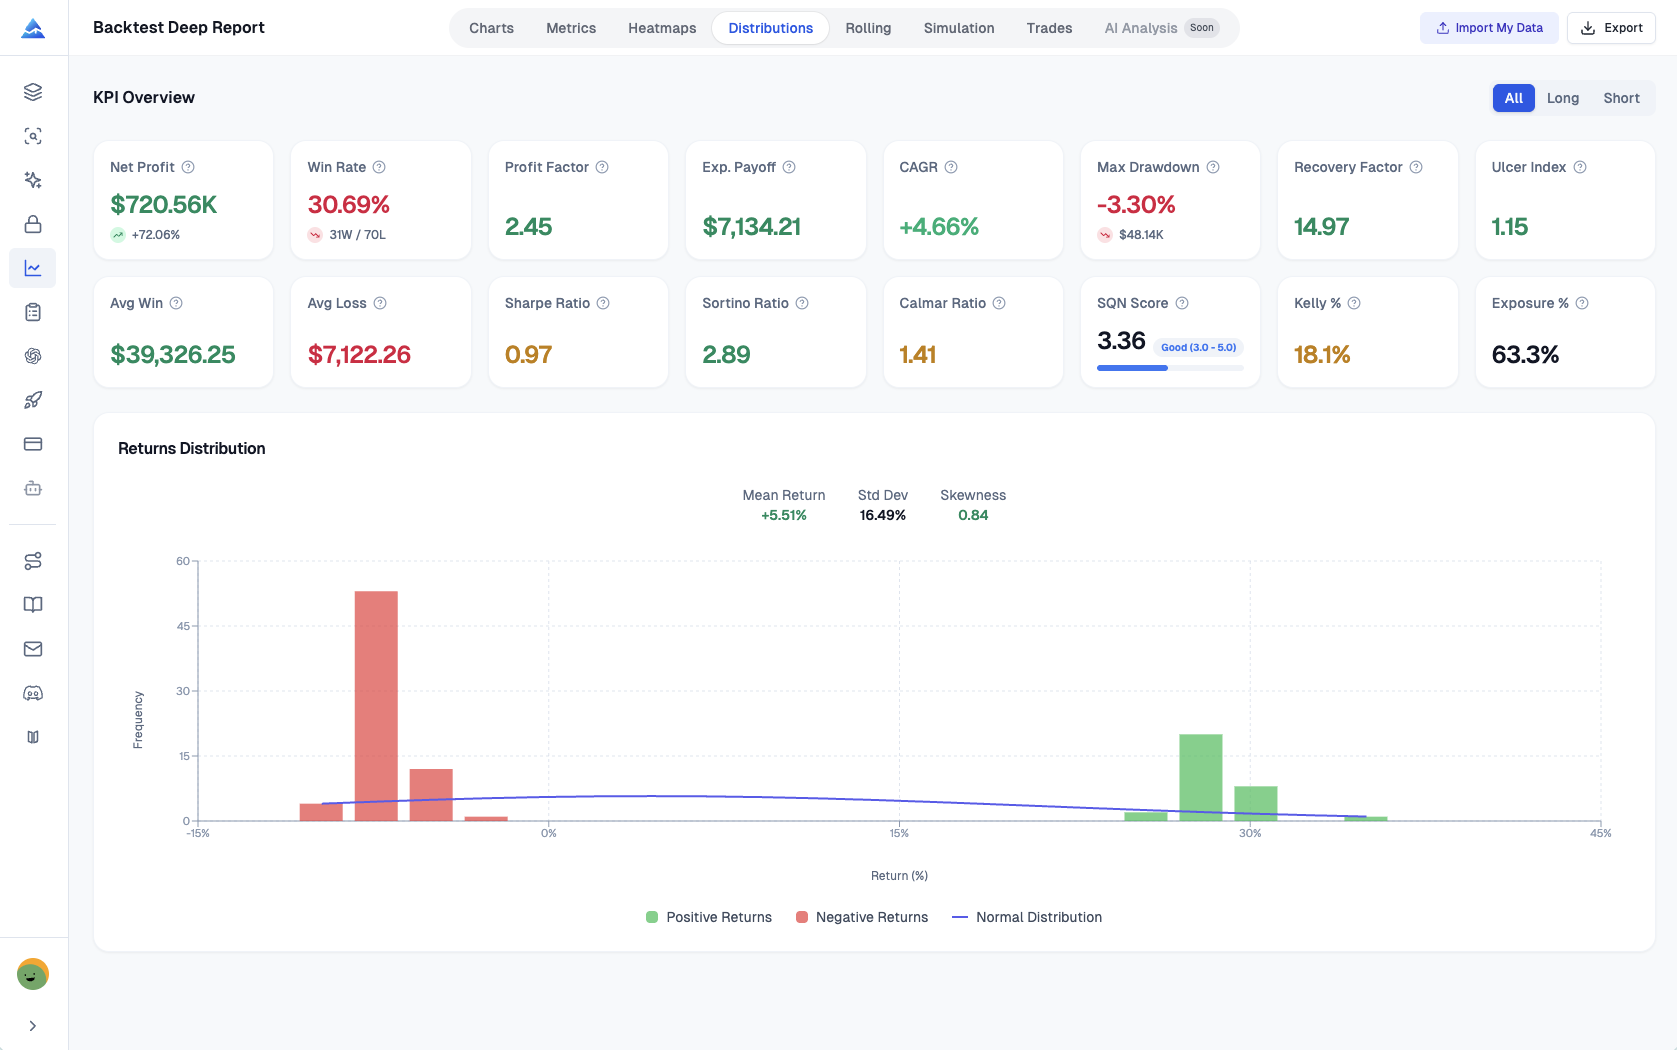
| Distributions | How dispersed are trade outcomes? | Return histogram, normal overlay, percentiles, skewness, and kurtosis |
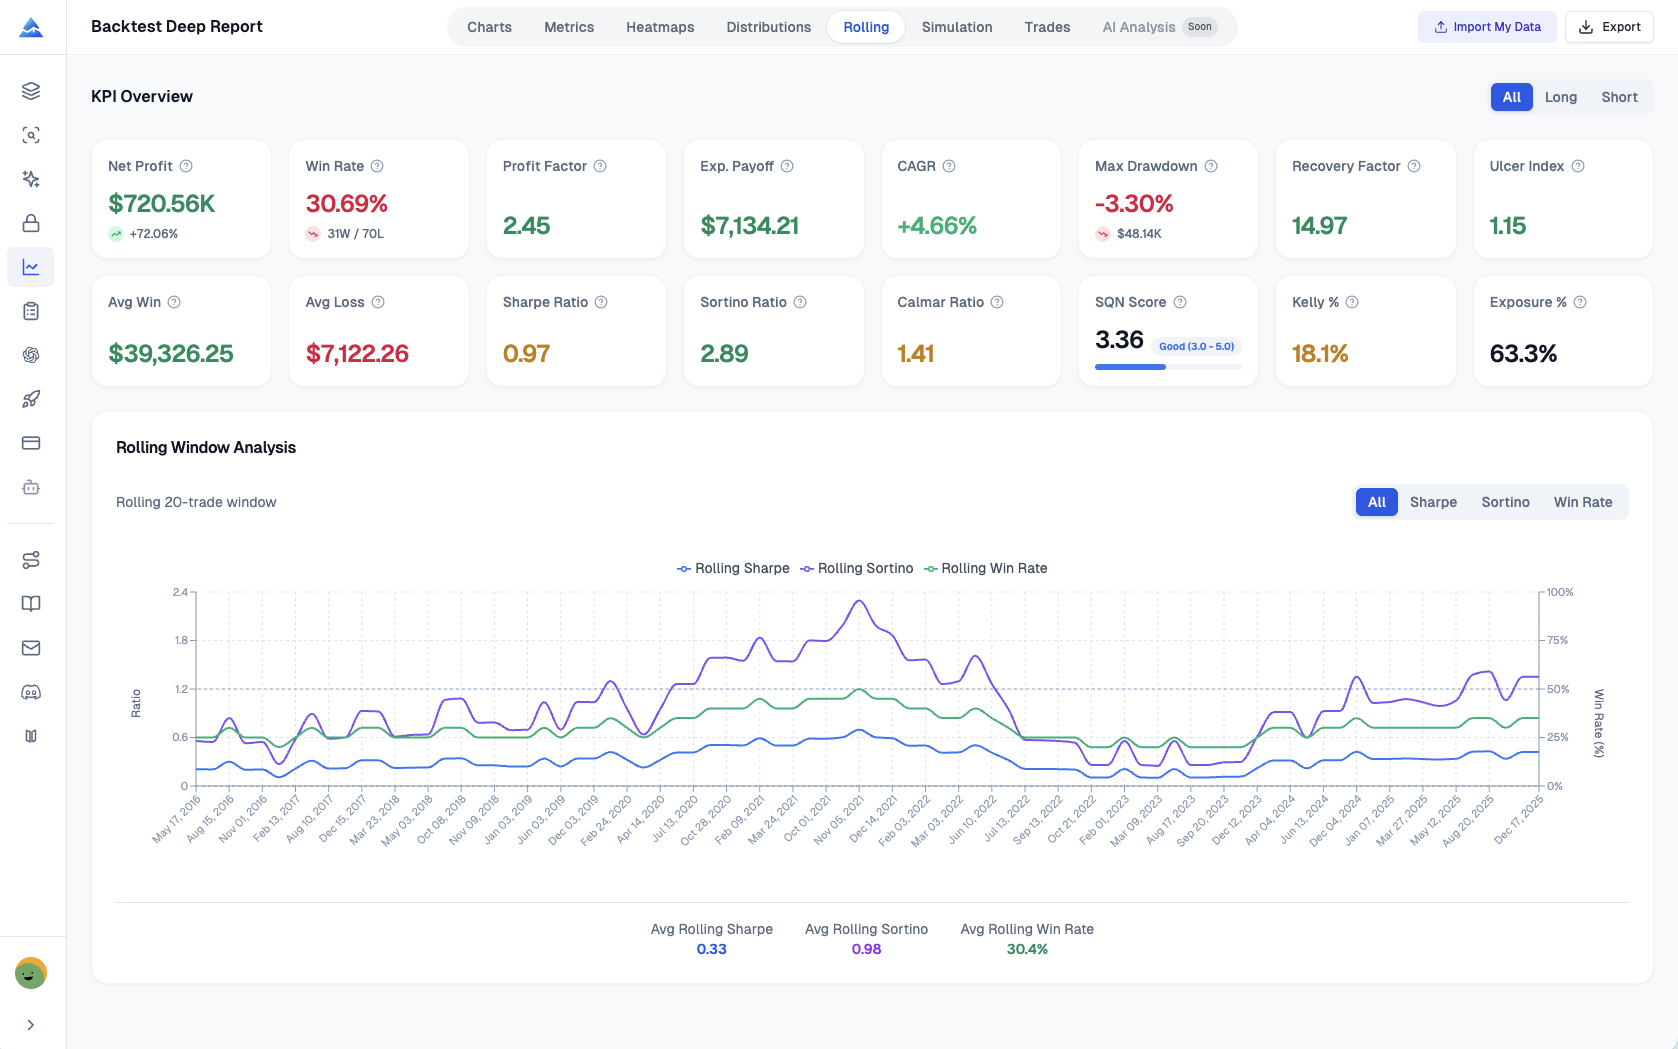
| Rolling | Did performance change through the sample? | Rolling Sharpe, Sortino, and win rate over a configurable trade window |
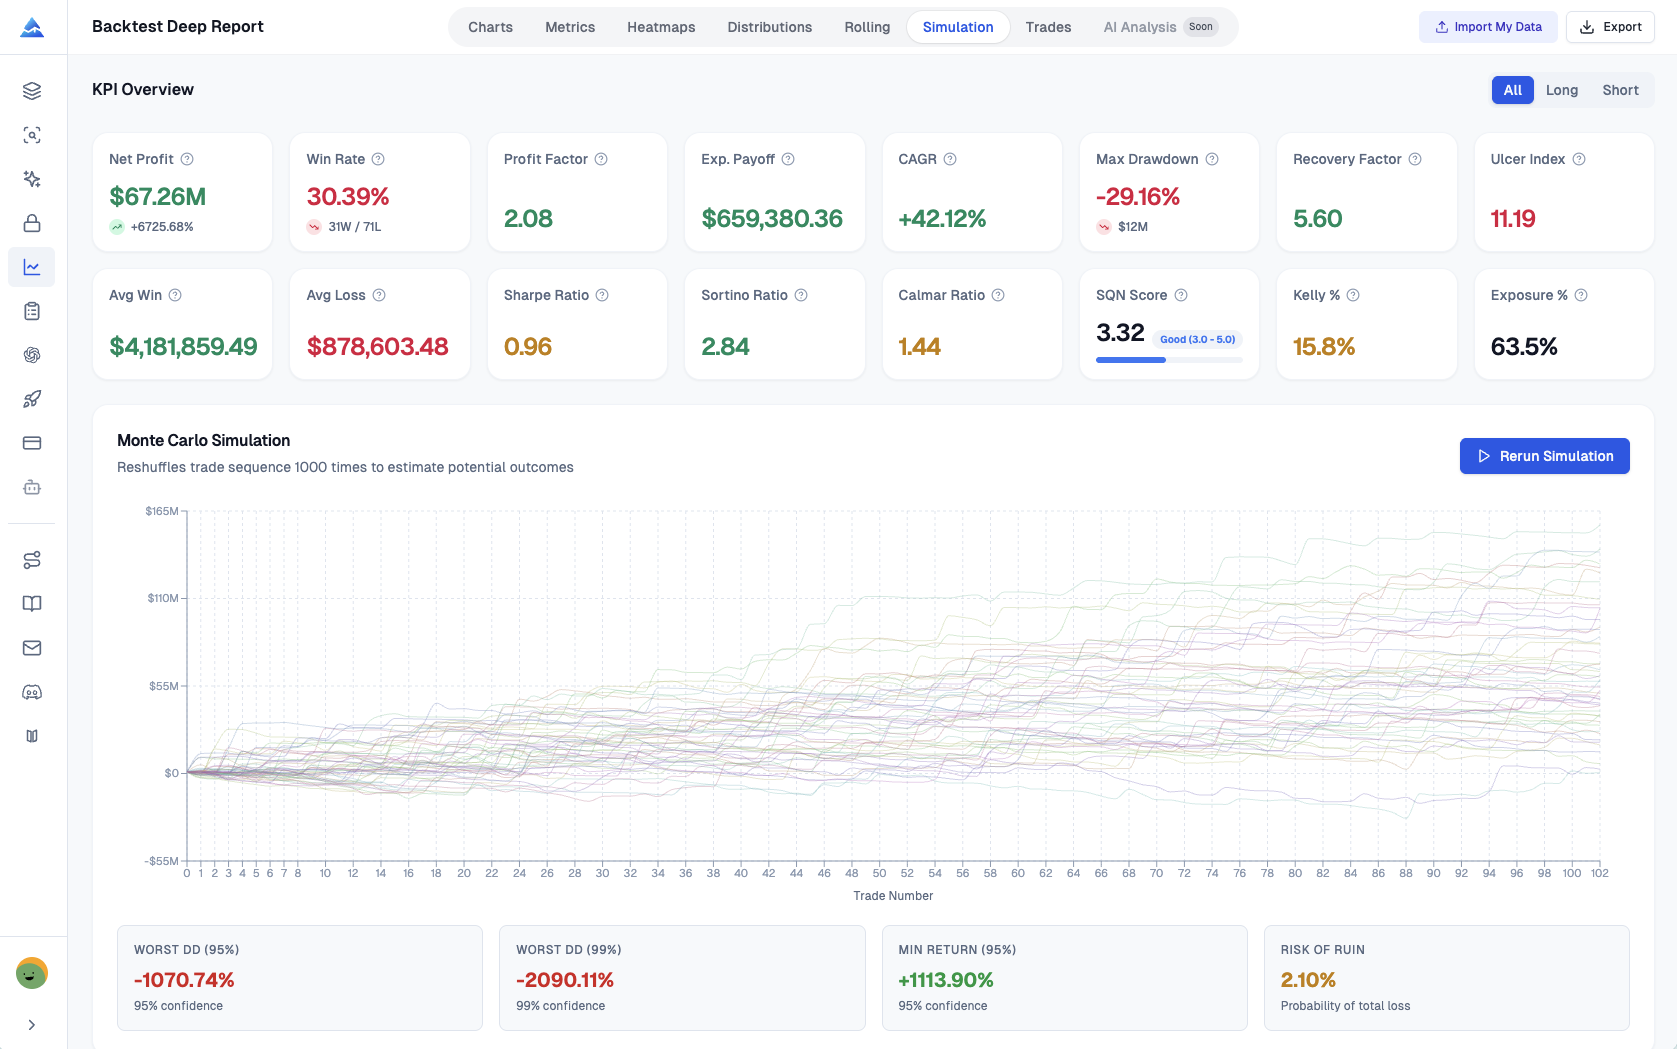
| Simulation | How sensitive is the equity path to trade order? | 1,000 randomized trade sequences, outcome ranges, and drawdown distributions |
| Trades | Which individual records drive the totals? | Parsed trade list with entry, exit, direction, and result details |
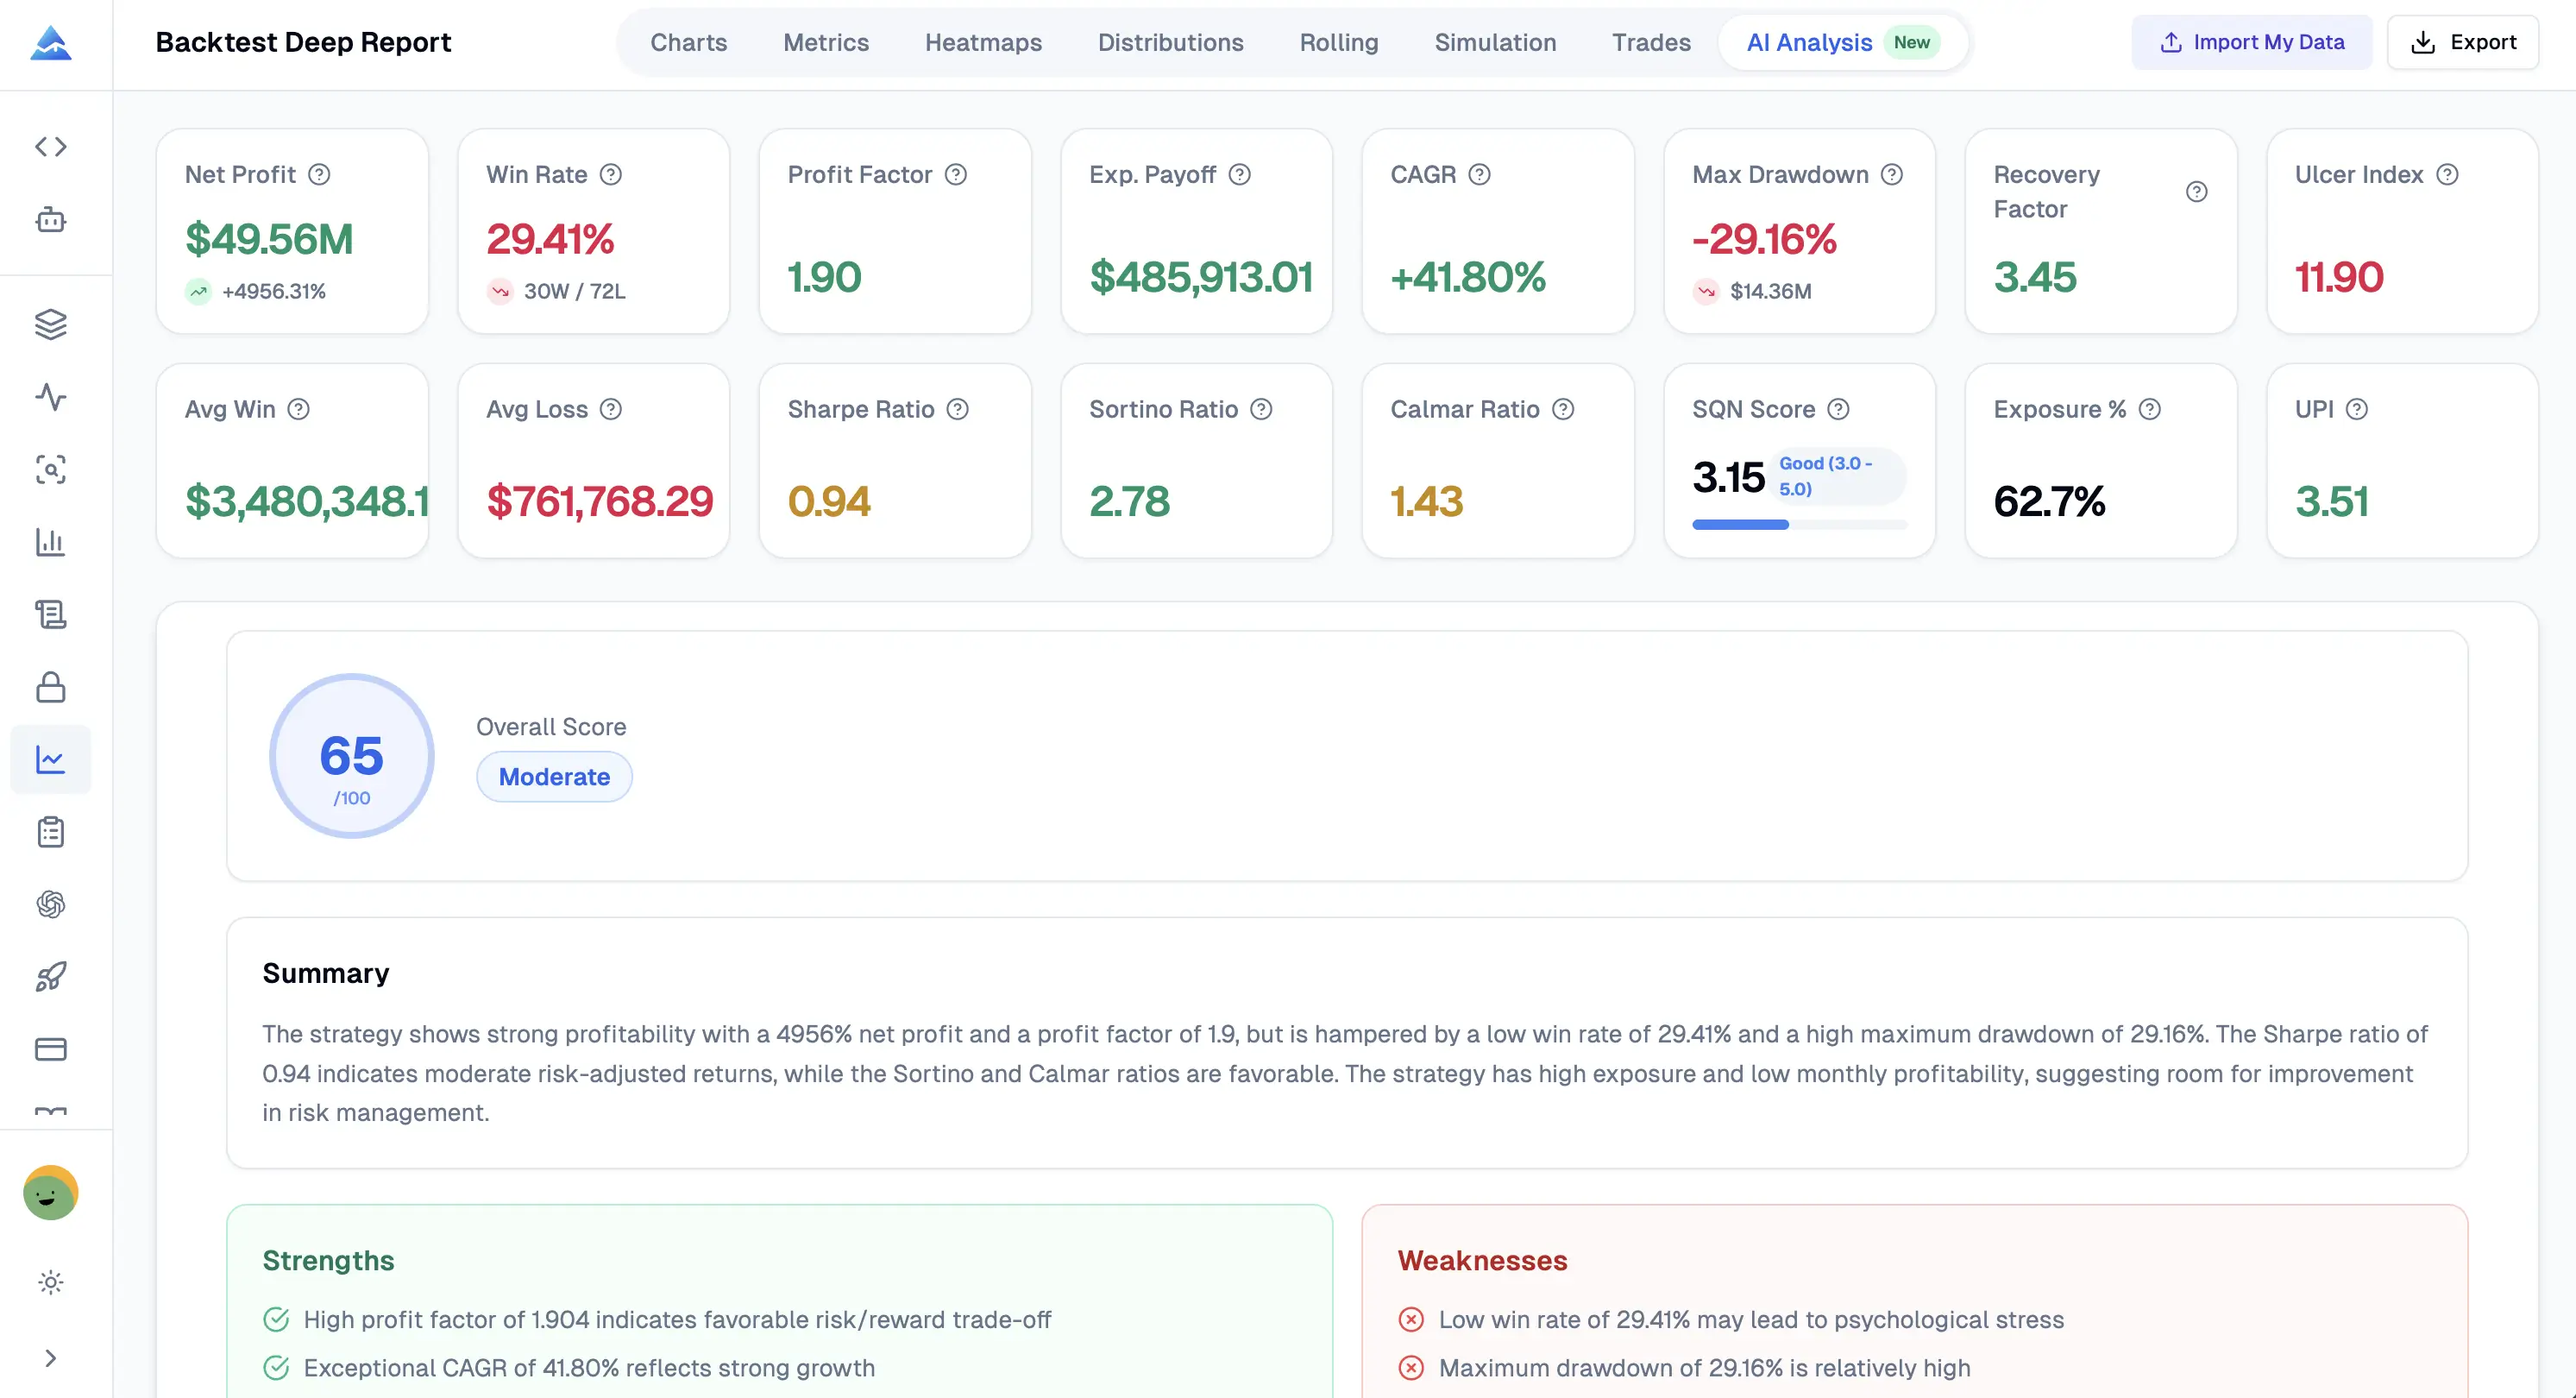
| AI Analysis | What follow-up checks does the sample suggest? | Plain-language strengths, weaknesses, risk notes, and questions for review |
How do the charts, metrics, and distributions work?
The KPI dashboard puts the main strategy performance report measures in one place and lets you compare all, long, and short trades. Charts, returns distributions, and rolling windows then show how the totals are distributed across trades and time.
What does the Monte Carlo simulation test?
The simulation reshuffles the imported trade sequence 1,000 times and displays a range of possible equity paths from those permutations. It tests order sensitivity in the supplied sample, not a guaranteed live-outcome probability.
How do heatmaps and MFE/MAE add context?
Heatmaps group results by day, week, month, and time efficiency. MFE/MAE compares each trade's best unrealized gain with its worst unrealized loss, informing questions about exits and stops without automatically optimizing them.
What are the Trades and AI Analysis views for?
Trades traces aggregate KPIs back to parsed records. AI Analysis summarizes possible strengths, weaknesses, and follow-up checks from the imported dataset, so treat it as interpretation rather than independent validation.
How should you interpret a strategy performance report?
Use a strategy performance report as evidence about a historical sample, not proof of future performance. Check range, trade count, capital, fees, slippage, open trades, and direction before comparing reports.
| Check | Question to answer before relying on a result |
|---|---|
| Data and sample | Is the CSV complete and representative of the market and timeframe? |
| Overfitting | Can you hold out an out-of-sample period instead of judging parameters on the same data? |
| Execution | Do commission, slippage, sizing, and capital resemble the intended environment? |
| Stability | Do rolling results, simulations, and chart context support more than one best period? |
| Confirmation | Does price context support the same interpretation? Use AI Chart Analysis separately. |
| Record keeping | Can you record assumptions and outcomes in Trading Journal? |
The report cannot remove look-ahead bias, survivorship bias, data errors, execution differences, or regime changes. A clean chart, favorable KPI, or AI summary does not change those limits.
Is the demo free, and what can you export?
The demo report appears on first load. Importing your own TradingView strategy CSV currently requires Advanced or higher; confirm the entitlement in the app and on the pricing page.
Use Export for an Excel workbook. It preserves output and calculation assumptions.
TradingView backtest report FAQ
What is a TradingView strategy CSV?
It is the CSV export of TradingView Strategy Tester's List of trades table. The report expects that trade-list format.
Does the report prove that a strategy is profitable?
No. It calculates metrics from the supplied sample and displays rolling and trade-order sensitivity. Future results can differ because of overfitting, data quality, execution, and regime changes.
How many simulations does the Monte Carlo view run?
The report runs 1,000 randomized permutations of the imported sequence. Use the range as order-sensitivity context, not a guaranteed live-outcome probability.
Can I use the report without my own data?
Yes. A demo dataset loads on first visit. Uploading your own TradingView strategy CSV requires Advanced or higher access.
Trading Journal
Use Pineify's trading journal to record trades, review performance, compare strategies, and organize diary notes, sessions, statistics, and reports.
Manage Your Indicators
Easily manage your trading indicators and strategies with Pineify. Create, edit, and organize tools intuitively for enhanced trading performance.