

TradingView Strategy Optimizer
Learn how Pineify's TradingView strategy optimizer runs parameter sweeps in Chrome, compares backtest results, and exports CSV for careful validation.
A TradingView strategy optimizer tests multiple input combinations in TradingView Strategy Tester so you can compare historical results instead of changing one value at a time. Pineify's TradingView strategy optimizer is a Chrome extension that runs a controlled parameter sweep over supported strategy inputs, records each run, and exports the table for further analysis. It does not choose a profitable or deployable strategy for you.
- Install from the Chrome Web Store
- Open the Pineify access page
- View the Strategy Optimizer product page
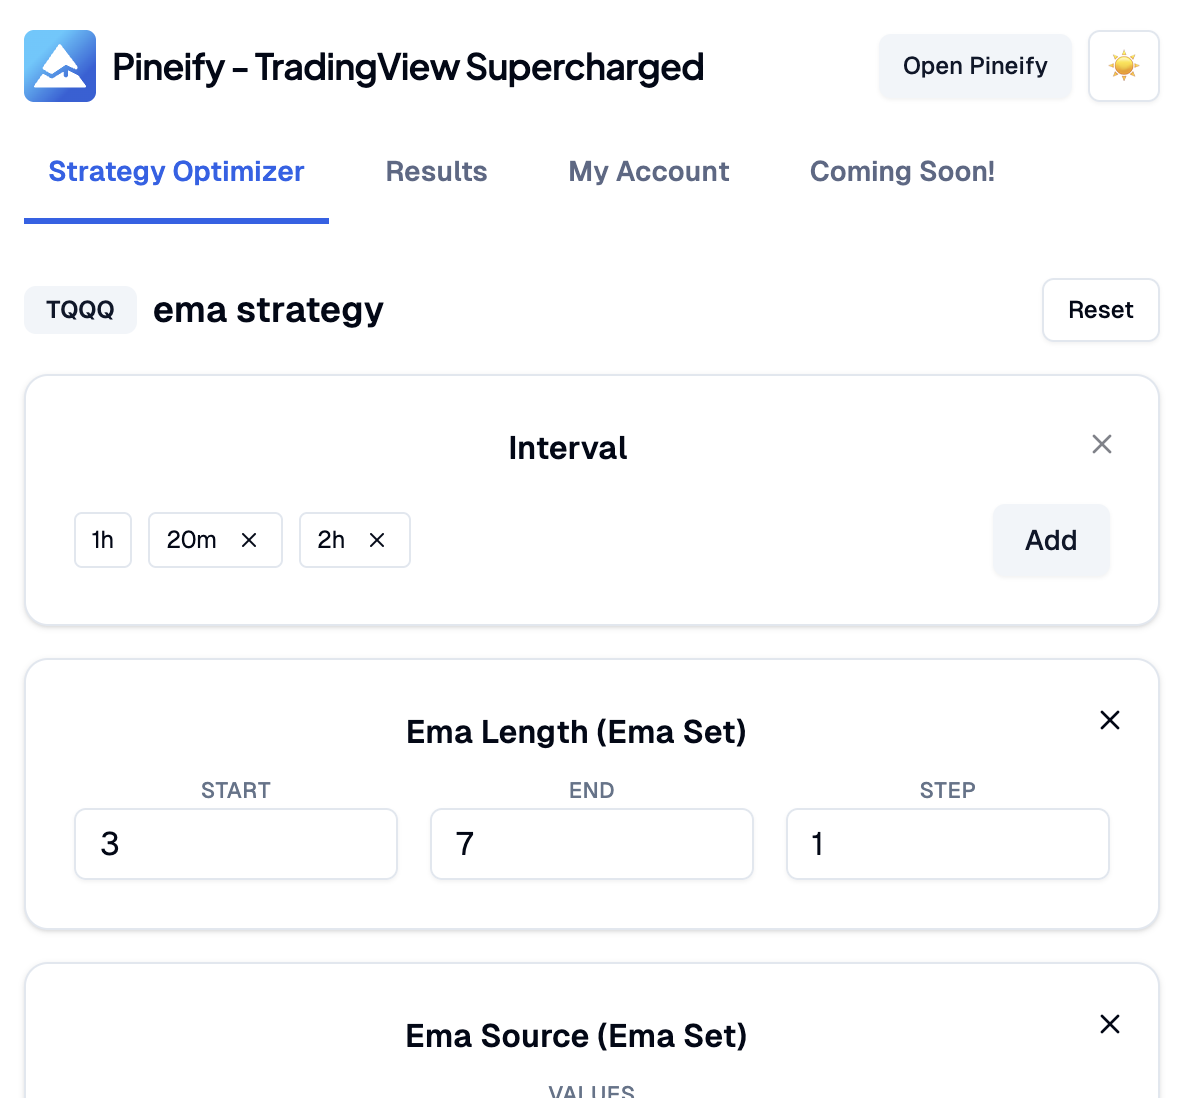
What is a TradingView strategy optimizer?
The optimizer is a TradingView optimization extension for Chrome. It works with a strategy that is already loaded on a TradingView chart and uses the open Strategy Tester to evaluate the input grid you define. This makes strategy parameter optimization repeatable, while TradingView remains the source of the chart, order logic, and backtest settings.
Instead of manually adjusting inputs and running backtests one by one, the optimizer performs a multi-parameter grid search. It tests every combination of the values you specify and lets you compare the results by net profit, win rate, profit factor, maximum drawdown, and other recorded metrics.
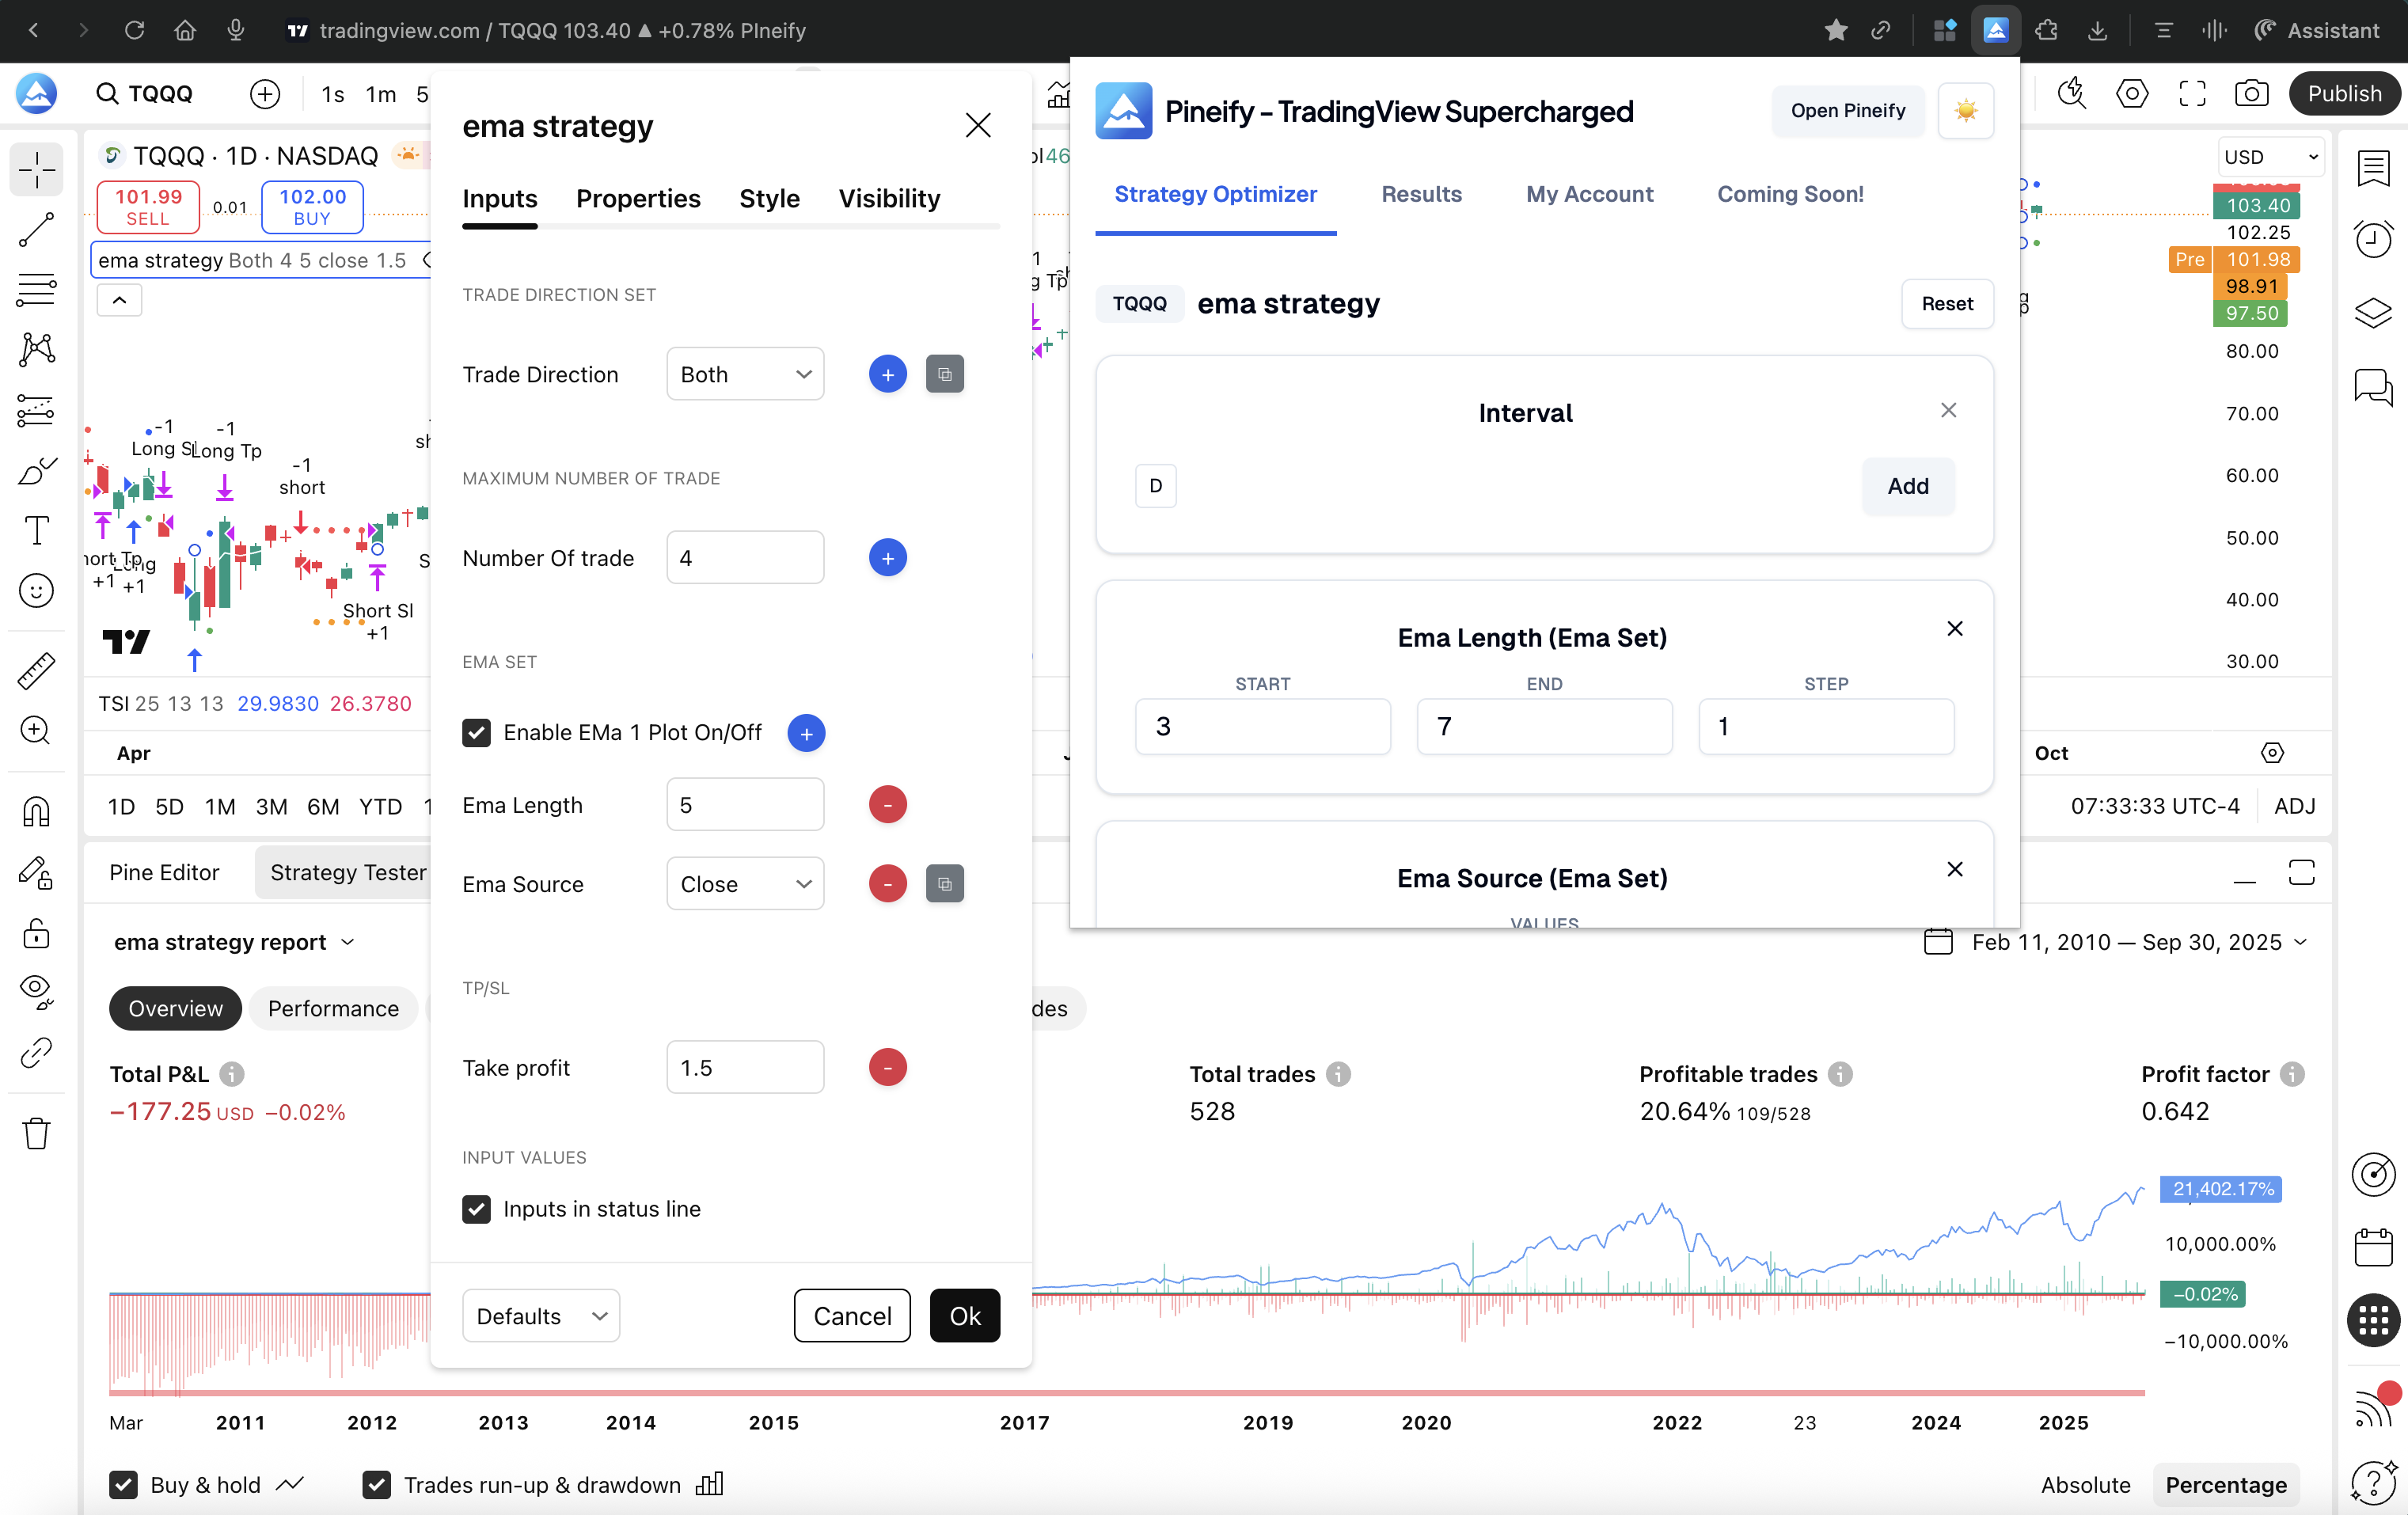
How do you install the Strategy Optimizer extension?
Install from the Chrome Web Store
Installing from the Chrome Web Store is recommended because Chrome manages extension updates automatically.
Install manually
Use the manual installation method when you need the downloadable ZIP build.
Manual installation steps
Download the latest extension package:
Download extension ZIP
After the download completes, unzip the package and open Chrome.
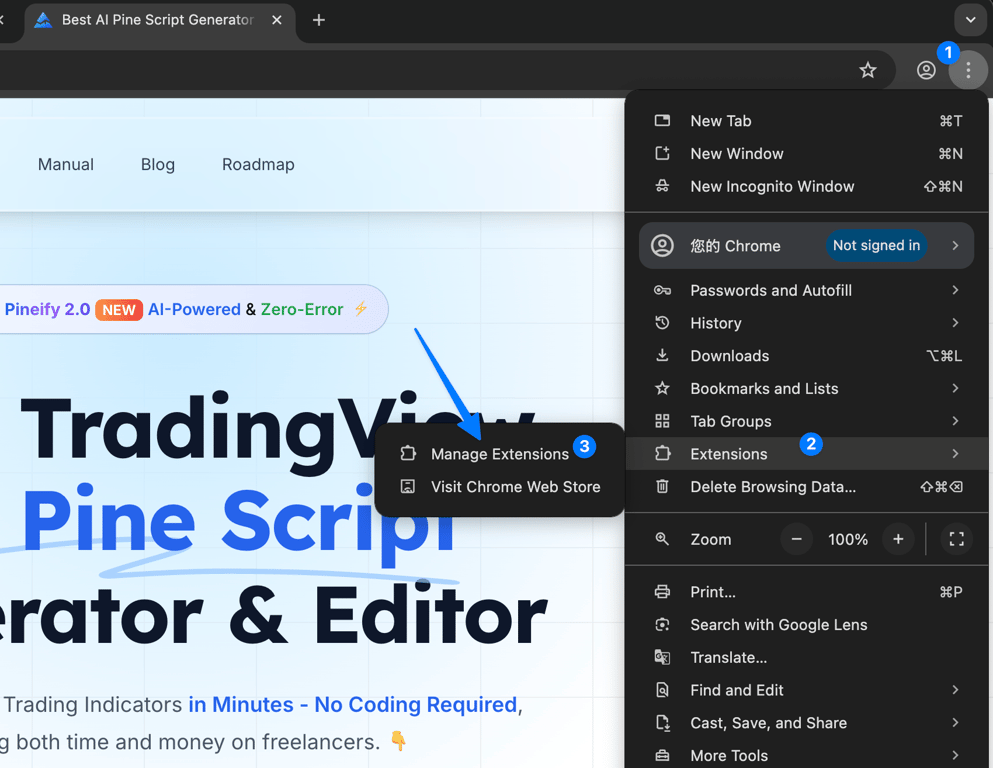
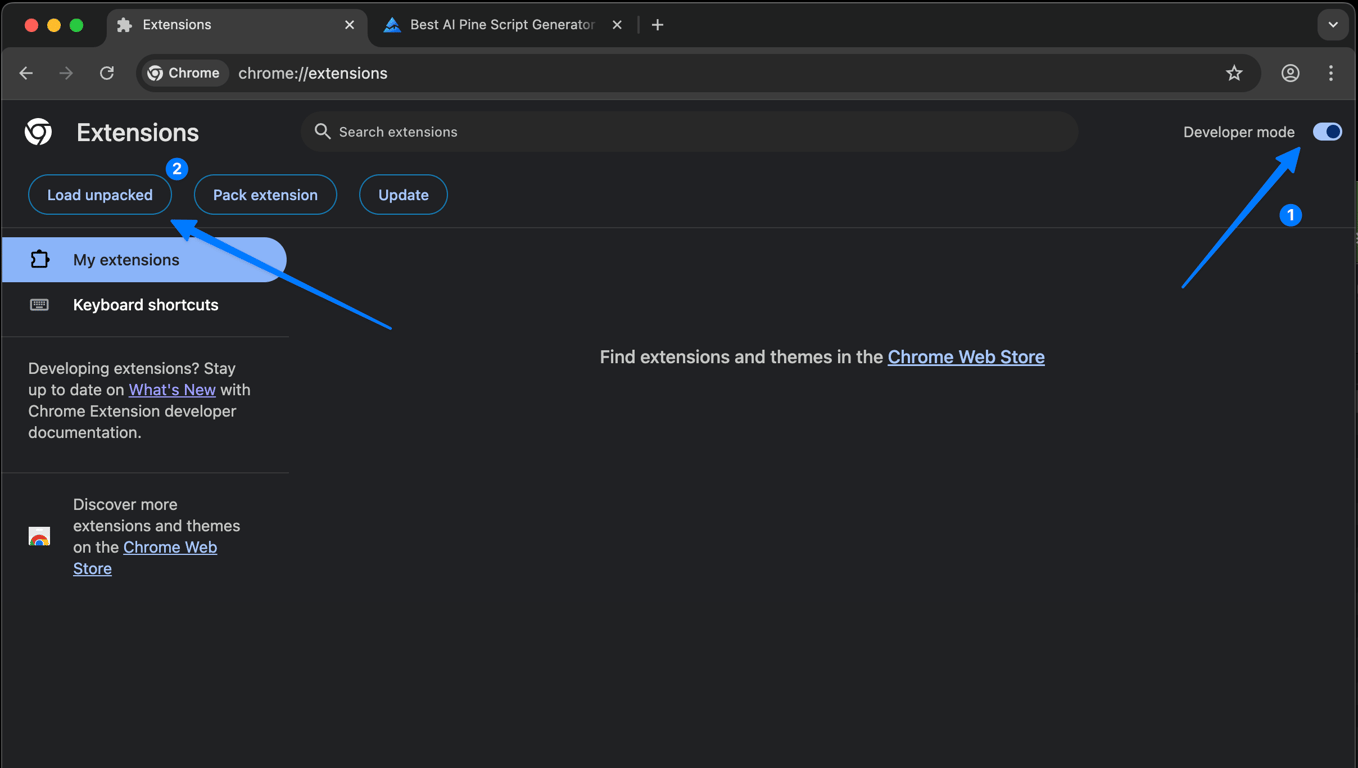
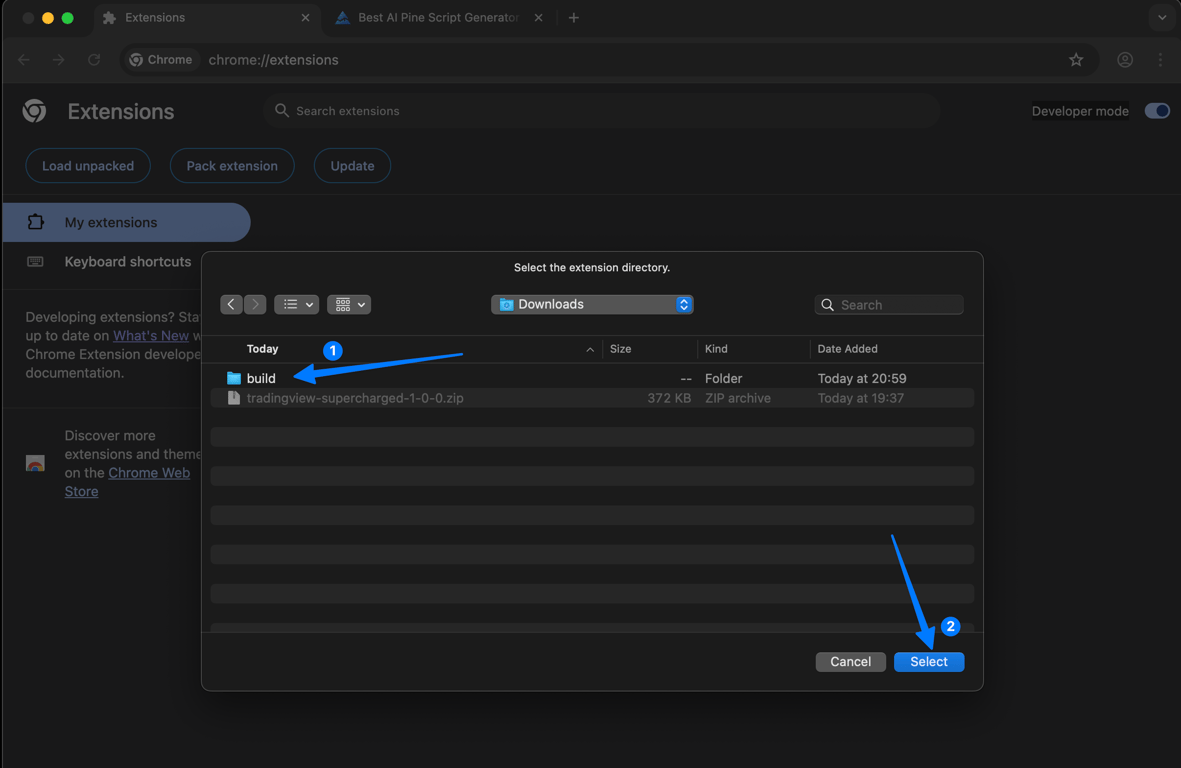
Open chrome://extensions, enable Developer mode, and select Load unpacked.
Select the extension folder you just unzipped.
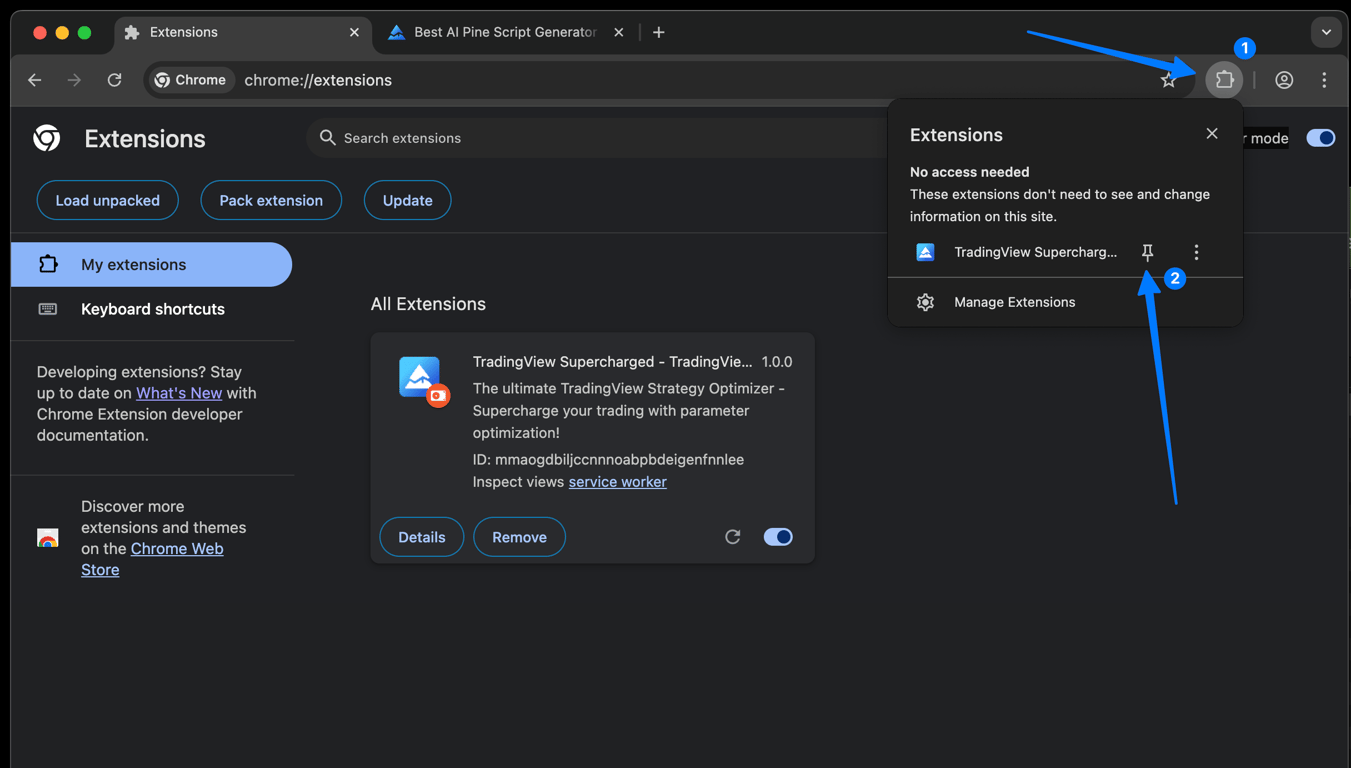
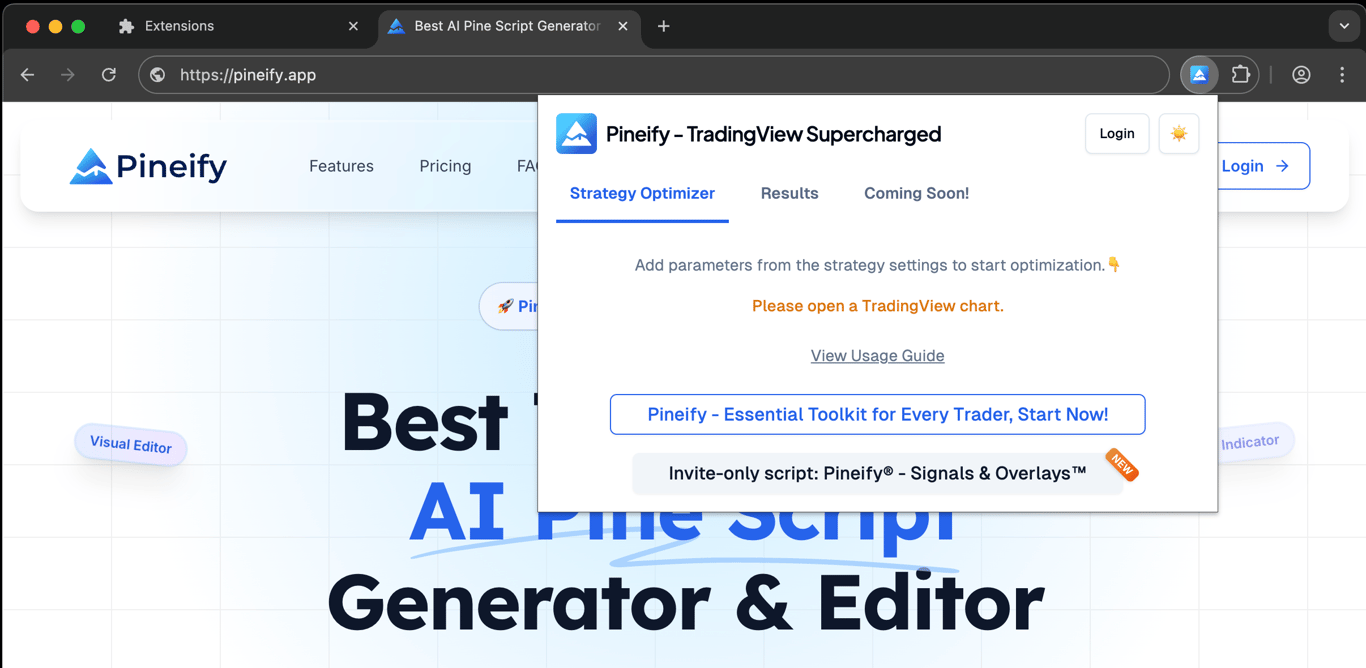
After installation, pin the extension from the Chrome extensions menu so it is easy to open from the toolbar.
What do you need before a backtest parameter sweep?
Prepare the chart and the account before starting. You need:
- Google Chrome with the TradingView Supercharged extension installed
- A Pineify account with optimizer access
- A TradingView strategy that exposes the inputs you want to test
- The strategy added to a chart with Strategy Tester open
- Clear assumptions for the test period, commission, slippage, capital, and order size
If the strategy does not expose an input, the optimizer cannot vary it. Build or revise it with the Pine Script AI Coding Agent, or use the Visual Pine Script Editor for a visual workflow.
How do you sign in to the extension?
Click the login button in the upper-right corner of the extension popup. You will be redirected to the Pineify website to sign in. After authentication completes, open the extension again to confirm that your account is connected.
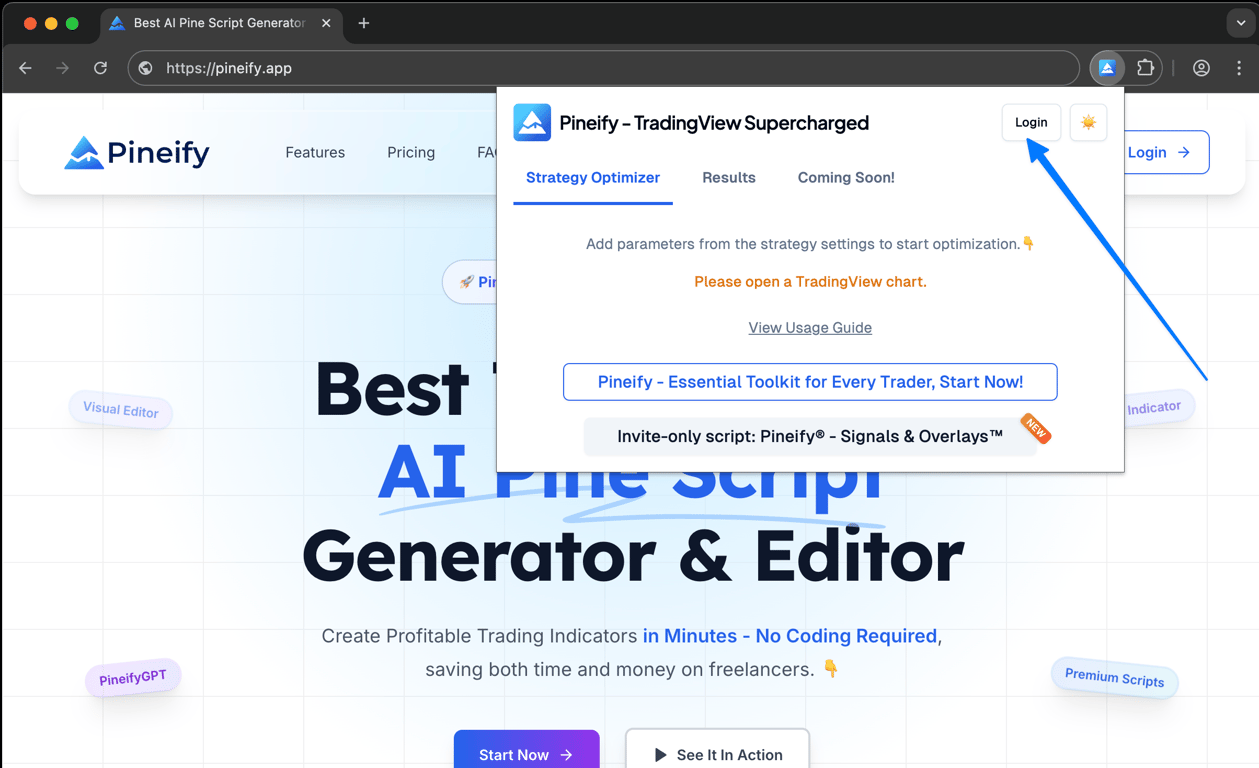
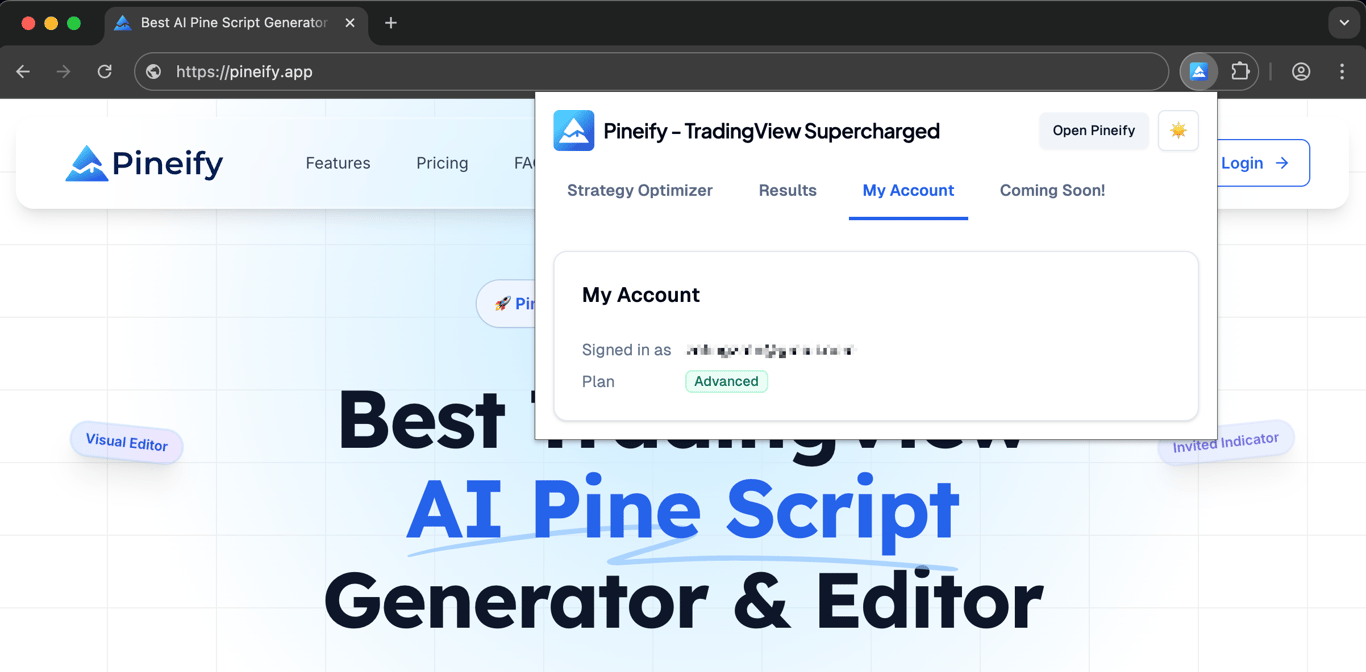
After a successful login, open My Account in the extension to view the connected account and plan information.
How do you run a backtest parameter sweep?
The workflow is an ordered grid search over the inputs that you select. Keep the TradingView tab available while the extension works.
- Add the strategy to a TradingView chart and open Strategy Tester.
- Open the extension and sign in to Pineify if prompted.
- Select the strategy inputs you want to vary.
- Set the start, end, step, state, option, or timeframe values for each input.
- Review the resulting combination count before starting the run.
- Start the optimization and keep the chart tab open while each combination is tested.
- Sort or filter the results, then export the table to CSV when you need to review it elsewhere.
The total number of runs is the product of the selected values for every input. A narrow, hypothesis-driven grid is easier to review than a large grid without a defined question.
Open the strategy settings in TradingView
Open TradingView, find the strategy you want to optimize, and add it to the chart. The example below uses SuperTrend STRATEGY.
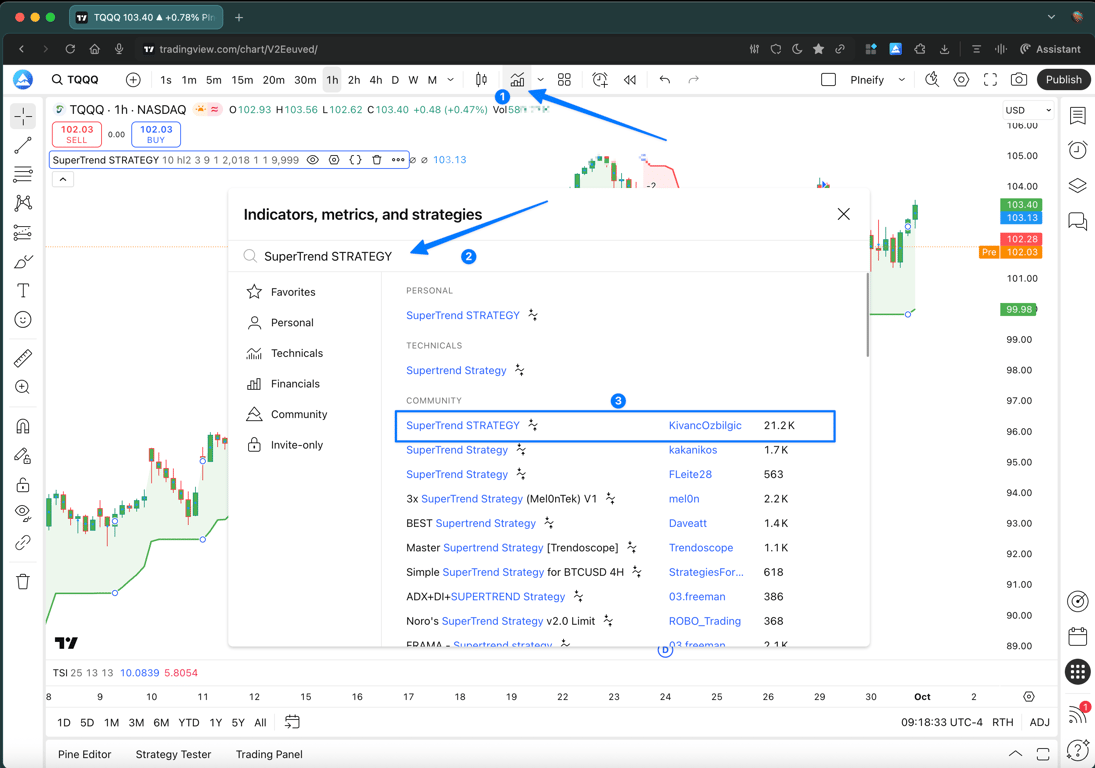
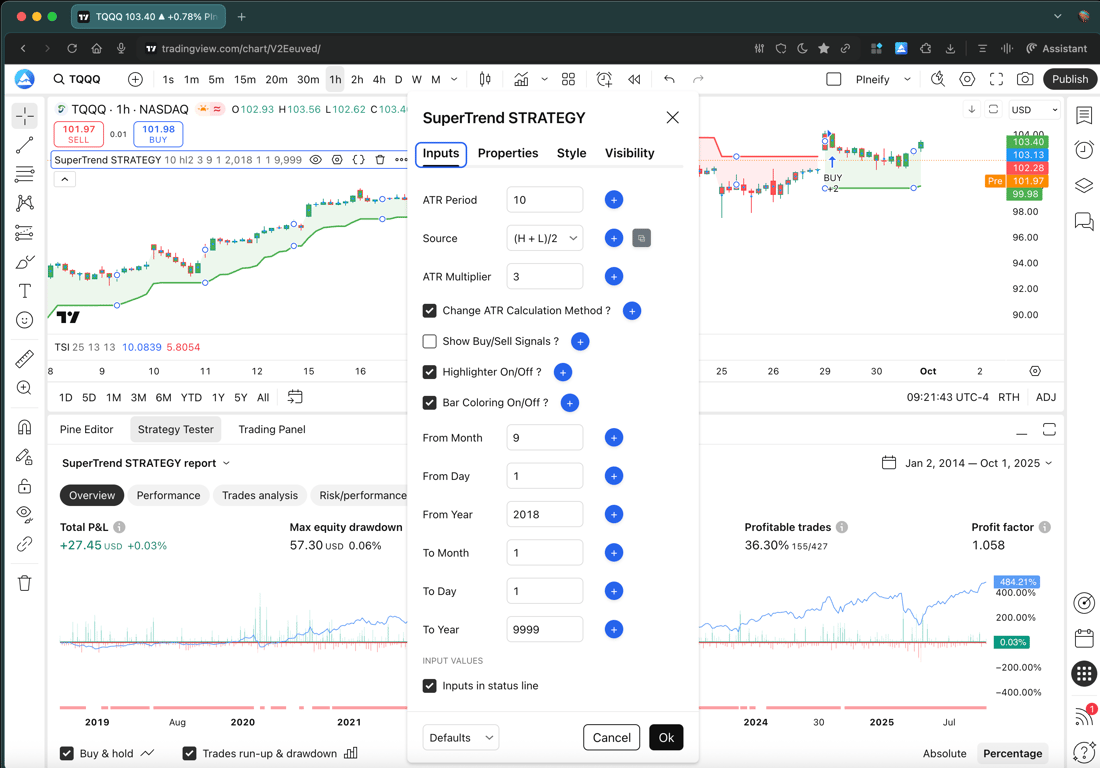
Open Strategy Tester, then open the strategy's Settings panel from the chart legend.

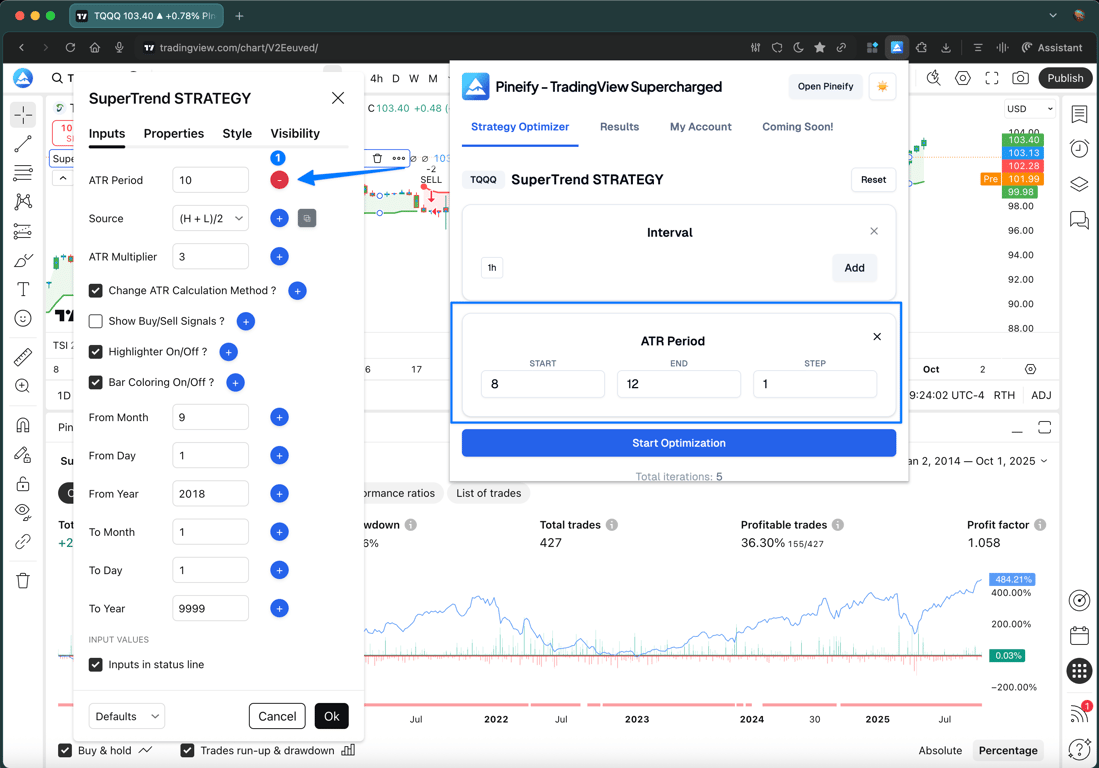
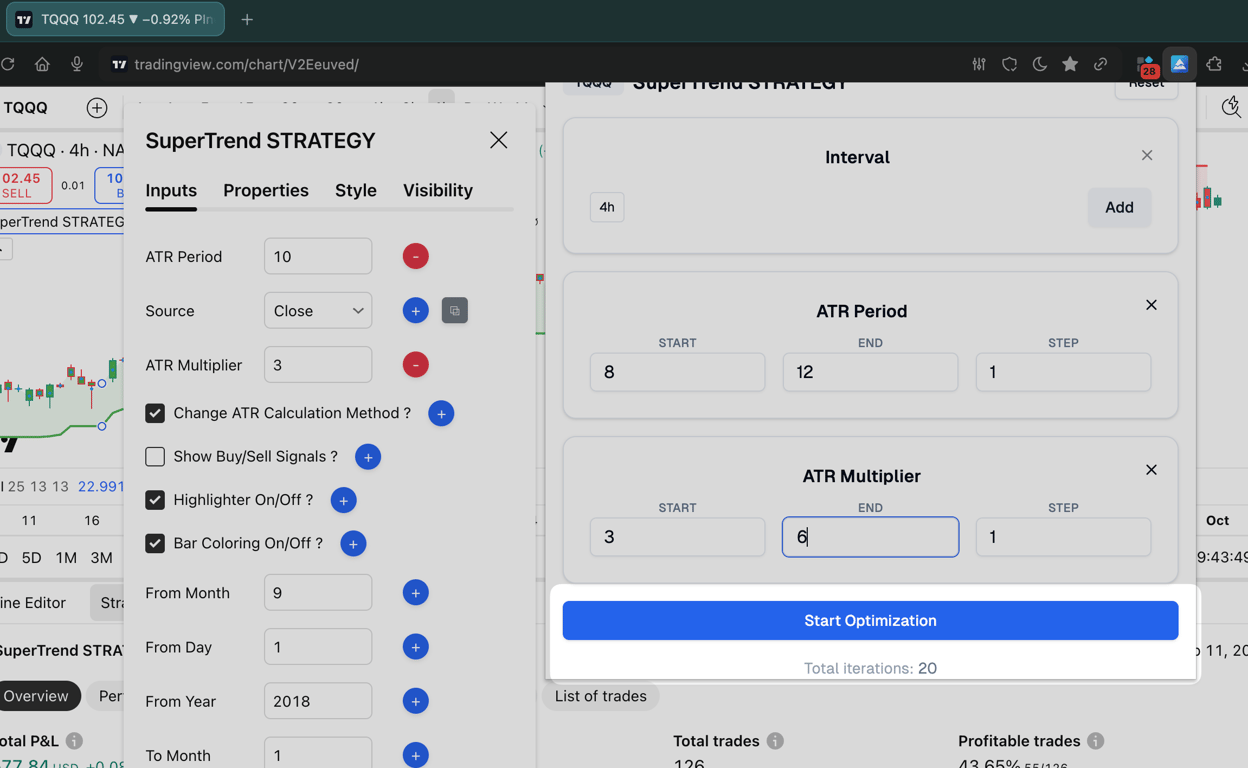
The extension adds a button beside each supported input in the Inputs tab. Click the add button beside an input to include that parameter in the optimization project.
Open the extension popup to configure the parameter's start value, end value, and step size. The total iteration count is shown near the Start Optimization button.
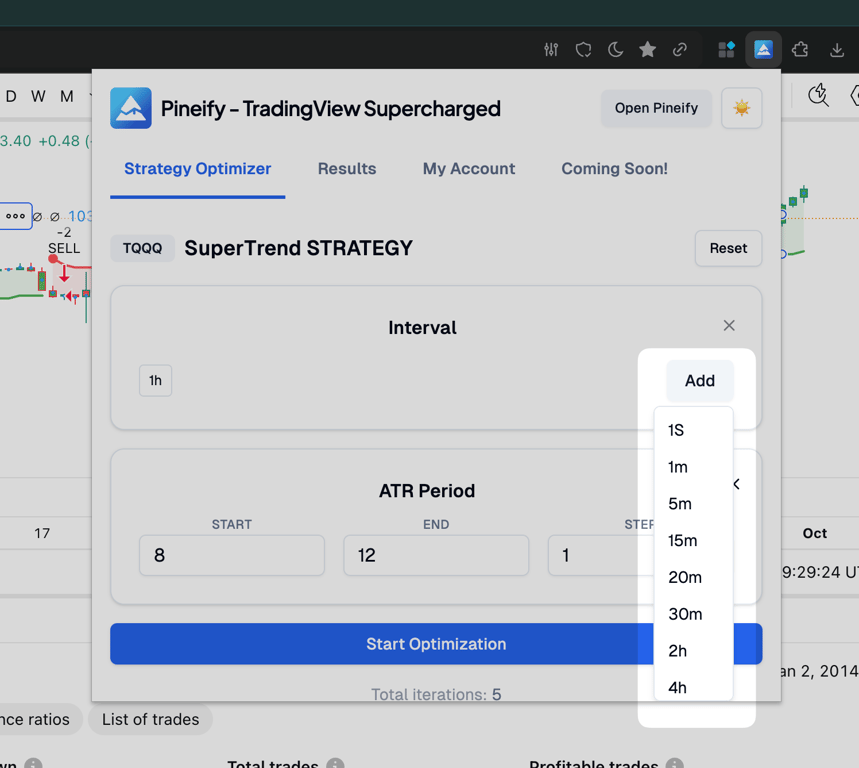
Configure timeframe values
TradingView Supercharged can include the chart timeframe as an optimization item. The current chart interval is included by default, and you can add other intervals to compare the strategy across multiple timeframes.
Configure integer and decimal values
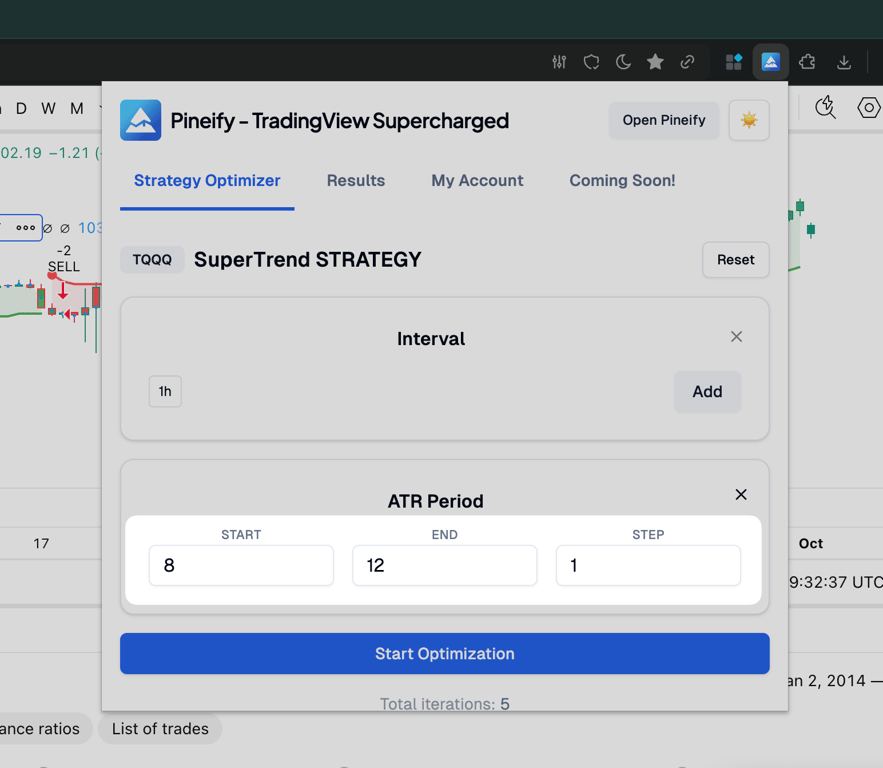
Number inputs support integer and decimal ranges. Set a start value, end value, and step value. For example, start=5, end=10, and step=1 tests 5, 6, 7, 8, 9, and 10.
Configure dropdown values
Dropdown inputs can also be optimization parameters. Open the strategy settings and add the dropdown input to the optimization project.

Use the copy button beside the dropdown to copy its current value. Paste that value into the matching parameter in the extension popup and add it to the list of values to test. Repeat this process for every dropdown option you want to include.

Start the optimization
After confirming the selected inputs and iteration count, click Start Optimization. Keep the TradingView chart tab open while the extension applies each combination and records the corresponding Strategy Tester result.
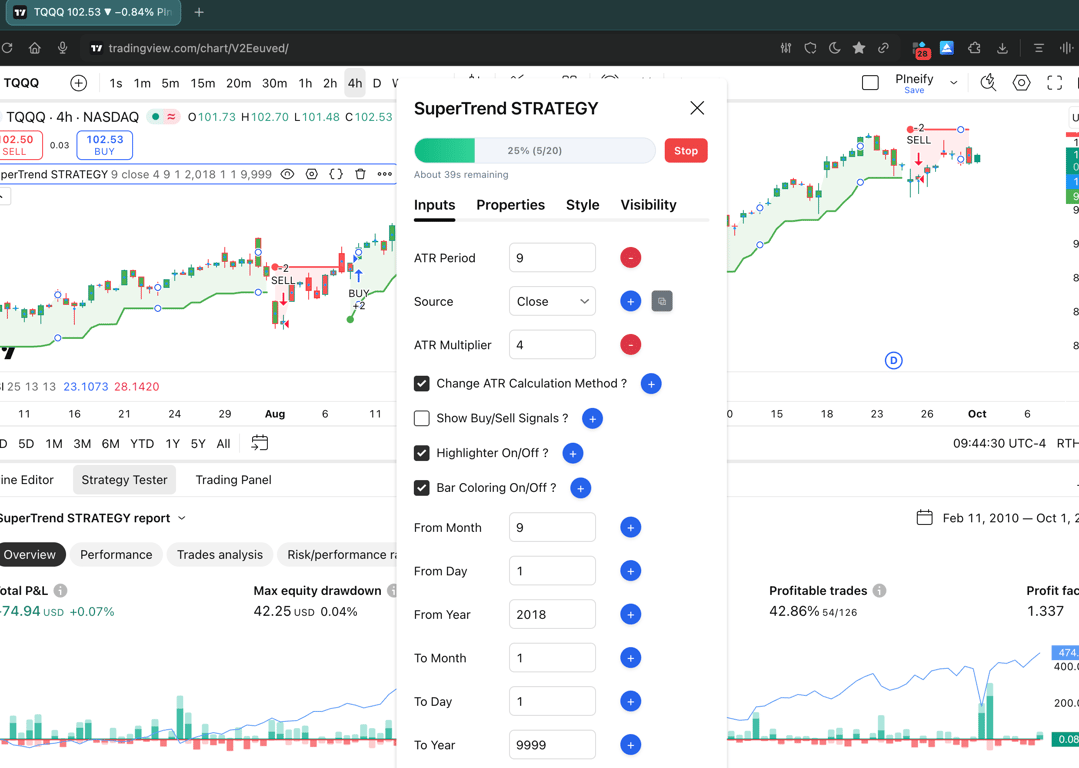
The progress display shows the completed iterations and estimated remaining time.
View and export the results
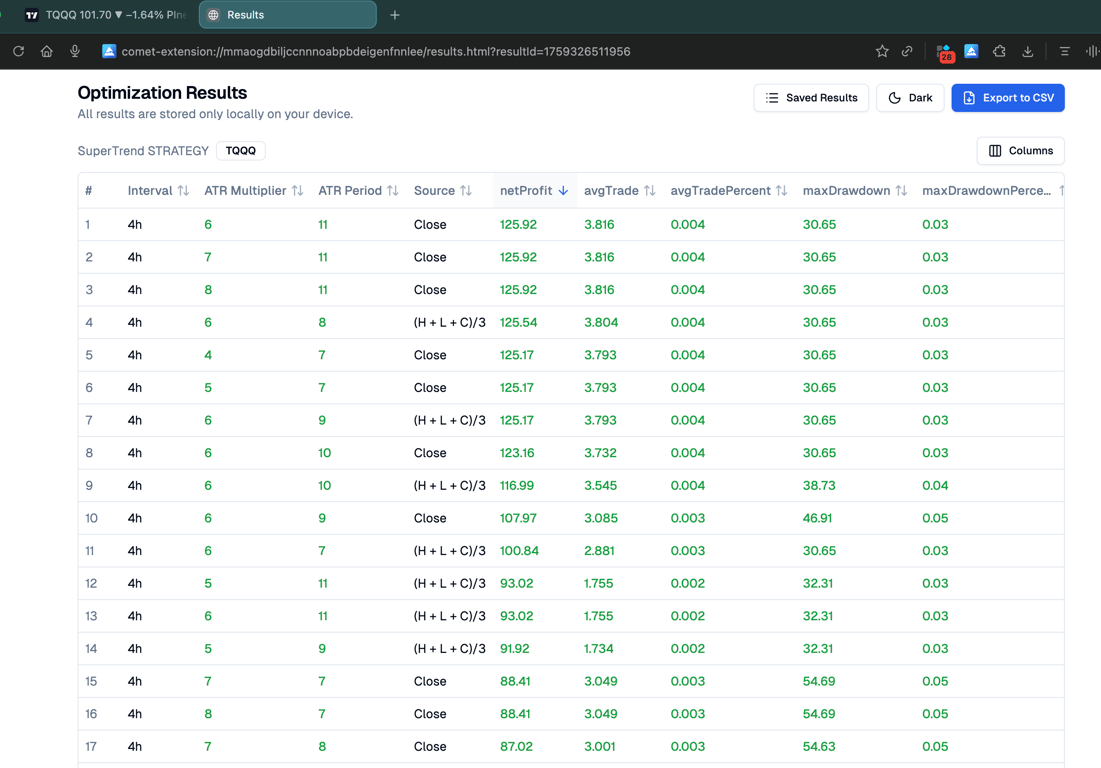
When optimization finishes, the extension opens the optimization results page. If the result page does not appear, refresh it. Results are sorted by net profit in descending order by default, and you can select a different column for sorting.
Use the CSV export action in the upper-right corner when you need to analyze or archive the result table elsewhere.
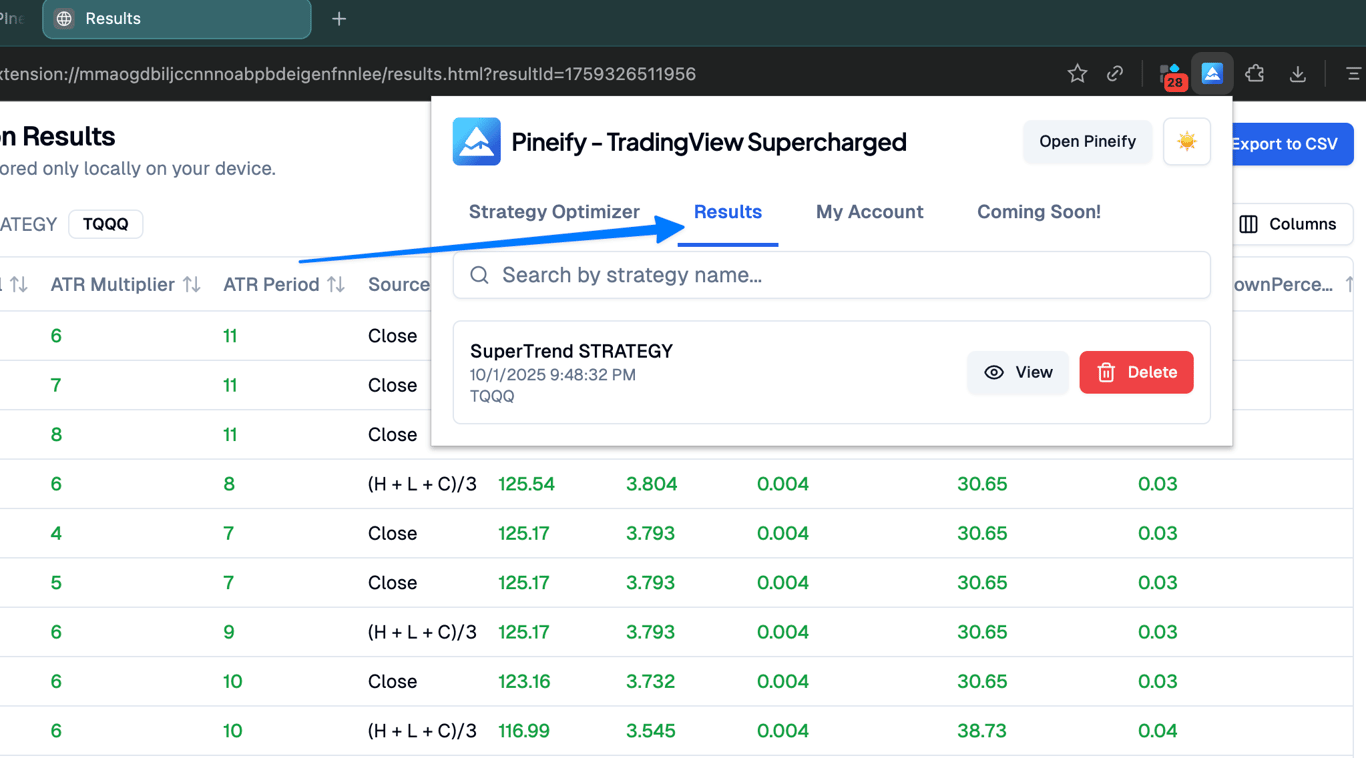
Open the Results tab in the extension popup to review previous optimization runs.
Which TradingView inputs can you optimize?
The extension supports the following parameter patterns. The exact values depend on the inputs exposed by your strategy.
| Input pattern | Configuration | Example research question |
|---|---|---|
| Integer or decimal | Start, end, and step values | Does changing a length or threshold alter the result? |
| Checkbox | Test enabled and disabled states | Does an optional filter change the historical profile? |
| Dropdown | Select the values to include | Which available mode should be compared? |
| Timeframe | Add the chart intervals to compare | Does the behavior differ across selected intervals? |
Use the same data range and TradingView settings when comparing rows. Changing the chart, date range, or cost assumptions during a run makes the table harder to interpret.
How should you rank and inspect the results?
No single metric answers whether a parameter combination is robust. Sort by one metric to find candidates, then inspect the same rows across return, risk, and trade behavior.
| Metric | What it describes | What to check next |
|---|---|---|
| Net profit | Historical result under the current test settings | Compare drawdown, sample size, and costs |
| Win rate | Share of trades that closed profitably | Check average win, average loss, and payoff distribution |
| Profit factor | Gross profit relative to gross loss | Confirm that a few trades do not dominate the result |
| Maximum drawdown | Largest peak-to-trough decline in the test | Decide whether the path fits your risk limits |
The result table ranks tested combinations; it does not create a new strategy or verify live execution. For a wider review of an exported Strategy Tester file, use Backtest Deep Report. Record the question and settings in Trading Journal so later decisions can be compared with the original test.
How do you reduce in-sample overfitting?
The highest in-sample row can be a historical fit rather than a durable edge. A larger grid increases the chance that one combination matches noise in the chosen sample, so treat the sweep as an exploratory screening step.
- Reserve a separate out-of-sample period for confirmation.
- Look for a stable region of similar results instead of one isolated maximum.
- Compare net profit with drawdown, profit factor, trade count, and return distribution.
- Re-test with realistic commission, slippage, capital, and order-size assumptions.
- Compile and run the selected values in TradingView again before using them elsewhere.
Past backtest results do not predict future returns. Parameter selection also does not remove market, execution, liquidity, or model risk.
Who can access the TradingView strategy optimizer?
Optimizer access currently requires an Advanced plan or higher. Use the Pineify access page and pricing page to confirm the current entitlement before installing or planning a large run.
TradingView Strategy Optimizer FAQ
Is this a standalone backtesting engine?
No. The extension operates on a strategy loaded in TradingView and uses its Strategy Tester. It automates input changes and result collection; the chart and test settings remain in TradingView.
Which parameter types are supported?
Integer and decimal ranges, checkbox states, dropdown selections, and selected timeframes are supported. The strategy must expose an input before the extension can include it.
Does the optimizer find the best strategy?
It ranks the combinations tested on the selected historical sample. A top row is not proof of future performance or a deployable strategy; validate it on separate data and with realistic costs.
Can I export the optimization results?
Yes. Export the reviewed result table to CSV for filtering, documentation, or analysis in another tool.
What plan is required?
The current access requirement is Advanced or higher. Plan entitlements can change, so confirm the access page or pricing page immediately before use.
TradingView Invite-Only Indicator | Signals & Overlays
Learn how Pineify Signals & Overlays works as a TradingView invite-only indicator, how to request access, read buy and sell signals, and use ATR risk levels.
TradingView Premium Scripts
Explore TradingView premium scripts with source code, premium Pine Script indicators, tutorials, and checks for repainting and backtest behavior.