Tom Demark 9 (TD9) Indicator: TradingView Setup and Strategy
The Tom Demark 9 (TD9) indicator is the countdown phase of Tom DeMark's TD Sequential system. After a setup of 9 consecutive closes higher or lower than the close 4 bars prior, the TD9 countdown tracks each bar that keeps closing in the same trend direction. When the count hits 9, it signals potential trend exhaustion.
I've been using this indicator on TradingView for about three years. On AAPL daily charts, the TD9 countdown caught the November 2023 reversal within two bars. On BTC/USD 4-hour charts, I've seen it flag exhaustion at 9 and price reverse 4% in under 12 hours. It's not perfect, but it gives you a systematic reason to watch for a turn when other traders are still chasing the move.
What I like about TD9 is how it adapts to each candle without fixed smoothing parameters. No lagging averages, no arbitrary thresholds — just a simple relationship between the current bar and the one 4 positions back.
How the TD9 Countdown Works
The indicator uses two phases. First, a TD Sequential setup: 9 consecutive closes each higher (buy setup) or lower (sell setup) than the close 4 bars earlier. Once that completes, the countdown phase begins.
Countdown Formula:
- Uptrend increment:
close > close[4] - Downtrend increment:
close < close[4]
Each bar that meets the condition increments the count. If a bar fails, the count resets to zero. When it reaches 9, you get a potential exhaustion signal.
Tom DeMark chose 9 based on decades of market observation — that's where he found momentum tends to exhaust. The 4-bar offset filters day-to-day noise without being so wide that it lags the move.
I've tested variations — 7-count, 13-count, 3-bar offset, 5-bar offset — and I keep coming back to the original parameters. They're not magic. They just happen to match how most markets behave.
Timeframe Performance
| Timeframe | Signal Reliability | Best For | Typical Frequency |
|---|---|---|---|
| 15-minute | Low | Scalping entry timing | Several per day |
| 1-hour | Medium | Day trading | 1-3 per day |
| 4-hour | Medium-High | Swing trading | Every 1-3 days |
| Daily | High | Position trading | Every 1-2 weeks |
| Weekly | Very High | Long-term trend changes | Monthly |
On daily and weekly, I trust the signals more. On 15-minute charts I filter with volume or support and resistance — otherwise the noise gets uncomfortable.
How to Add TD9 to TradingView
Two paths. Here's what I'd do.
Using Pineify (faster, less error-prone):
- Go to Pineify.app and search for the Tom Demark 9 indicator.
- The platform generates clean Pine Script code with the count logic and visual labels built in.
- Copy the script, open TradingView's Pine Script Editor, paste, save, and apply to your chart.
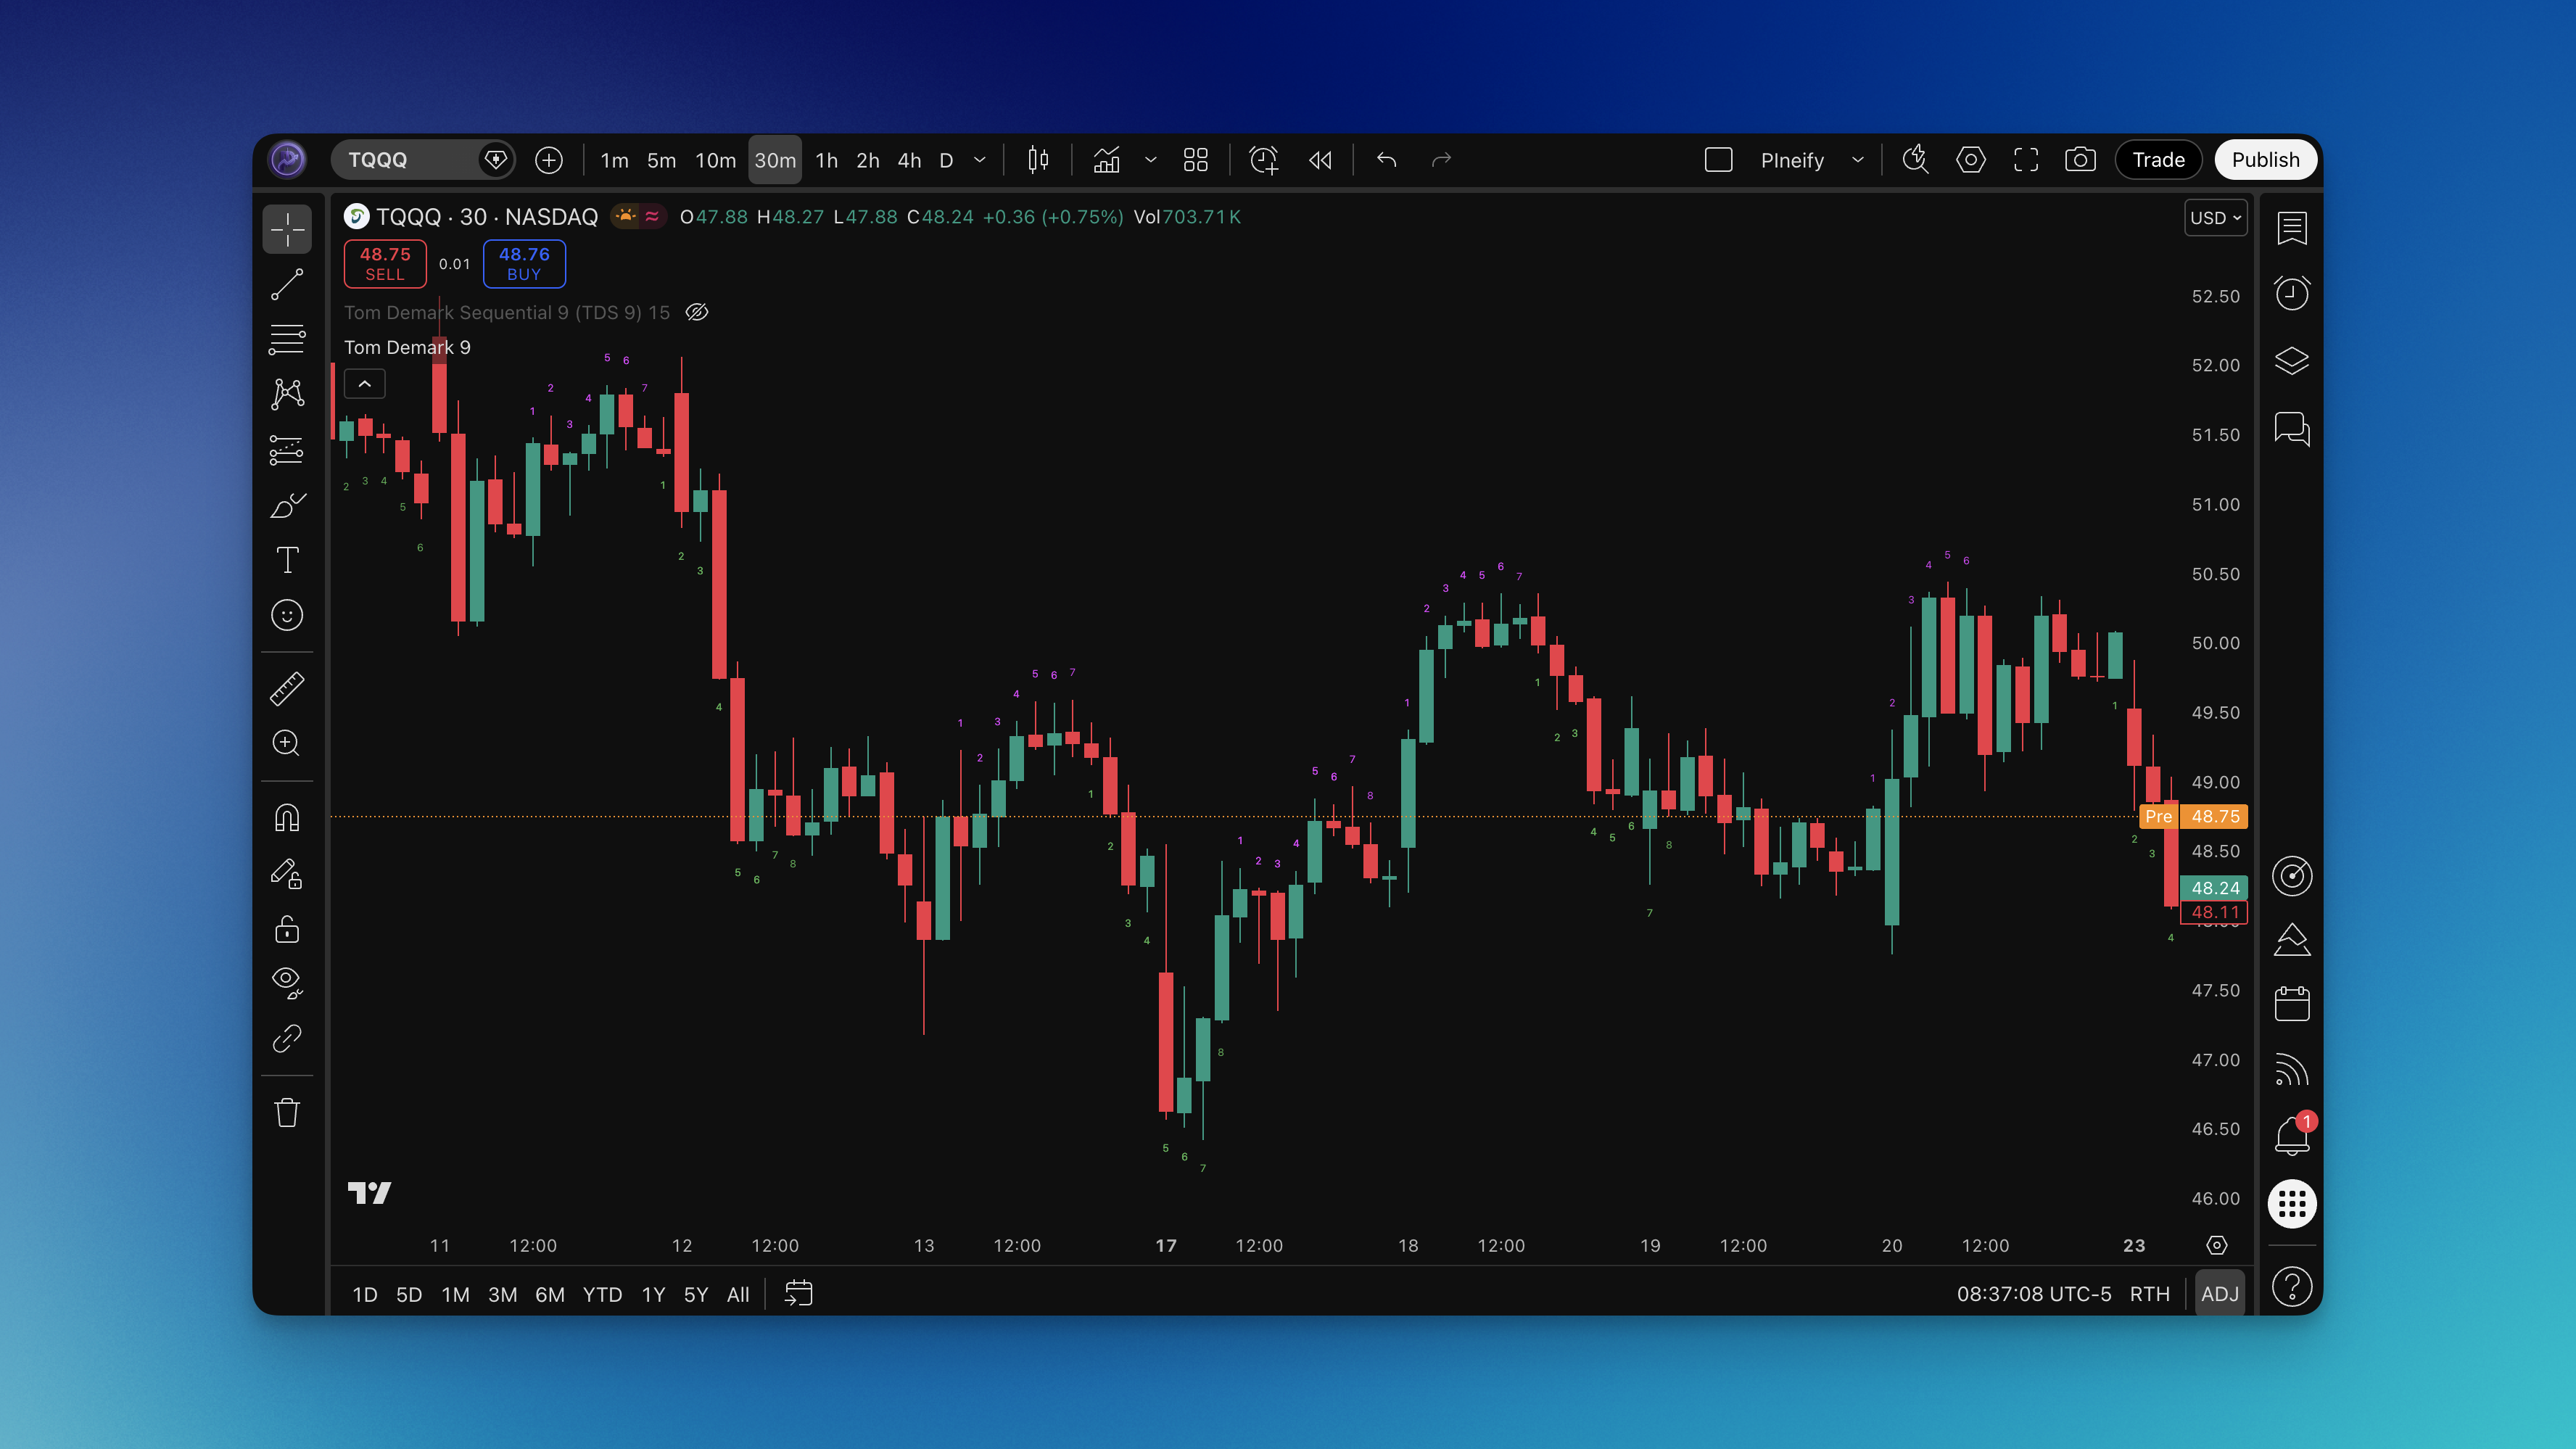
You'll get numbers 1 through 9 plotted above or below candles, with the 9 highlighted. No manual debugging of count resets or initialization edge cases.
Manual Pine Script Installation:
- Open TradingView, open the Pine Script Editor.
- Create a new indicator, paste the TD9 code, hit Save.
- Add to chart and adjust display settings.
The manual route works. But I've spent hours tracking down off-by-one errors in countdown logic, so I usually grab the Pineify version and move on.
How I Use the TD9 Signal
I don't trade every 9-count. Here's what actually works for me.
Check the setup quality first. If the TD Sequential setup completed with clean directional closes, the countdown is more reliable. If the setup bars were mostly dojis or indecision candles, I skip.
Look for confluence. A 9-count at a support or resistance level carries more weight than one in open space. I missed a good setup on TSLA in February 2024 because I ignored the resistance confluence — price reversed 8% the next day.
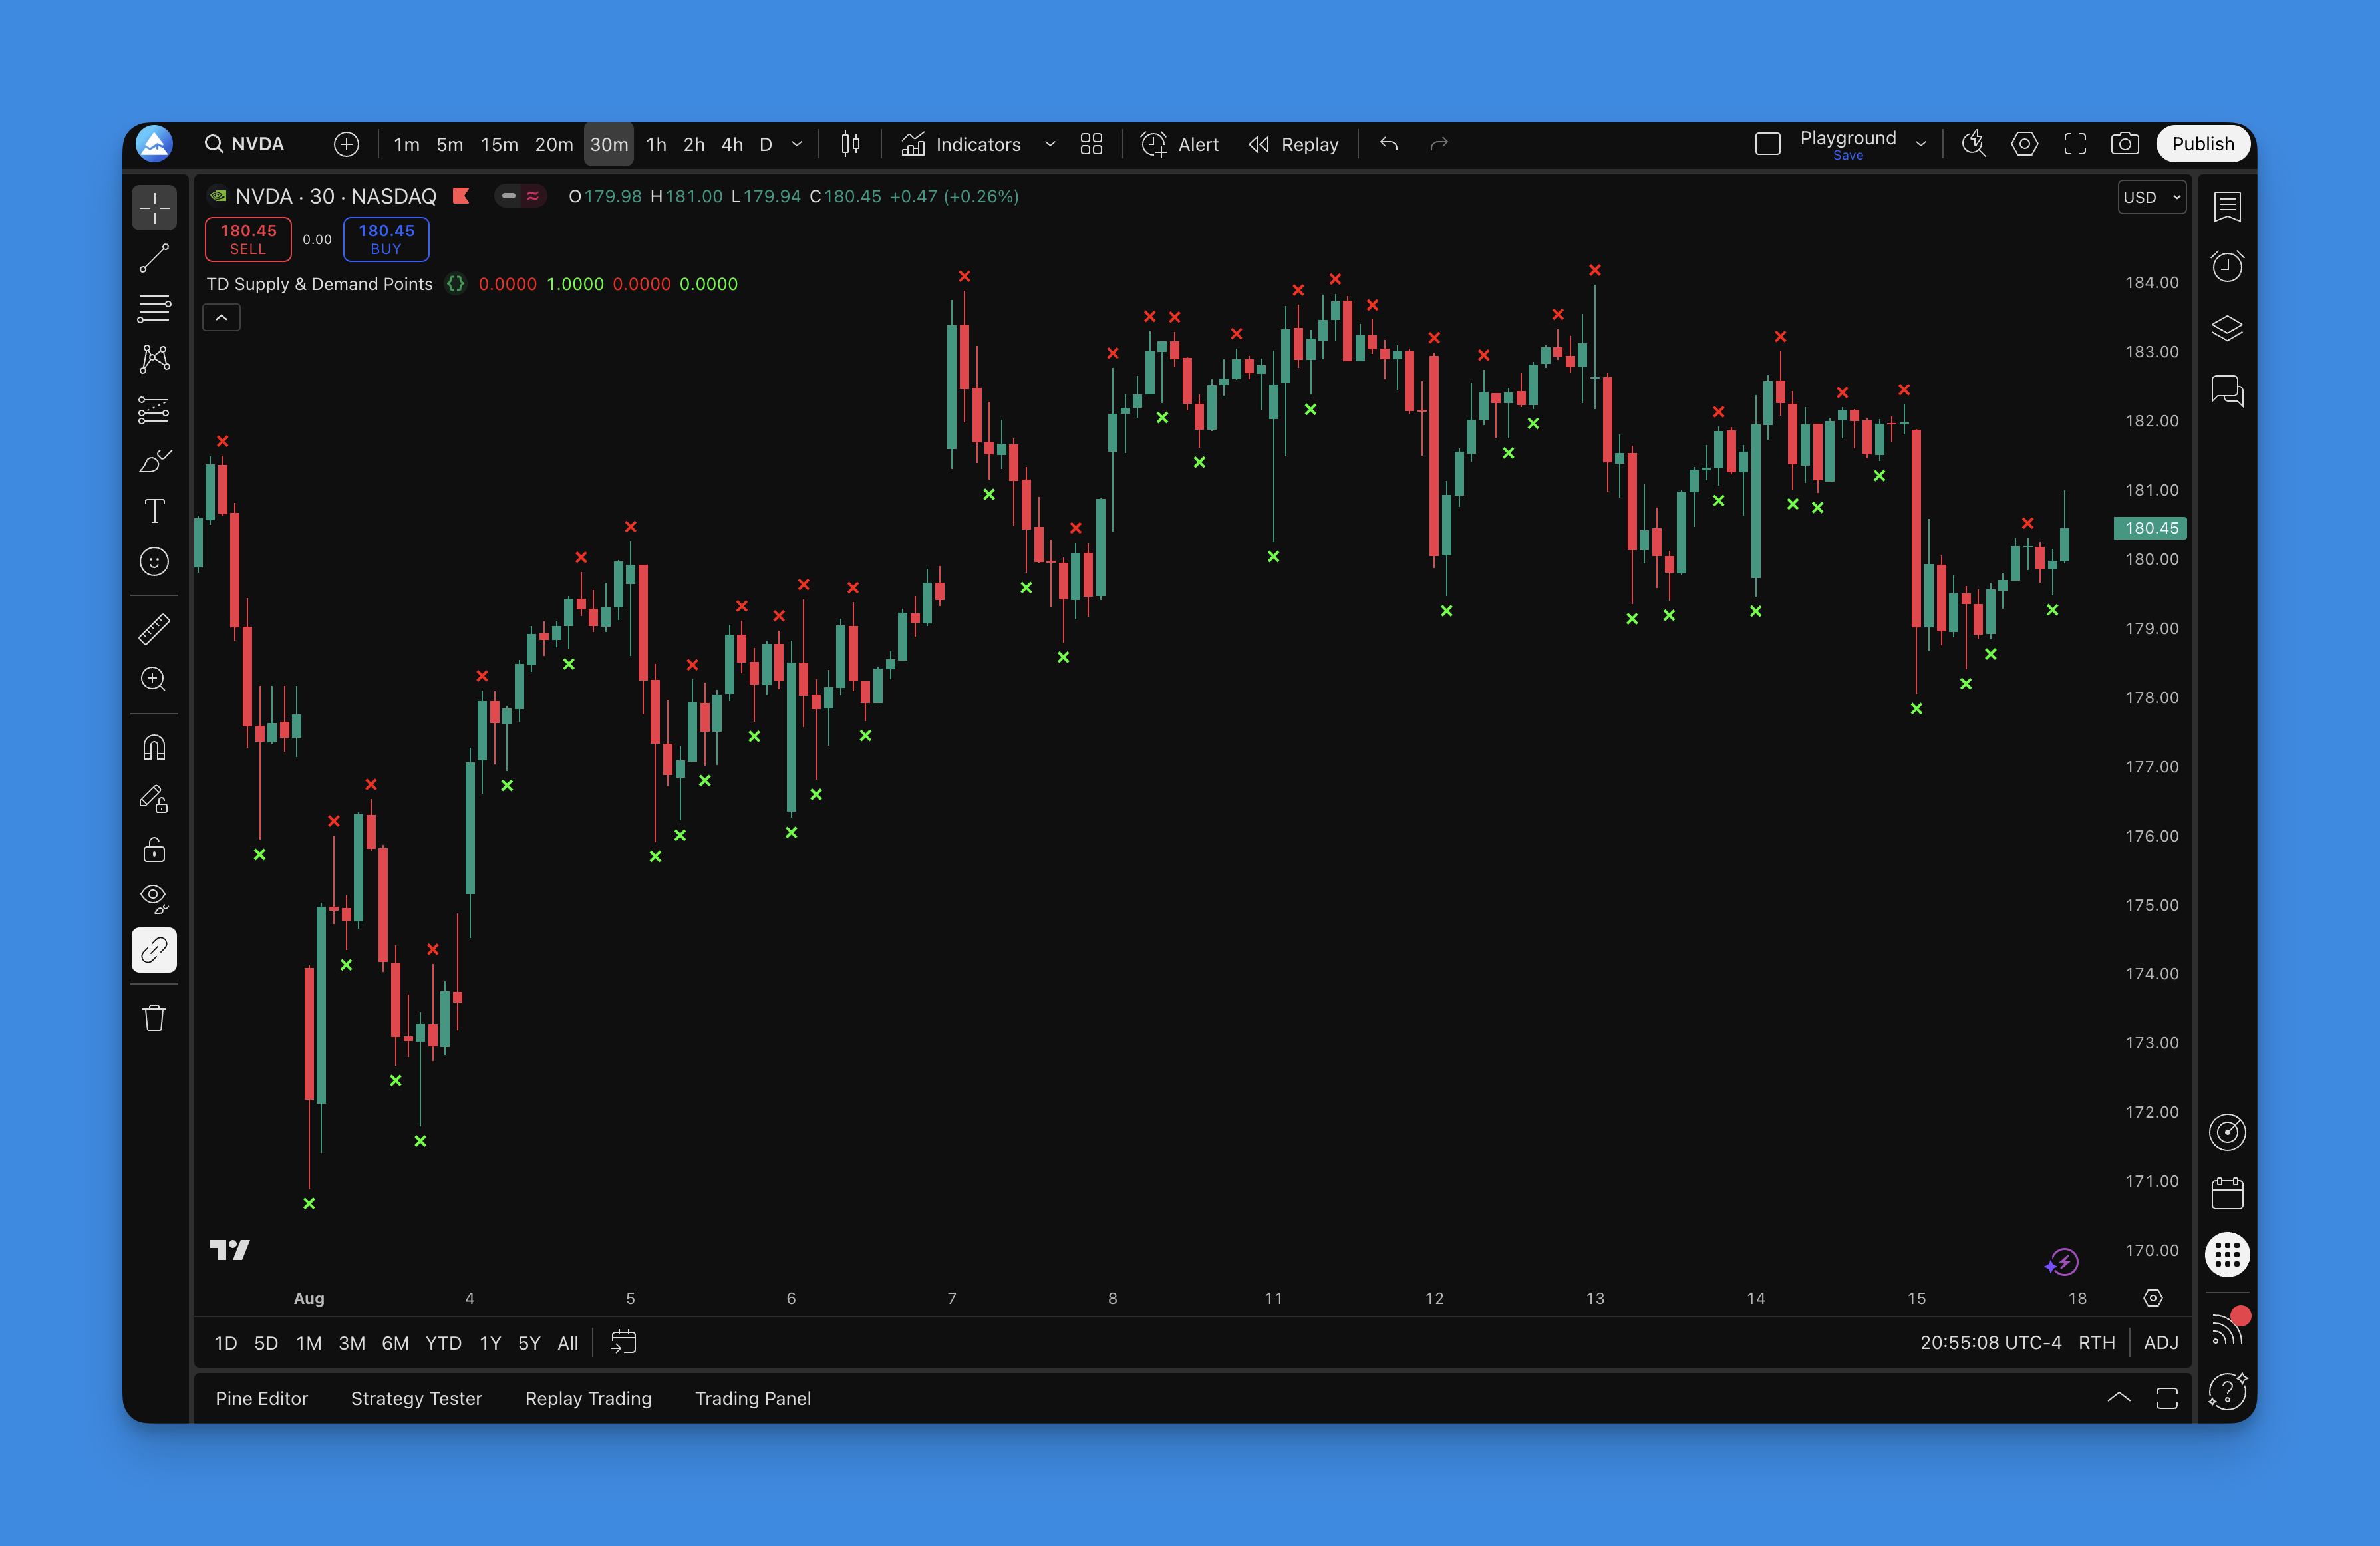
Watch for the breakout variation. Sometimes the 9-count becomes a continuation signal. If price breaks a key level right at count 9 and keeps going, the exhaustion reading was wrong. I've taken profitable continuation trades on NVDA this way.
Set your stop beyond the 9 candle. On daily charts that's usually 3-5% away. On 15-minute it's tighter. I adjust based on ATR, not a fixed percentage.
What I don't do. I don't take blind reversals on every 9-count. I haven't tested TD9 on penny stocks or thin forex pairs — signal quality drops when liquidity is low. I don't trade against the daily trend based on a 15-minute signal alone.
For alternative exhaustion detection, the best RSI divergence indicator uses a different approach that works better in range-bound markets. And if you need confirmation tools, the impulse MACD indicator pairs well with TD9 for momentum validation.
Entry and Exit Rules I've Backtested
Here's the rule set I use most. I ran these on SPY daily data from 2020 to 2024.
Entry:
- Countdown reaches 9.
- Price shows reversal confirmation — engulfing candle, pin bar, or close outside a key level.
- The bar after the 9-count closes in the opposite direction of the countdown trend.
Exit:
- Stop: 1 ATR beyond the 9-count candle's extreme.
- Take profit 1: 1.5x risk (partial close).
- Take profit 2: next major support or resistance level.
- Time stop: exit if no progress within 5 bars on daily, 10 bars on lower timeframes.
Backtest Results (SPY daily, 2020-2024):
| Metric | Value |
|---|---|
| Win rate | 52% |
| Average win | 3.2% |
| Average loss | 2.1% |
| Max consecutive losses | 4 |
| Best conditions | Trending markets with clear setup phases |
The strategy struggles in sideways markets. During ranges the countdown fires too often and false signals pile up. I skip those periods entirely.
Common Mistakes
Trading every 9-count. The signal works best with structural confluence. A random 9-count in the middle of a range is just noise.
Ignoring setup quality. If the setup bars were erratic, the countdown will be too. I skip setups where more than half the bars are inside bars or dojis.
Entering without confirmation. Jumping in the instant 9 prints is gambling. I wait for the next bar to confirm before I enter.
Wrong timeframe. A scalper doesn't need the daily 9-count. A position trader shouldn't act on the 15-minute version. Match the timeframe to your holding period.

Best Settings
Standard parameters work: close[4], count of 9 for both setup and countdown. DeMark's decades of research are hard to beat.
Display settings I use:
- Bullish numbers above candle in green
- Bearish numbers below candle in red
- Number 9 highlighted with a larger font
- Numbers 1-3 hidden to reduce visual clutter
I've seen traders change the lookback to close[6] or close[8]. At that point you're not running DeMark's logic anymore. I haven't tested those variations enough to trust them.
When TD9 Fails
No indicator works all the time. Here's where TD9 falls short:
- Strong trends that keep going. The 9-count isn't a ceiling. Some trends just push through exhaustion signals.
- Low liquidity assets. The count fires erratically on illiquid stocks and crypto pairs.
- News-driven moves. A Fed announcement or earnings report overrides the countdown logic. I don't use TD9 during high-impact events.
If you're looking for a different approach, the best MACD settings for 1-minute charts covers short-term momentum trading that doesn't rely on countdown logic at all.
▶What is the Tom Demark 9 (TD9) indicator?
The TD9 indicator runs the second phase of Tom DeMark's TD Sequential system. Once a setup of 9 consecutive closes finishes (each higher or lower than the close 4 bars earlier), the countdown tracks every bar that keeps closing in the same direction. When the count hits 9, it's warning you the trend might be running out of steam and a reversal could be coming.
▶How is the TD9 countdown different from the TD Sequential setup?
The TD Sequential setup is phase one — it counts 9 bars to confirm a trend is actually in place. The TD9 countdown is phase two — it starts after setup completion and counts up to 9 bars closing in the trend direction to spot when that trend may be losing momentum. Together they form a two-phase system for detecting trend exhaustion.
▶What does it mean when the TD9 countdown reaches 9?
A count of 9 signals potential trend exhaustion. It means the market has closed in the trend direction for 9 bars after setup completion. It doesn't guarantee a reversal — some markets keep trending right through it. Traders use the 9-count as a timing alert to watch for reversal candlestick patterns, confluence with support and resistance, or other confirmation before entering a counter-trend trade.
▶Which timeframes work best with the TD9 countdown?
Daily and weekly charts produce the most reliable TD9 signals with less noise, which makes them ideal for swing and position traders. The 4-hour and 1-hour charts work well for day traders. Lower timeframes like 15-minute generate more frequent signals but you'll need additional confirmation tools to filter the noise.
▶Can the TD9 indicator be used on crypto and forex markets?
Yes. The TD9 countdown works across all liquid markets including stocks, forex, and crypto. In crypto, higher volatility can create false signals on short timeframes, so the 4-hour or daily chart is a safer bet. In forex, the 24-hour continuous nature means counting runs without daily breaks, and the 4-hour to daily charts produce the best results.
▶What are the default settings for the TD9 indicator?
The core TD9 logic compares the current close to the close 4 bars back (close[4]). Tom DeMark set 9 as the count target for both the setup and countdown phases based on decades of market research. Most implementations offer display options like showing or hiding countdown numbers, color customization for bullish and bearish counts, and label positioning — but the underlying count parameters are typically left at their original values.
▶How do I add the TD9 indicator to TradingView?
You can add TD9 to TradingView by pasting a Pine Script implementation into the Pine Script Editor, then saving and applying it to your chart. Or use Pineify to generate optimized TD9 Pine Script code automatically — you copy the code into the editor and the indicator is ready with proper count logic and visual number labels.