Pineify Screener: A TradingView-Powered Technical Market Scanner
Markets rarely present opportunities one chart at a time. A breakout may be forming in one stock, momentum may be accelerating in another, and unusual volume may be appearing in a crypto pair while you are still switching tabs.
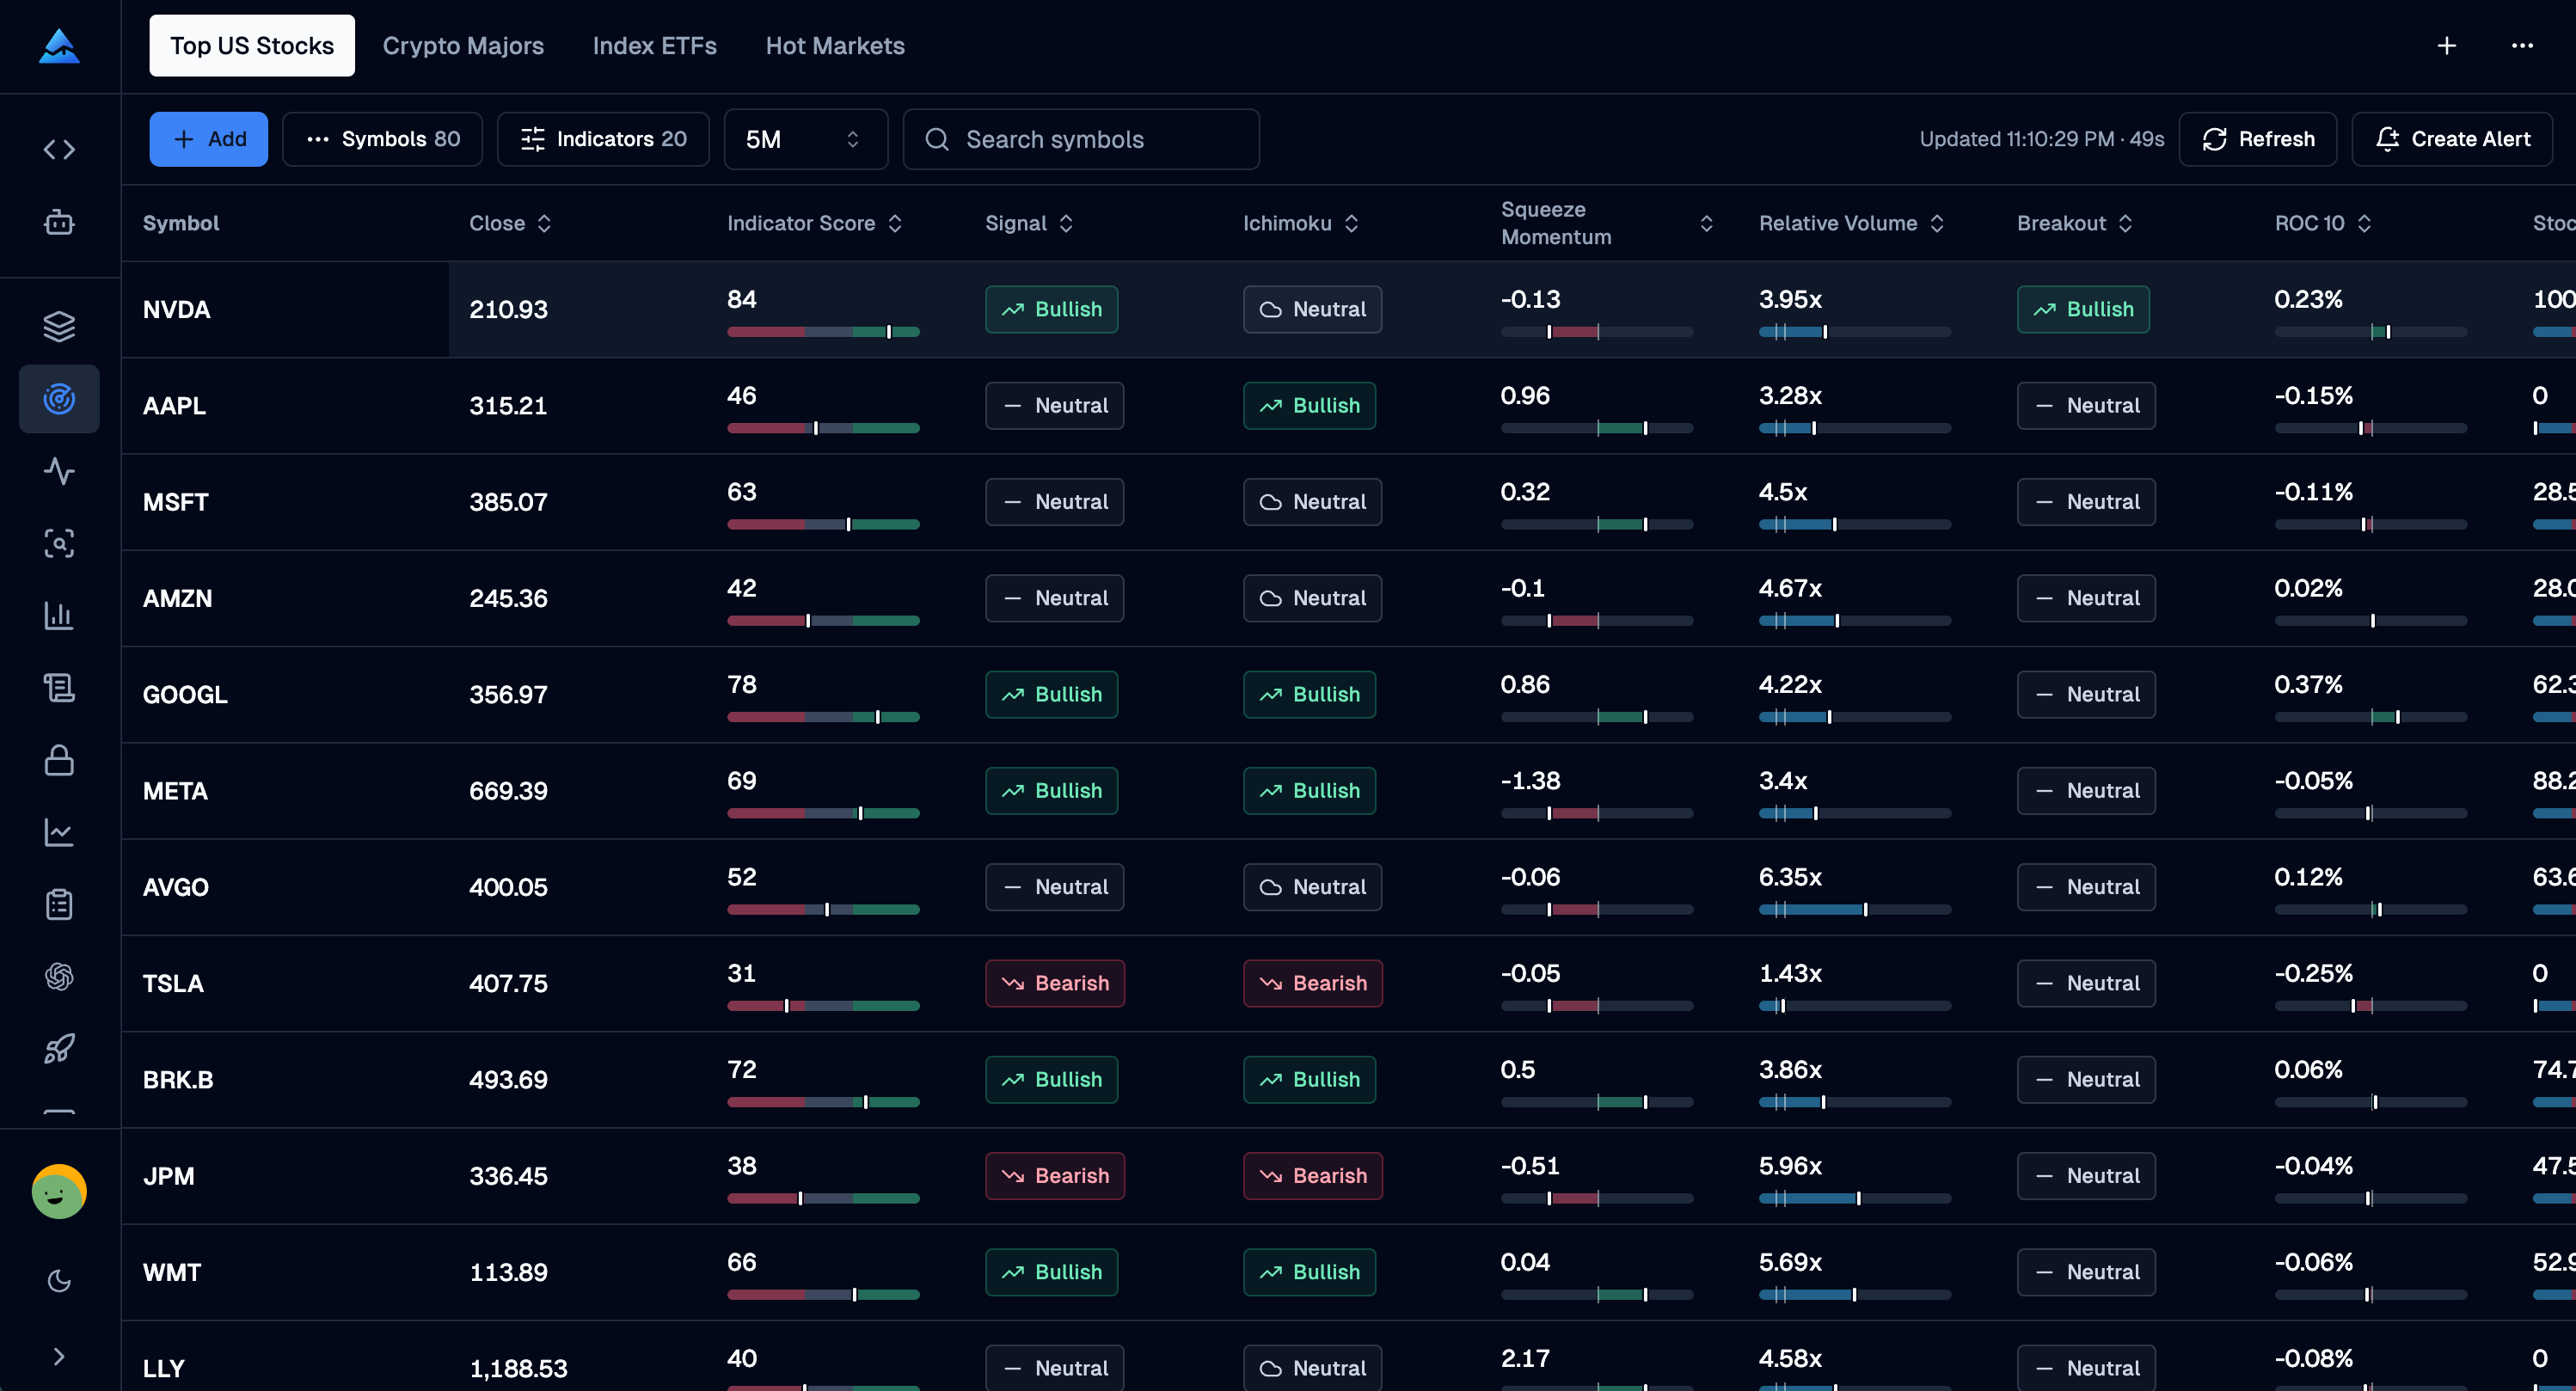
Pineify Screener turns that fragmented process into one focused workspace. It brings TradingView-powered technical data for stocks, crypto, ETFs, and other supported markets into a fast, visual table where you can compare signals, organize watchlists, and identify the instruments that deserve your attention.
The indicator library now includes 120 technical indicators, and Pineify will continue adding more over time. Instead of opening dozens of charts to answer basic questions, you can compare price, trend, momentum, volatility, volume, and composite signals side by side, then narrow a large market universe to the charts worth investigating.