Chande Momentum Oscillator: CMO TradingView Buy & Sell Signals
The Chande Momentum Oscillator (CMO) is a momentum indicator developed by Tushar Chande. It measures the net difference between upward and downward price movements over a set period and outputs values between +100 and -100.
What makes it different from other oscillators is how the calculation works. Instead of averaging gains and losses like the RSI does, the CMO subtracts total downward movement from total upward movement, then divides by the total range. I've kept this indicator on my TradingView charts since early 2024. It's been particularly useful for timing entries on SPY and TSLA.
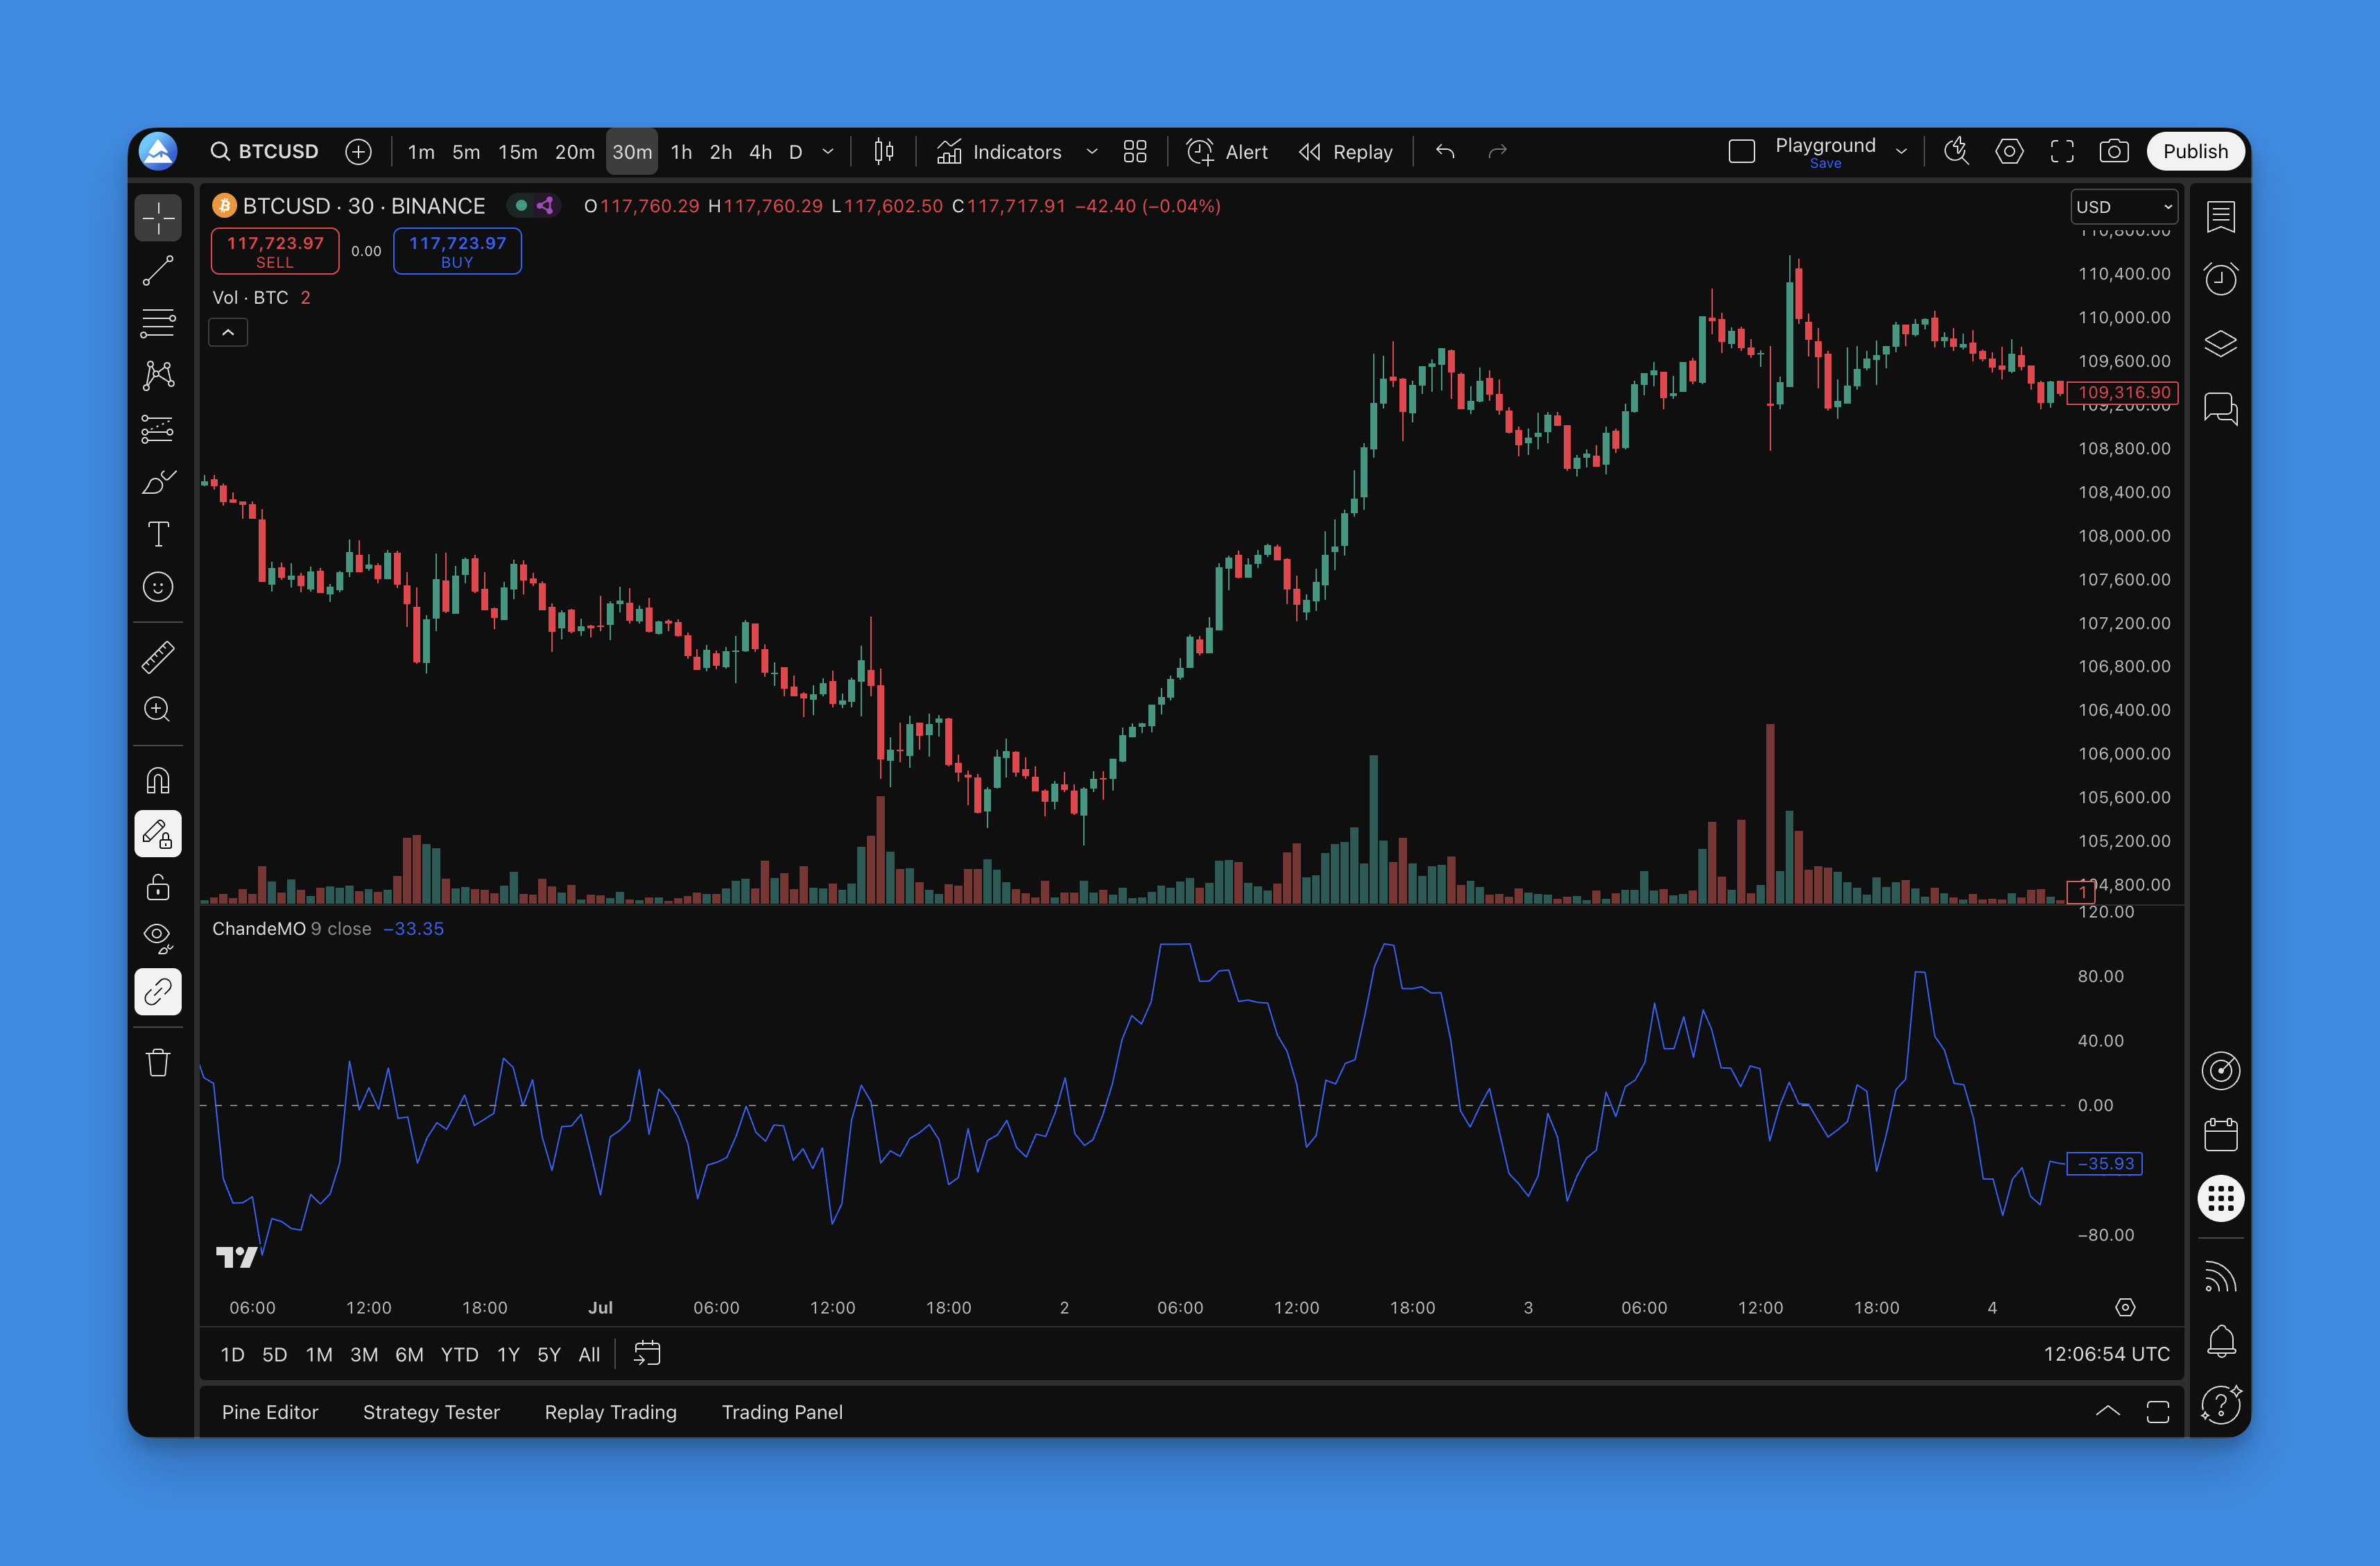
Compared to tools like the Awesome Oscillator or the Chaikin Oscillator, the CMO tends to produce cleaner signals in ranging markets. Readings above +50 signal strong upward momentum. Below -50, selling pressure dominates.
Here's what the CMO can tell you:
- Overbought conditions above +50
- Oversold conditions below -50
- Momentum shifts at the centerline
- Trend conviction levels
The formula: CMO = 100 x (Sum of Up Days - Sum of Down Days) / (Sum of Up Days + Sum of Down Days)
Getting the CMO on your TradingView charts
You have two options. Use TradingView's built-in Chande Momentum Oscillator from the Indicators library, or generate custom Pine Script code with your preferred settings. I usually go with the second option because I like adjusting the overbought and oversold thresholds for different assets.
Pineify makes this straightforward. Search for "Chande Momentum Oscillator" in their indicator library, adjust the period length and signal levels through a visual interface, and grab the generated code. Paste it into TradingView's Pine Script editor, and you're done.

No need to write Pine Script from scratch. Point, click, customize, generate.

Using the CMO in practice
Here are the setups I actually trade with.
Extreme readings
- CMO shoots above +50: I start looking for exhaustion. Not every +50 reading means a reversal, but it tells me to tighten stops and watch for confirmation.
- CMO drops below -50: I watch for bullish setups. A bounce from -50 has worked well on AMD and NVDA in my experience.
Divergence signals
This is where the CMO stands out. When price and the indicator disagree:
- Bullish divergence: Price makes lower lows, CMO makes higher lows. The selling pressure is fading. I caught a nice move on META this way in March 2025.
- Bearish divergence: Price makes higher highs, CMO makes lower highs. The buying momentum is running out. This kept me out of a bad entry on TSLA last November.
The RSI indicator works well alongside CMO for confirming these divergence patterns.
Centerline crossovers
- Crossing above zero: Bulls are gaining control
- Crossing below zero: Bears are taking over
Confirmation tool
I rarely enter a trade based on CMO alone. If I'm considering a long on NVDA and the CMO is above zero and rising, that gives me more confidence. If it's hovering near -40, I'd rather wait.
Settings that work
There's no universal CMO setting. What works on a 15-minute SPY chart won't work on a daily BTC chart. I haven't tested CMO on forex or commodities extensively, so I can't vouch for its performance there.
Period length
- 9-14 periods: Fast signals, more false alarms. I use 9 for scalping 1-minute ES futures.
- 14-21 periods: The sweet spot for most traders. My default is 14 on 15-minute charts.
- 21-30 periods: Fewer signals, higher reliability. I run 21 on daily charts for swing trades.
Timeframe recommendations
| Trading Style | Timeframe | CMO Period |
|---|---|---|
| Scalping | 1-5 min | 9 |
| Day trading | 15-60 min | 14 |
| Swing trading | 4H-daily | 21 |
| Position trading | Weekly | 30 |
Overbought and oversold thresholds
- Conservative: +/-50. Fewer trades, better win rate.
- Aggressive: +/-30. More action, more false signals.
- Custom: Adjust based on asset volatility. I use +/-55 for crypto and +/-45 for large-cap stocks.
Backtesting your CMO strategy
Before risking real capital, test your setup. I've seen too many traders jump straight into live trading with a new indicator and blow up their account.
Build a solid Pine Script strategy framework to test CMO signals properly. Here's what to backtest:
Entry rules
- Long when CMO bounces from -50 or crosses above zero
- Short when CMO drops from +50 or crosses below zero
- Divergence entries with a confirmation filter (I use a 2-bar delay)
Exit rules
- Reverse when CMO flips direction
- Take profit when CMO hits +50 (longs) or -50 (shorts)
- Hard stop based on ATR, not a fixed dollar amount
What to check
- Win rate and profit factor across different market regimes
- Maximum drawdown during choppy periods
- How the strategy performed in 2022 versus 2023
Pineify's backtesting tool handles this. You can run different position sizes, check worst-case scenarios, and tune your entry and exit rules before deploying with real money.
Frequently Asked Questions
▶What is the Chande Momentum Oscillator (CMO)?
The Chande Momentum Oscillator (CMO) is a momentum indicator created by Tushar Chande. It tracks the difference between total upward and downward price movement over a chosen period, normalized to a range of +100 to -100. Unlike the RSI, it uses both positive and negative price changes in its calculation, making it more responsive to recent price action.
▶How is CMO different from RSI?
Both are momentum oscillators, but they calculate things differently. RSI only looks at the ratio of average gains to average losses. The CMO captures net momentum by subtracting the sum of down moves from the sum of up moves. This generally makes the CMO more responsive and less prone to false signals in ranging markets.
▶What are the best CMO settings for day trading?
For day trading on 15-minute to 60-minute charts, a 14-period CMO is a solid choice. It catches intraday momentum shifts without generating too many false signals. The +/-50 overbought and oversold levels pair well with this setting for spotting potential reversal points.
▶How do I add the CMO indicator to TradingView?
You can add it from TradingView's built-in Indicators library, or generate custom Pine Script code with your preferred parameters. For custom settings and alerts, try building this indicator with Pineify (https://pineify.app) to generate a version tailored to your period length and signal levels.
▶Can the CMO indicator predict trend reversals?
The CMO doesn't predict reversals with certainty. It highlights conditions where reversals are more likely. Key signals include extreme overbought or oversold readings above +50 or below -50, bullish or bearish divergences between price and CMO, and centerline crossovers. These signals work best with confirmation from other technical tools.