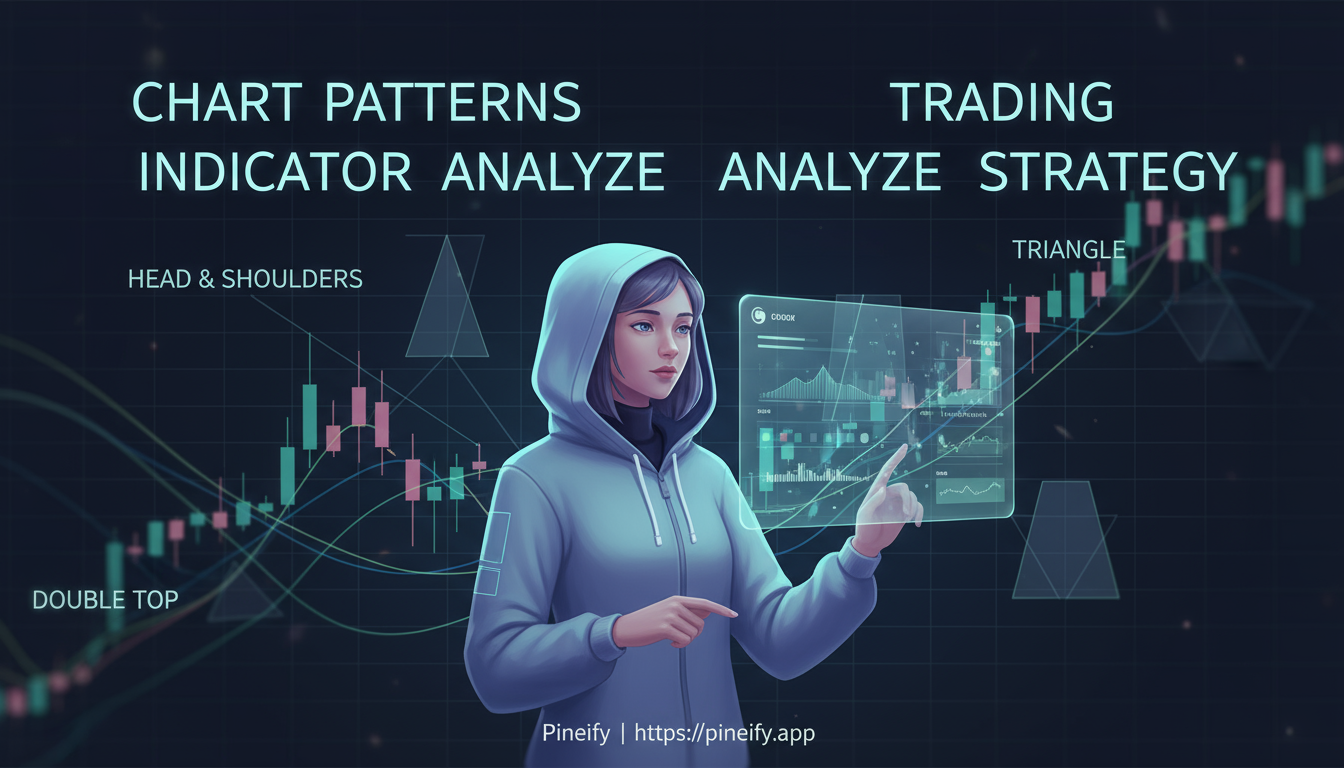
Chart Patterns Indicator: Automatic Pattern Detection on TradingView
You spot what looks like a head and shoulders on your screen, but you're not sure if it's real. The chart patterns indicator on TradingView is an automated tool that scans price action and draws formations like flags, triangles, and double tops directly on your chart. It saves hours of manual work.
What Are Chart Patterns, Really?
Chart patterns are shapes the market leaves behind. They form when buyers and sellers push price into recognizable structures. Most fall into two types:
- Reversal Patterns suggest the current trend may change direction. Think of them as the market signaling exhaustion.
- Continuation Patterns suggest the trend will keep going after a brief pause.
Here are the main ones you'll see:
| Pattern Type | Example | What It Often Suggests |
|---|---|---|
| Reversal | Head and Shoulders | An uptrend may be ending. |
| Reversal | Double Top | Price is struggling to push higher. |
| Continuation | Flag / Pennant | A pause before the trend resumes. |
| Continuation | Triangle | The market is coiling before a breakout. |
I've been trading for about six years, and I still find it faster to let the indicator do the scanning. Manual pattern spotting works, but it eats up time I'd rather spend planning entries.
TradingView's Chart Patterns Indicator
If you've got a Premium TradingView plan, the Auto Chart Patterns indicator is available from the indicators menu. It scans both historical and live data, drawing patterns as they form. It even projects price targets based on the pattern's height.
It catches:
- Bullish and bearish flags
- Double bottoms and tops
- Inverse head and shoulders
I prefer using it on 4-hour and daily charts for swing trades. On lower timeframes, the noise tends to produce more false signals. You can open the indicator settings and adjust sensitivity, colors, and line styles to filter out weaker patterns.
Types of Chart Patterns You Can Spot
Here's what the indicator watches for:
- Bullish and Bearish Flags. A flag looks like a small rectangle sloping against the trend. It forms after a sharp move and typically signals continuation. I've seen these work best on strong trending days in SPY.
- Double Tops and Bottoms. An M-shaped double top at the end of an uptrend, or a W-shaped double bottom at the end of a downtrend. These are reversal signals.
- Triple Tops and Bottoms. Same idea as doubles, but with three peaks or troughs. The extra test often makes the signal more reliable.
- Pennants. Small symmetrical triangles that form after rapid price moves. They act as continuation patterns.
- Wedges. Converging lines that can slope up or down. Context matters here. A rising wedge in a downtrend can signal continuation, while in an uptrend it may signal reversal.
- Head and Shoulders. Three peaks with the middle one highest. This is a classic reversal. The inverse version signals the end of a downtrend.
- Rectangles. Price moving sideways between support and resistance. A breakout in either direction is the key event.
- Triangles. Ascending (flat top, rising bottom, often bullish), descending (flat bottom, falling top, often bearish), and symmetrical (direction less clear).
- Elliott Wave Patterns. More advanced. They map market psychology into impulse and corrective waves.
Quick reference:
| Pattern Name | What It Often Suggests |
|---|---|
| Bullish Flag | Continuation of Uptrend |
| Bearish Flag | Continuation of Downtrend |
| Double Top | Reversal from Uptrend to Downtrend |
| Double Bottom | Reversal from Downtrend to Uptrend |
| Pennant | Continuation of Prior Trend |
| Head and Shoulders | Reversal from Uptrend to Downtrend |
| Inverse Head & Shoulders | Reversal from Downtrend to Uptrend |
| Rectangle | Consolidation - watch the breakout |
How to Get the Most Out of This Indicator
Open a TradingView chart, go to the Technicals tab, and add Auto Chart Patterns. It starts scanning immediately. Watch the breakout points and target projections the indicator draws. Those are your entry and exit zones.
Don't let the indicator work alone. I pair it with RSI to check momentum and ATR to set stop-losses that adapt to volatility.

Pineify's visual editor lets you build a custom indicator that layers pattern detection with RSI and ATR without writing code. That kind of integrated analysis helps confirm signals before you take a trade.
I remember Auto Chart Patterns catching a clean inverse head and shoulders on Tesla in early 2024. The neckline was clear, and when price broke above it, the move ran about 12% over the next two weeks. That trade worked because the broader market was in a clear uptrend at the time.
You can adjust detection sensitivity in the settings to show only the most reliable patterns. I suggest you scroll back on a few charts and see how the pattern performs before trading it live. This backtesting guide walks through how to do that on TradingView.
Why Automate Pattern Detection?
Automation removes the emotional bias from spotting patterns. When the tool draws a formation, it's based on rules you set, not gut feeling. That matters when the market is moving fast.
For newer traders, having patterns drawn in real time is like watching a live tutorial. You learn to recognize these shapes without the frustration of eyeballing raw bars.
| Trading Style | Recommended Timeframe |
|---|---|
| Scalping / Intraday | 1-minute to 15-minute |
| Swing Trading | 1-hour to Daily |
| Long-term Investing | Weekly to Monthly |
The Auto Chart Patterns indicator works across styles. I've used it for both swing trades on daily charts and quick intraday setups on 15-minute bars. The settings differ, but the core logic stays the same.
Trading Strategies with Chart Patterns
A simple approach: wait for the pattern to form and confirm. For a double bottom, I go long when price breaks above the neckline. I place my stop just below the lowest low of the pattern. For profit targets, I measure the height of the pattern and project that upward.
For continuation patterns like a bullish pennant, I buy the breakout above the pennant's upper trendline. The flagpole length gives me a profit target.
I combine patterns with trendlines for extra confirmation. If a breakout also breaks a key trendline, that's a stronger signal. I also use ATR to set stops that adjust with volatility.
Don't risk more than 1-2% of your account on a single trade, regardless of how clean the pattern looks. False breakouts happen, especially in choppy markets. I watch for RSI divergence to catch fake-outs early.
| Pattern Type | Entry Trigger | Stop-Loss | Profit Target |
|---|---|---|---|
| Reversal (e.g., Double Bottom) | Break above neckline | Below pattern low | Pattern height projection |
| Continuation (e.g., Bullish Pennant) | Upside breakout | Below pattern low | Flagpole length |
If you want to automate the scanning part, you can write Pine Script alerts that notify you when a specific pattern forms. Understanding Pine Script volume functions can help you add volume confirmation to these setups.
Real-World Examples
I already mentioned the Tesla inverse head and shoulders from early 2024. That one stood out because all three components lined up cleanly. The left shoulder, the deeper head, and the right shoulder developed over about three weeks. The breakout above the neckline happened on above-average volume, and the price moved 12% in two weeks without a major pullback.
Another one I track regularly is the bearish flag on EUR/USD. When the euro weakens after a news event, the drop is often sharp, then price consolidates in a tight range. That flag shape is the market catching its breath before the next push lower. The Auto Chart Patterns indicator draws it automatically, and I take a short position when price breaks below the flag's lower boundary.
Things to Keep in Mind
The indicator is useful, but it has limits. I haven't tested it extensively on crypto, but my assumption is the higher noise in that market would produce more false signals.
| Limitation | What It Means |
|---|---|
| False Signals in Choppy Markets | When price moves sideways, the indicator may flash signals that go nowhere. Double-check with other tools. |
| Premium Plan Only | This feature requires a Premium TradingView subscription. |
| Based on Past Data | Patterns are historical. They suggest probabilities, not guarantees. |
| Over-Tweaking Backfires | Adjusting settings to fit past data perfectly can reduce future accuracy. |
The main thing is to treat this as one tool among many, not a crystal ball.
Frequently Asked Questions
▶What is the Chart Patterns Indicator on TradingView?
It is an automated tool built into TradingView that scans price charts and identifies formations like head and shoulders, double tops and bottoms, flags, pennants, wedges, and triangles. It draws patterns directly on your chart and can project price targets based on the pattern height.
▶How do I add the Chart Patterns Indicator to my chart?
Open the Indicators menu, search for Auto Chart Patterns, and click add. It starts scanning past and live data immediately. You need a Premium TradingView plan. If you want to customize the detection, try building your own indicator with Pineify's editor.
▶Can I adjust the detection sensitivity?
Yes. Open the settings panel after adding the indicator. You can tweak sensitivity, colors, line styles, and choose which patterns to scan for.
▶Is it good for beginners?
I think it is. It highlights patterns in real time, which helps you learn without the frustration of manual chart reading.
▶How reliable are the price targets?
They use the standard measured-move method from the pattern height. I wouldn't rely on them alone. Combine with volume, RSI, or trendline breaks for better results.
▶What should I do when a pattern gives a false signal?
Always use a stop-loss. Check momentum indicators like RSI or MACD for confirmation before acting on a breakout. Keep risk to 1-2% of your account per trade.
Using the Indicator in Your Routine
If you're on a free TradingView account, upgrading to Premium gives you access to the Auto Chart Patterns feature. Before trading with real money, spend time on demo charts. Click on different patterns and see how they look on various timeframes.
The TradingView community shares setups and strategies regularly. I've picked up a few useful tweaks from forum posts. For deeper learning:
| Action | Why It Helps |
|---|---|
| Backtest on historical data | See how a pattern would have played out last year. |
| Add patterns to your trading plan | Build them into your entry and exit rules instead of treating them as isolated signals. |
The goal is to go from spotting patterns to understanding what they mean in context. If you're comparing platforms, this AmiBroker vs TradingView comparison might help.
I'd love to hear what pattern has been working for you recently. Share it in the comments so we can learn from each other.