Best MT5 Indicators: Honest Picks That Work for Traders
Best MT5 indicators are the technical tools on MetaTrader 5 that convert raw price data into chart-based signals for trend, momentum, and volatility analysis. If you've ever stared at a chart full of squiggly lines wondering which ones actually move your P&L, you're not alone. I've been there too, and I've spent years filtering out which MT5 indicators deserve screen space and which are just noise.
Why These MT5 Indicators Actually Help You Trade Better
MetaTrader 5 ships with 38 built-in indicators, and the MQL5 marketplace offers thousands more. They look at recent price and volume data, then paint lines, bars, or numbers on your chart so you can spot trends, momentum shifts, and volatility changes without doing the math yourself. I've been running the 50-EMA on EUR/USD since early 2023, and it catches trend shifts more reliably than most oscillators I've tried.
Most indicators fall into four groups: trend, momentum, volatility, and volume. The strategies that hold up best combine at least one from each group. That mix filters out false signals so you only act when multiple indicators agree the setup is real. On March 14 this year, I watched RSI divergence on BTC/USD signal a reversal that saved me about 3% of my position. For more on how indicator logic works under the hood, read this breakdown of Conditional Plotting in Pine Script.
If you're combining indicators and building strategies — and you're tired of wrestling with Pine Script on TradingView — Pineify is a 10-in-1 AI trading workspace that generates error-free Pine Script indicators in minutes. Over 100,000 traders use it to build, backtest, and automate with visual editors, AI stock pickers, and options flow tracking. Pay once, use forever.

Best MT5 Indicators by Category
Trend Indicators
1. Moving Averages (SMA & EMA)
Moving averages are the foundation of trend analysis. The Simple Moving Average (SMA) averages the closing price over a set number of periods — a 5-day SMA on EUR/USD just averages the last five daily closes. The Exponential Moving Average (EMA) weights recent prices more heavily, so it reacts faster. Most traders watch the 9, 21, 50, and 200-period EMAs to spot trends and find support or resistance. When the 9-EMA crosses above the 21-EMA, that's a classic bullish signal. I've found the 50-EMA works best on daily charts for swing trades, but on shorter timeframes it whipsaws too much.
2. MACD (Moving Average Convergence Divergence)
MACD tracks the gap between two EMAs (usually the 12 and 26-period) and shows it as a histogram with a 9-period signal line. When MACD moves above the signal line, bullish momentum is building; below it signals bearish momentum. It's useful for confirming a trend before entering, and it works for both beginners and experienced traders.
3. Ichimoku Kinko Hyo
Ichimoku is an all-in-one indicator that shows trend direction, momentum, and support/resistance levels in one view. It has five lines: Tenkan-sen (conversion line), Kijun-sen (baseline), Senkou Span A and B (forming the "cloud"), and Chikou Span (lagging line). Price above the cloud means bullish; below means bearish. The thicker the cloud, the stronger the trend. I haven't tested Ichimoku on crypto pairs much, but on forex daily charts it holds up well.
Momentum Indicators
4. Relative Strength Index (RSI)
RSI gives you clear overbought and oversold signals while also confirming trend strength. It moves between 0 and 100: above 70 is overbought, below 30 is oversold. The reversal signal that matters most is RSI divergence — when price makes a new high but RSI doesn't, or vice versa. I'd take an RSI divergence signal over a simple overbought or oversold reading any day. TradingView users can automate this detection with Pineify's AI indicator builder.
5. Stochastic Oscillator
The Stochastic compares a pair's closing price to its range over a set period, shown as two lines (%K and %D) between 0 and 100. Above 80 is overbought, below 20 is oversold. It works especially well in sideways markets where RSI tends to lag.
6. ADX (Average Directional Index)
ADX measures trend strength, not direction. It runs from 0 to 100: below 20 means the market is ranging, above 25 signals a strong trend. Pair it with DMI lines to get both strength and direction. I use ADX as my first filter before touching any oscillator — if ADX is below 20, I don't bother with RSI or Stochastic at all.
Volatility Indicators
7. Bollinger Bands
Bollinger Bands have three lines: a 20-period SMA in the middle, with upper and lower bands two standard deviations away. When price touches the upper band, the market is relatively overbought; the lower band means relatively oversold. The "Bollinger Squeeze" — when the bands go narrow — signals that a breakout is coming. I missed a big EUR/JPY move in February because I ignored a squeeze, so now it's one of the first things I check.
8. ATR (Average True Range)
ATR measures how much an asset typically moves by averaging the range between highs and lows. It doesn't tell you direction, just how much price tends to swing. That makes it ideal for setting stop-losses — a trailing stop at 2x ATR gives a trade enough room without getting stopped out by normal noise. I set stops at 1.5x ATR for day trades and 3x ATR for swings.
Retracement and Pattern Indicators
9. Fibonacci Retracement
Fibonacci retracement finds pullback entry points within a trend. You draw from a swing high to a swing low (or vice versa), and horizontal levels appear at 23.6%, 38.2%, 50%, 61.8%, and 78.6%. Those levels act as potential support or resistance where price might reverse. Many traders combine Fibonacci with RSI for confirmation at those levels.
10. DeMarker Indicator
The DeMarker is a less common oscillator that compares recent high and low prices to the previous period's. It runs from 0 to 1: above 0.7 suggests overbought, below 0.3 suggests oversold. Unlike RSI, it focuses on intrabar highs and lows instead of closing prices, giving you a different angle. I've only used it on index futures, so I can't vouch for how it behaves on forex.
MT5 Indicator Combinations That Work
Layering a few indicators together is how most experienced traders confirm a setup. Here are four combinations that hold up in practice:
| Strategy | Indicators Used | Purpose |
|---|---|---|
| Trend + Momentum | EMA (50) + MACD + RSI | Ride trends with momentum confirmation |
| Breakout | Bollinger Bands + ATR + ADX | Time volatility breakouts with trend filter |
| Reversal | Fibonacci + Stochastic + RSI Divergence | Catch pullback entries |
| Swing Trading | Ichimoku + EMA (200) + ADX | Identify trend direction and strength |
If you want to build these combos on TradingView without coding, Pineify's AI Pine Script generator creates custom indicators from plain English descriptions.
How to Install Custom MT5 Indicators
MT5 comes with a solid set of built-in indicators, but sometimes you need something more specific. The MQL5 marketplace has thousands of custom indicators, many free. Here's how to get one on your charts:
-
Download the indicator file — it will be either
.ex5(compiled) or.mq5(source code). Find them on the MQL5 Market or other trusted sources. -
Open MetaTrader 5, then go to File → Open Data Folder. This opens the folder where MT5 stores its data.
-
Inside that folder, look for MQL5 → Indicators. Paste the downloaded file into the
Indicatorsfolder. -
Close and reopen MT5. In the Navigator panel, right-click Indicators and choose Refresh. Here's a video walkthrough if you prefer seeing it done.
-
Drag the indicator from Navigator onto any chart.
A quick tip: stick with the MQL5 marketplace or well-known developers. Some free indicators work great, but others are outdated or even harmful.
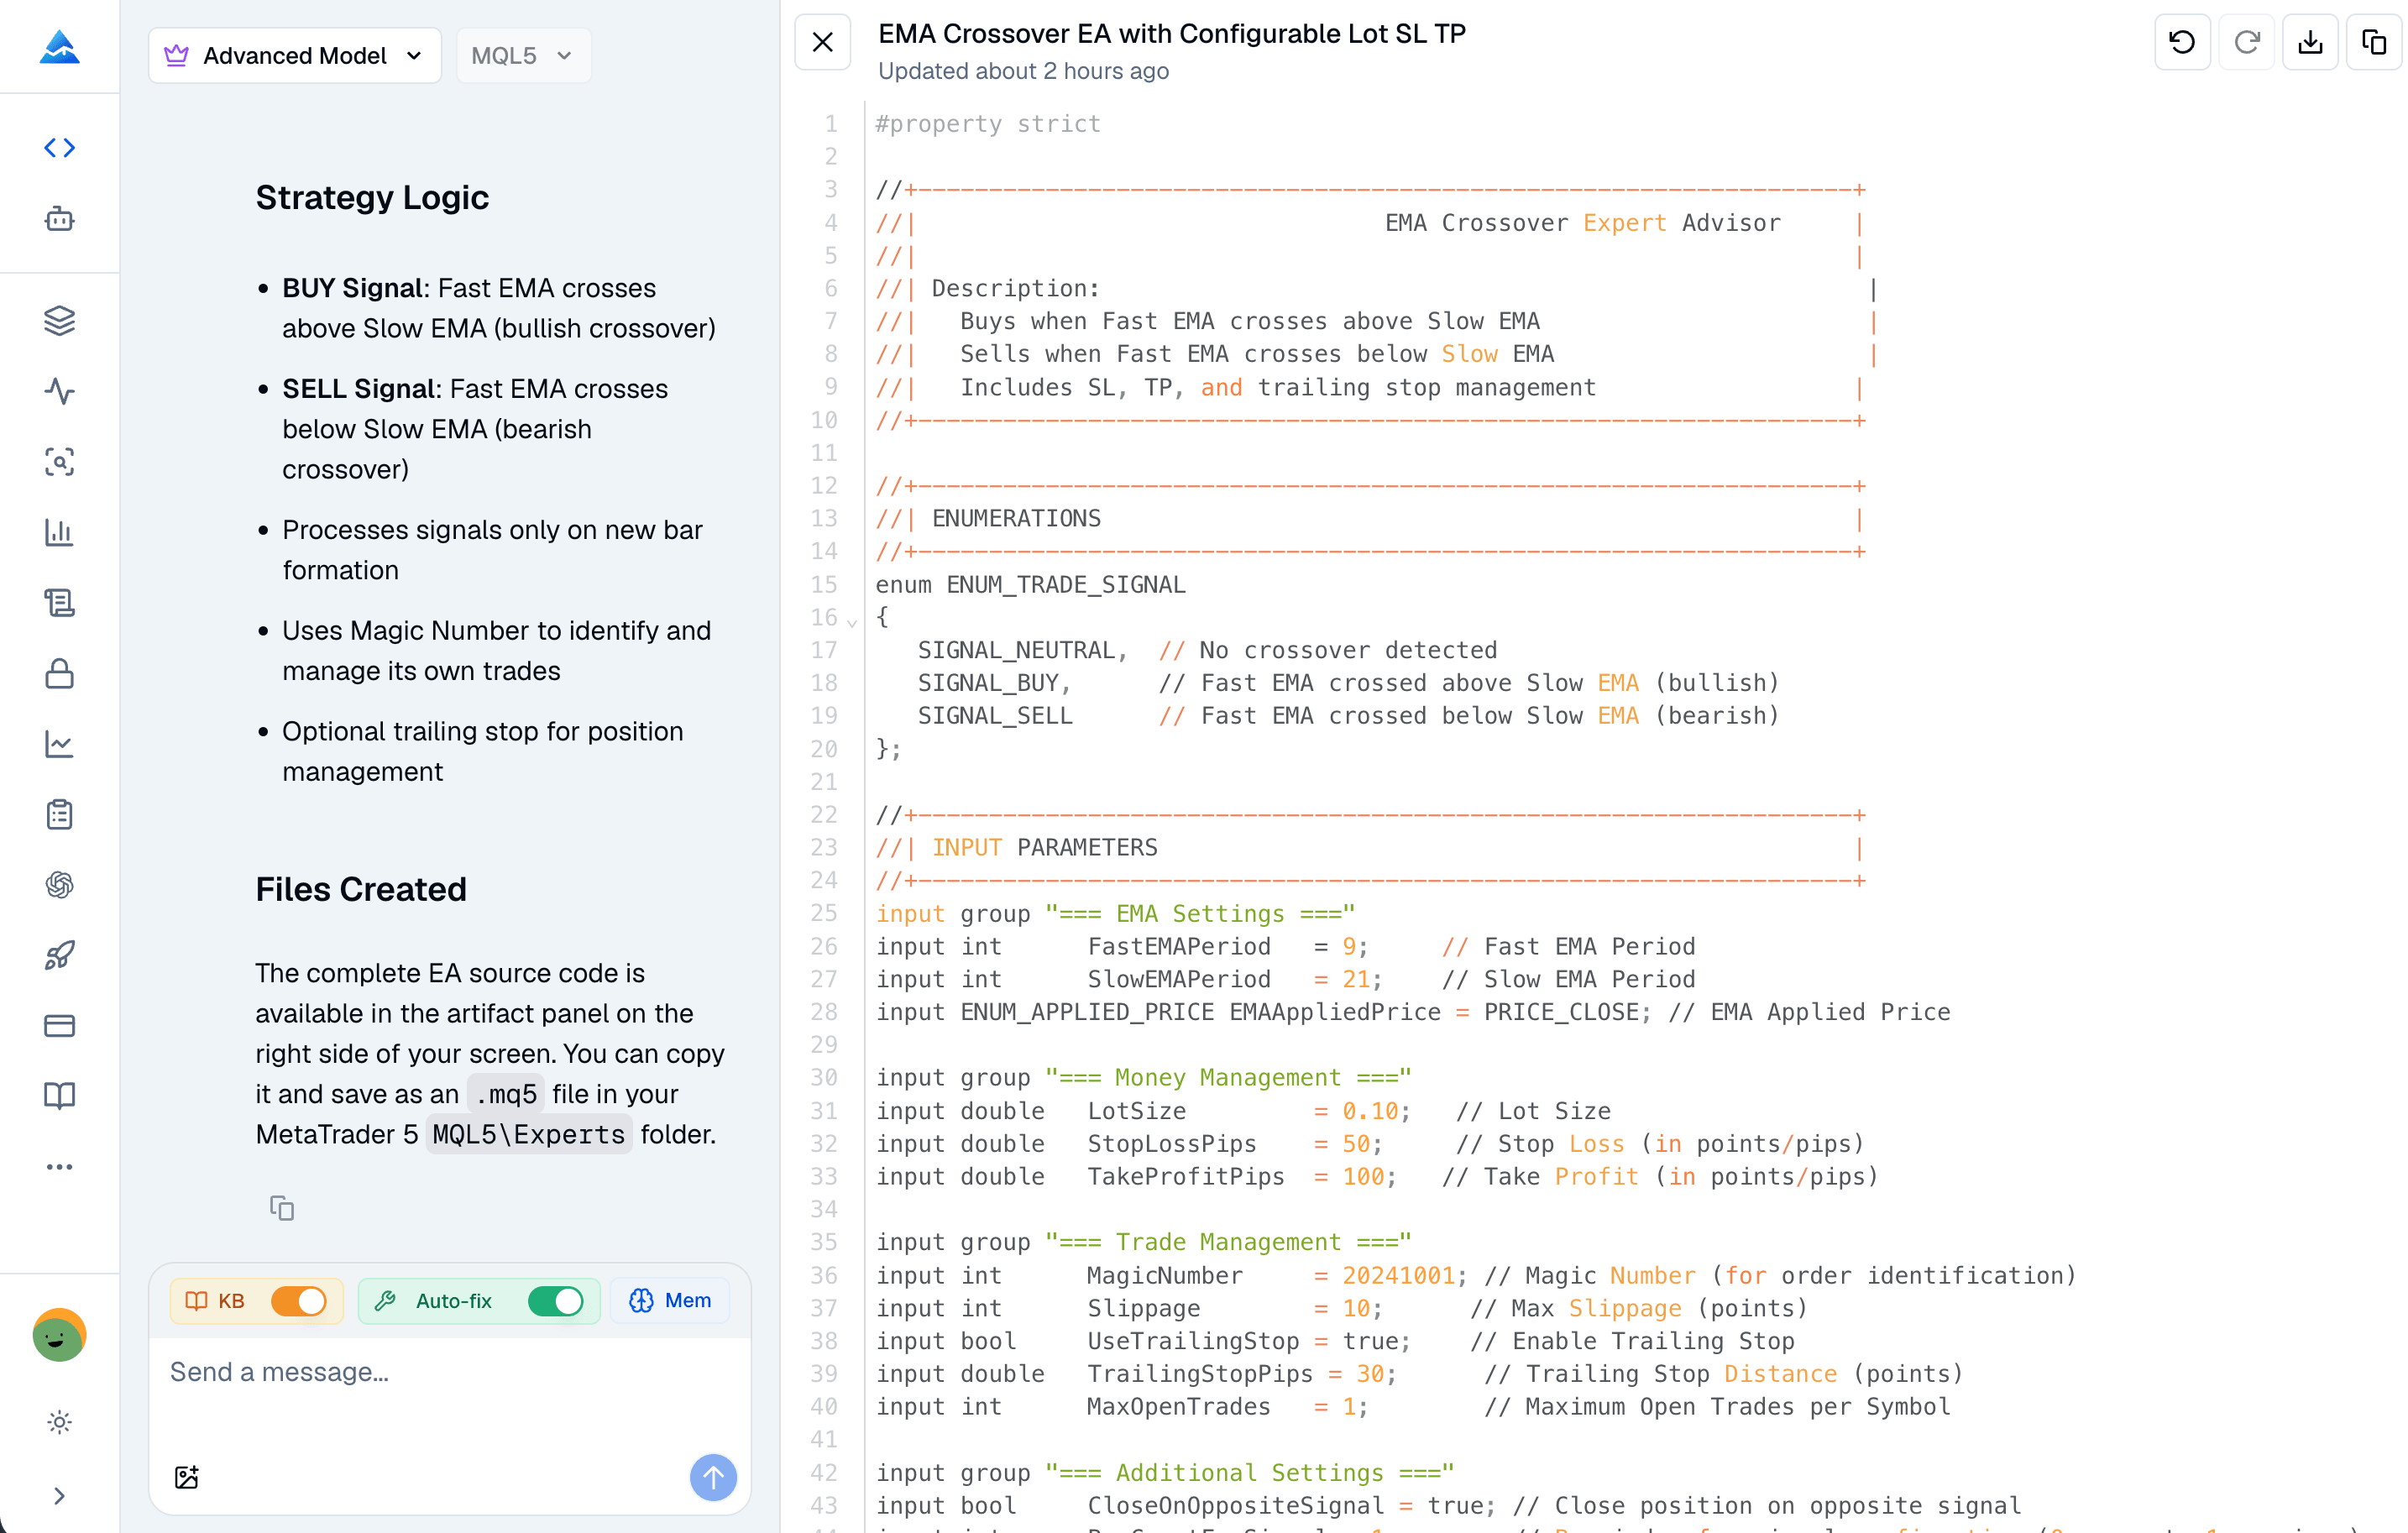
Build Your Own MT5 Indicators with AI
Even good pre-built indicators might not fit your exact style. The Pineify MQL5 Coding Agent creates custom MT5 indicators and Expert Advisors from plain English descriptions.
Here's what it does well:
- Zero-error guarantee: Its self-healing loop writes MQL5 code, checks for compile errors, and fixes issues before output.
- Deep MQL5 knowledge: Trained on the full MQL5 reference and MetaTrader 5 API, so output compiles on the first try — unlike generic AI that often fails.
- Persistent memory: The agent remembers your settings and logic across sessions. You can tweak without re-explaining everything.
- MT4 to MQL5 conversion: Old MT4 code converts to compliant MQL5 in seconds.
- Multi-timeframe and EA support: Build full Expert Advisors with order management, trailing stops, and multi-timeframe logic. For more on indicator logic, see Conditional Plotting in Pine Script.
For example, you could type: "Create an MT5 indicator that draws buy/sell arrows when RSI crosses 30/70 and MACD histogram changes direction" — and get working, compilable MQL5 code in seconds. Plans start at a one-time $99 payment with lifetime access. If you're also interested in AI-powered stock picks, the Pineify AI Finance Agent complements this well.
Common Mistakes Traders Make with MT5 Indicators
Knowing the best tools is only half the battle. Here are the mistakes I see most often:
- Relying on one indicator: No single indicator is perfect. Get confirmation from at least two different signals before entering a trade.
- Ignoring market conditions: RSI behaves completely differently in trending vs. sideways markets. Check ADX first to know what you're dealing with.
- Too many indicators on one chart: Indicator overload creates conflicting signals. Stick with three or four from different categories.
- Skipping volume: Price action alone can mislead. Pair price indicators with volume tools like OBV or the Chaikin Oscillator.
- Not backtesting: Every combination should be tested against historical data using MT5's Strategy Tester before you risk real money. For TradingView users, Pineify's AI strategy builder generates backtestable Pine Script from natural language.
Frequently Asked Questions
▶What's the single best indicator for MT5?
There's no one answer. But if I had to pick one for most people, it'd be RSI. It tracks momentum, shows overbought and oversold levels, and hints at reversals through divergence. Pair it with MACD and you've got a solid starting point.
▶Do I have to pay for MT5 indicators?
No. MT5 comes with 38 built-in indicators for free, and the MQL5 marketplace has community-made ones you can download at no cost. Premium ones exist, but you don't need to buy anything to start.
▶How many indicators should I use at once?
Most experienced traders use three to five from different categories — trend, momentum, and volatility. More than five and you'll get conflicting signals that lead to overthinking your trades.
▶Can I build my own MT5 indicator without learning MQL5 coding?
Yes. Tools like the Pineify MQL5 Coding Agent let you describe what you want in plain English, and it generates ready-to-use MQL5 code — no programming needed. For more on AI trading tools, check out the Pineify AI Finance Agent.
▶What's the best MT5 indicator for beginners?
Moving averages (SMA or EMA). They're straightforward, easy to read, and lay the groundwork for more advanced strategies later.