Pineify AI Stock Picker: AI-Powered Stock Screener & Daily Picks
I used to bounce between a free screener, a broker options tab, and a charting tab just to answer one question: is this name actually worth my attention today? The workflow felt fragmented, and I was always one tab short when earnings, dividends, or sentiment mattered. When I moved that routine into Pineify's AI Stock Picker, the difference was less about hype and more about having a single place where scores, chains, and filings line up on the same ticker.
What is an AI Stock Picker?
An AI stock picker is software that ranks equities by fusing fundamentals, technical context, and sentiment into repeatable daily outputs you can compare side by side. Pineify's version ingests broad market coverage, refreshes signals on a daily cadence, and surfaces names through both predictive scores and human-readable curated lists.
The claim is specific: multiple data dimensions — revenue and earnings quality, price and momentum structure, analyst consensus, and sentiment — are collapsed into one ranked 1-10 score that updates every day. Whether you treat that score as a first filter or a tie-breaker is up to your own discipline; the product's job is to standardize the first pass across thousands of stocks.
Key Features
Pineify's AI Stock Picker bundles eleven named capabilities into a single research stack:
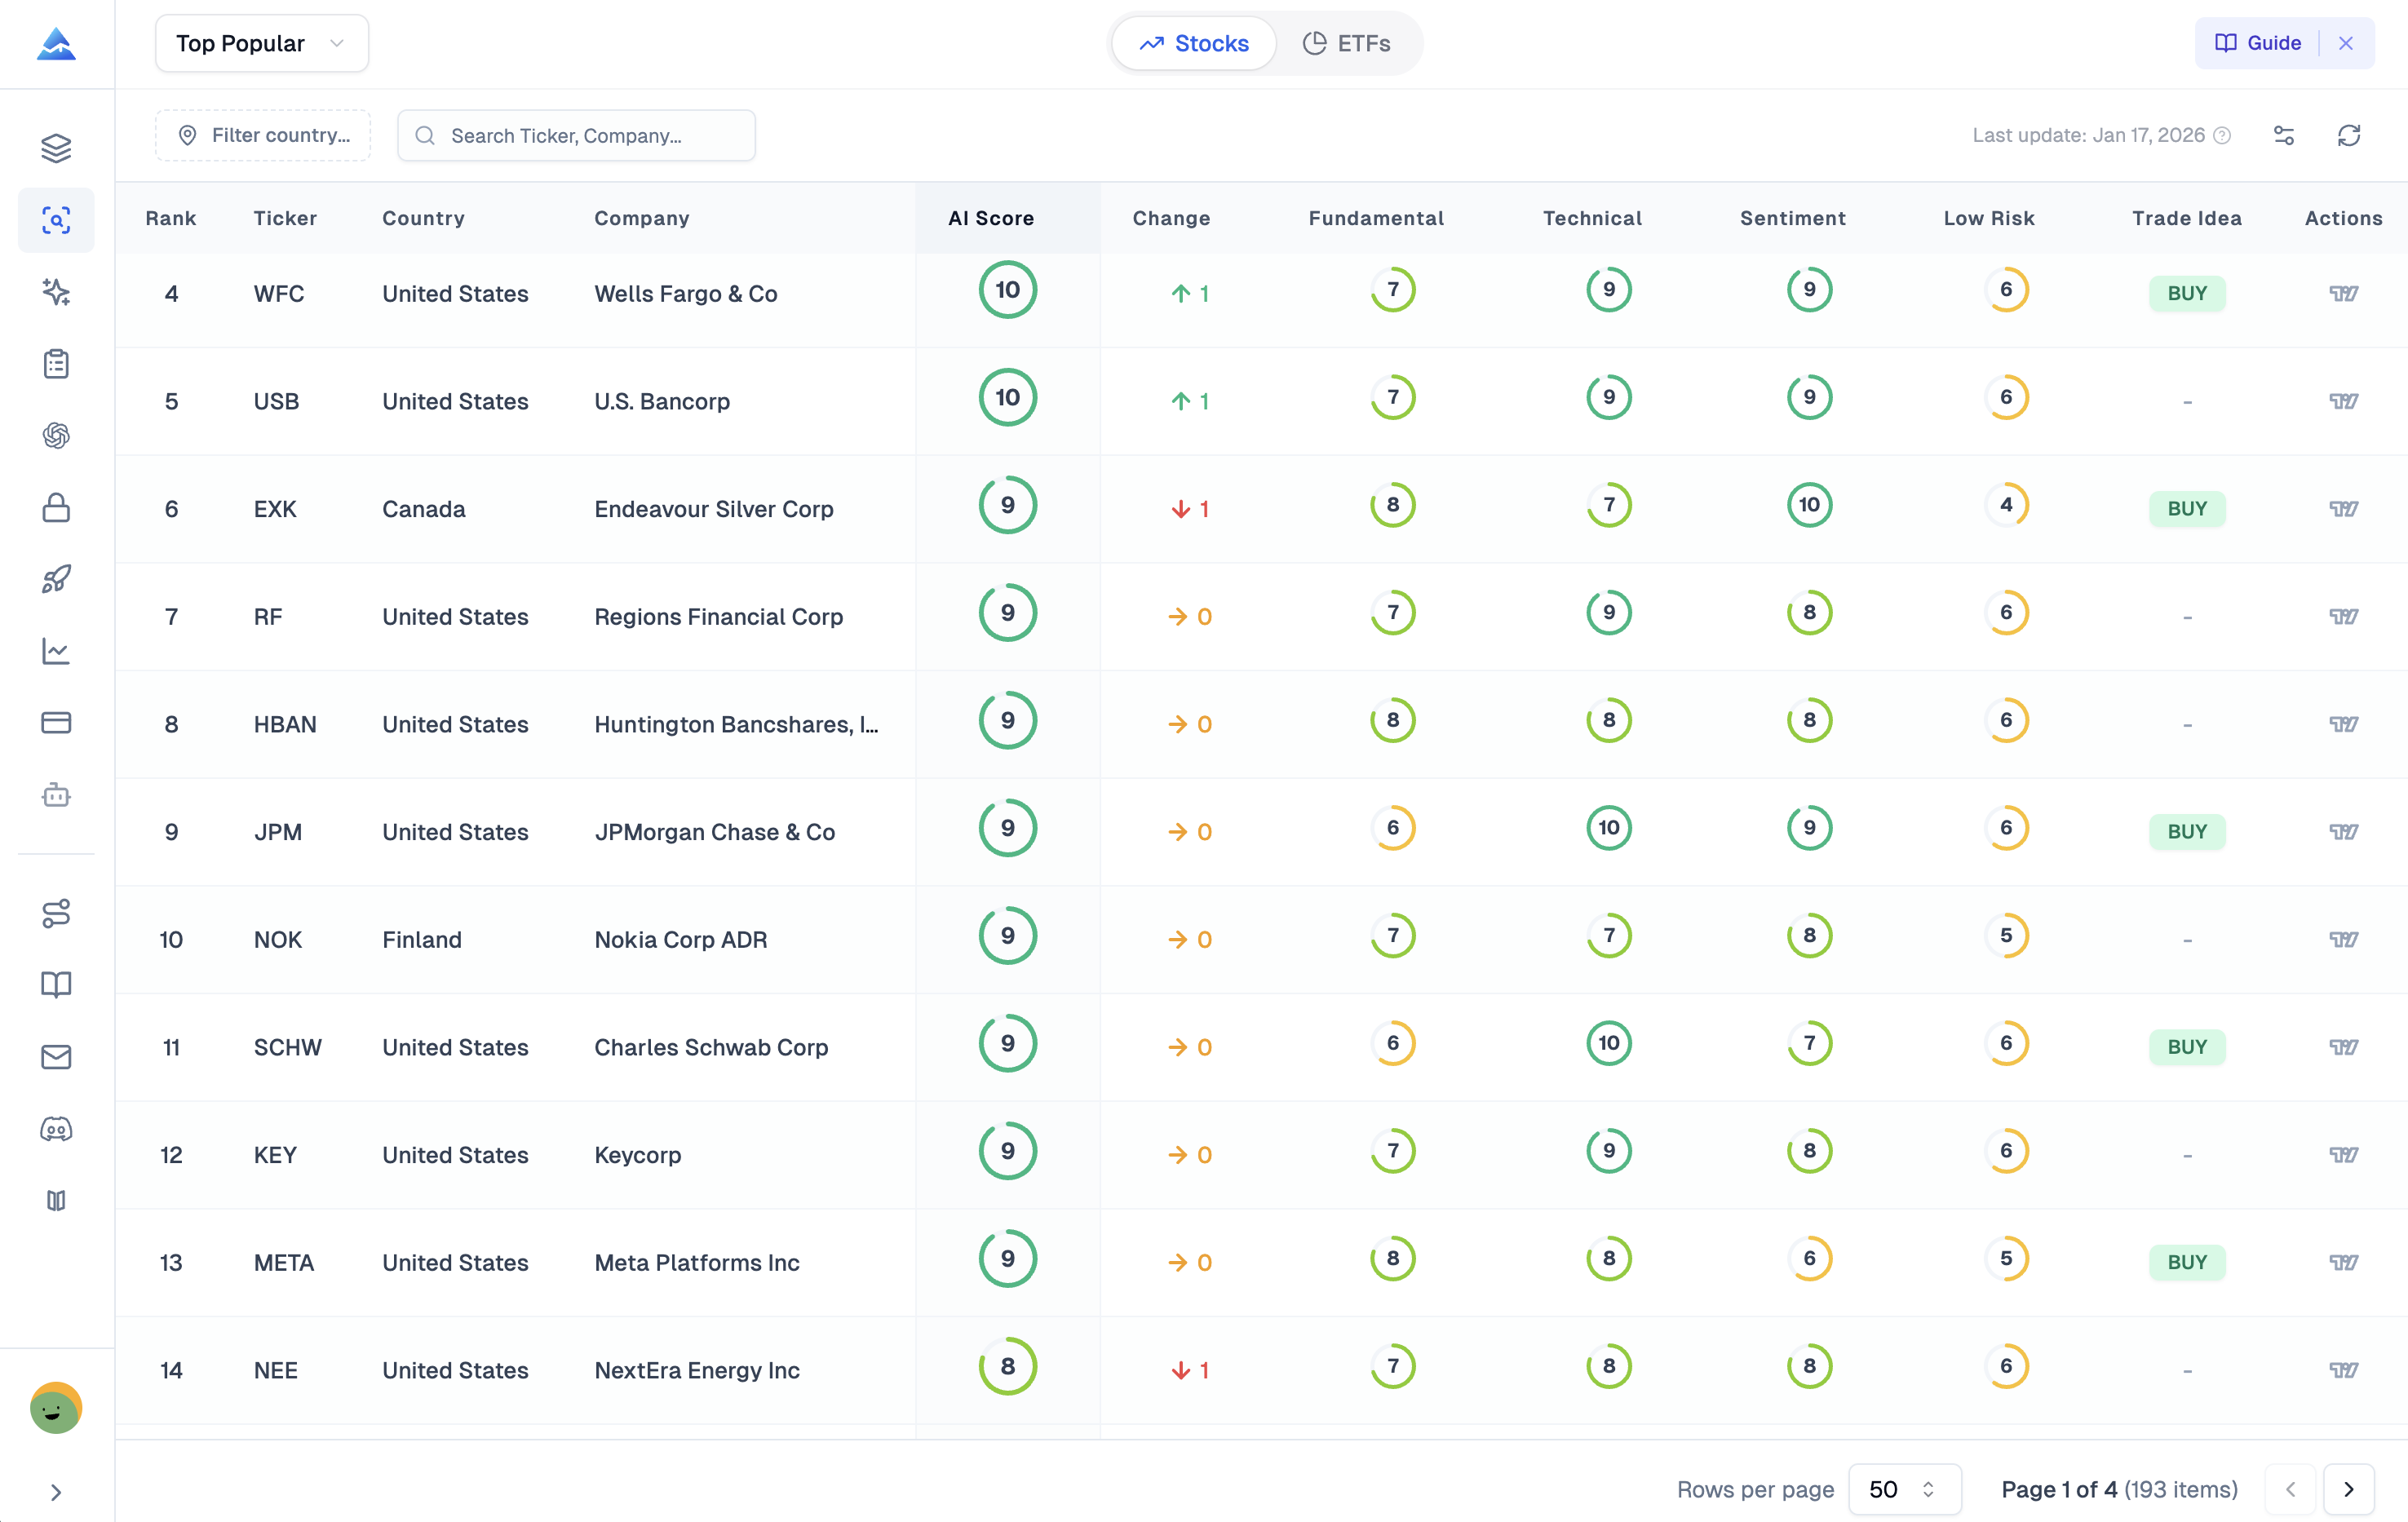
- Predictive 1-10 AI Stock Scores — daily rankings across fundamentals, technicals, and sentiment
- AI Stock Screener with Smart Filters — filter by geography, sector, and financial metrics
- Curated Lists — Top Popular, Top Dividend, and Top Growth for themed discovery
- Real-Time Options Chain with Full Greeks — Delta, Gamma, Theta, Vega, plus bid-ask and open interest
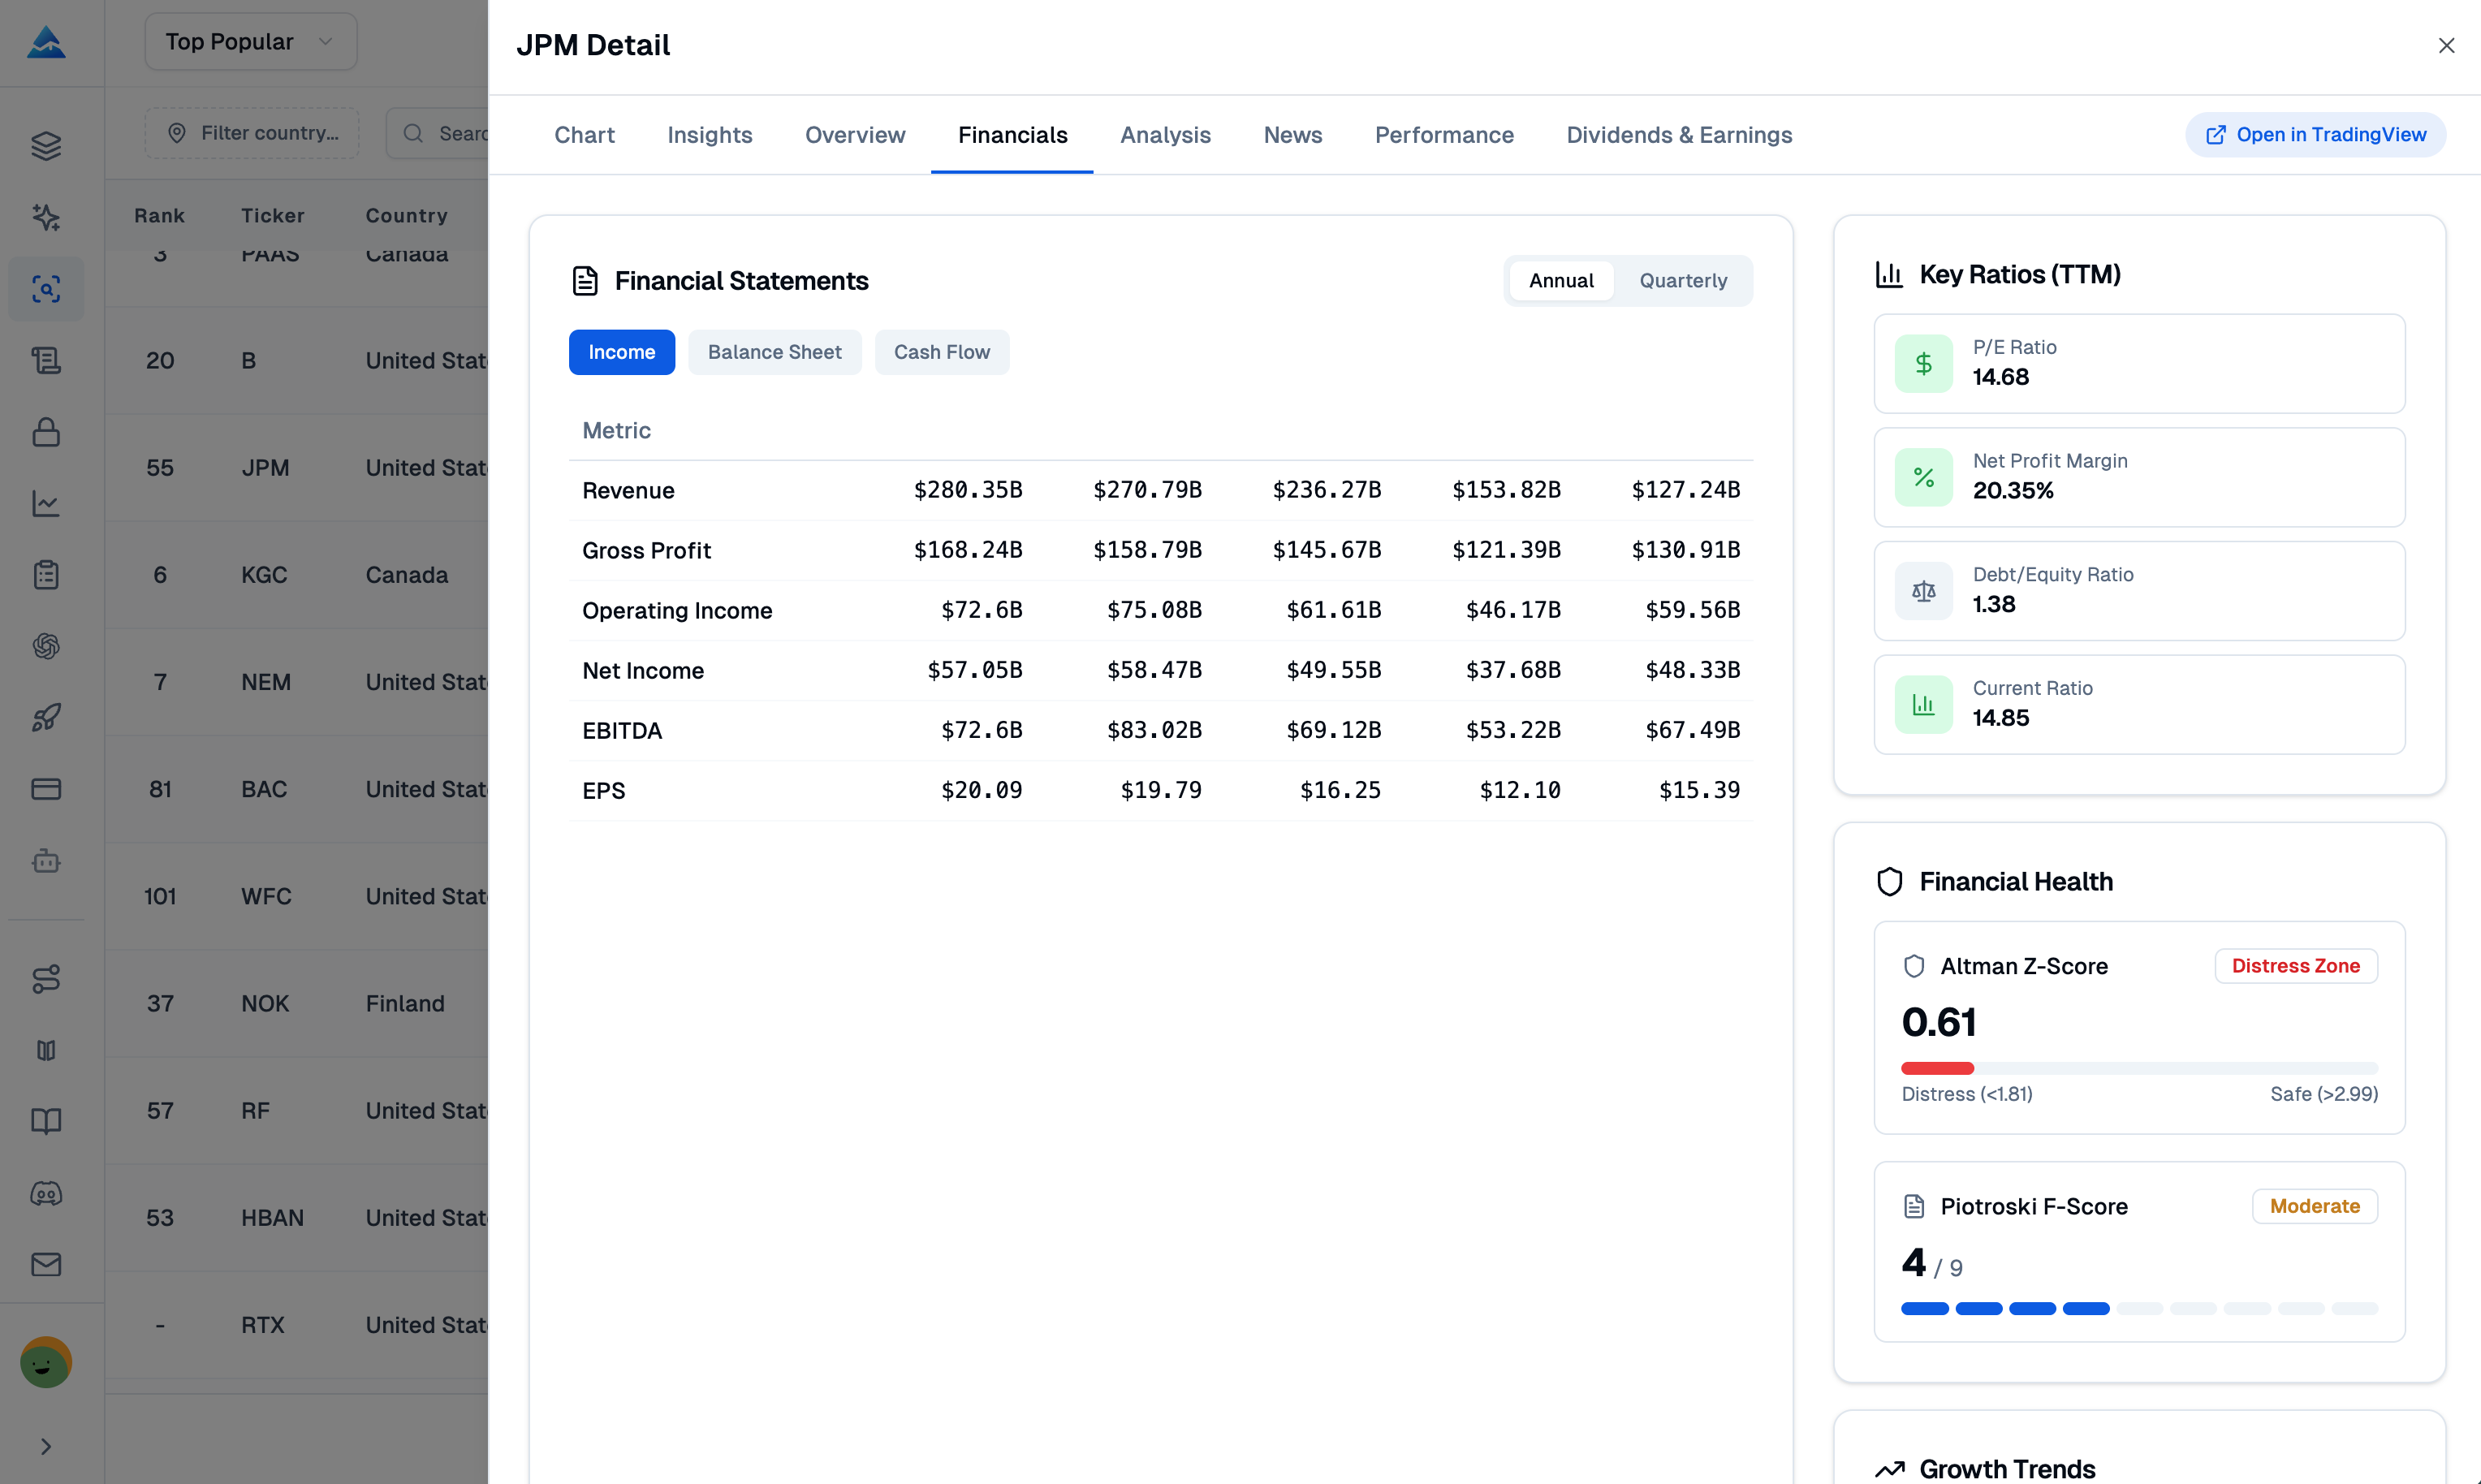
- Deep Financial Statements and Health Scores — income statements, balance sheets, cash flows, Altman Z, Piotroski
- Analyst Consensus and Price Targets — buy/hold/sell aggregates, low-average-high target ranges
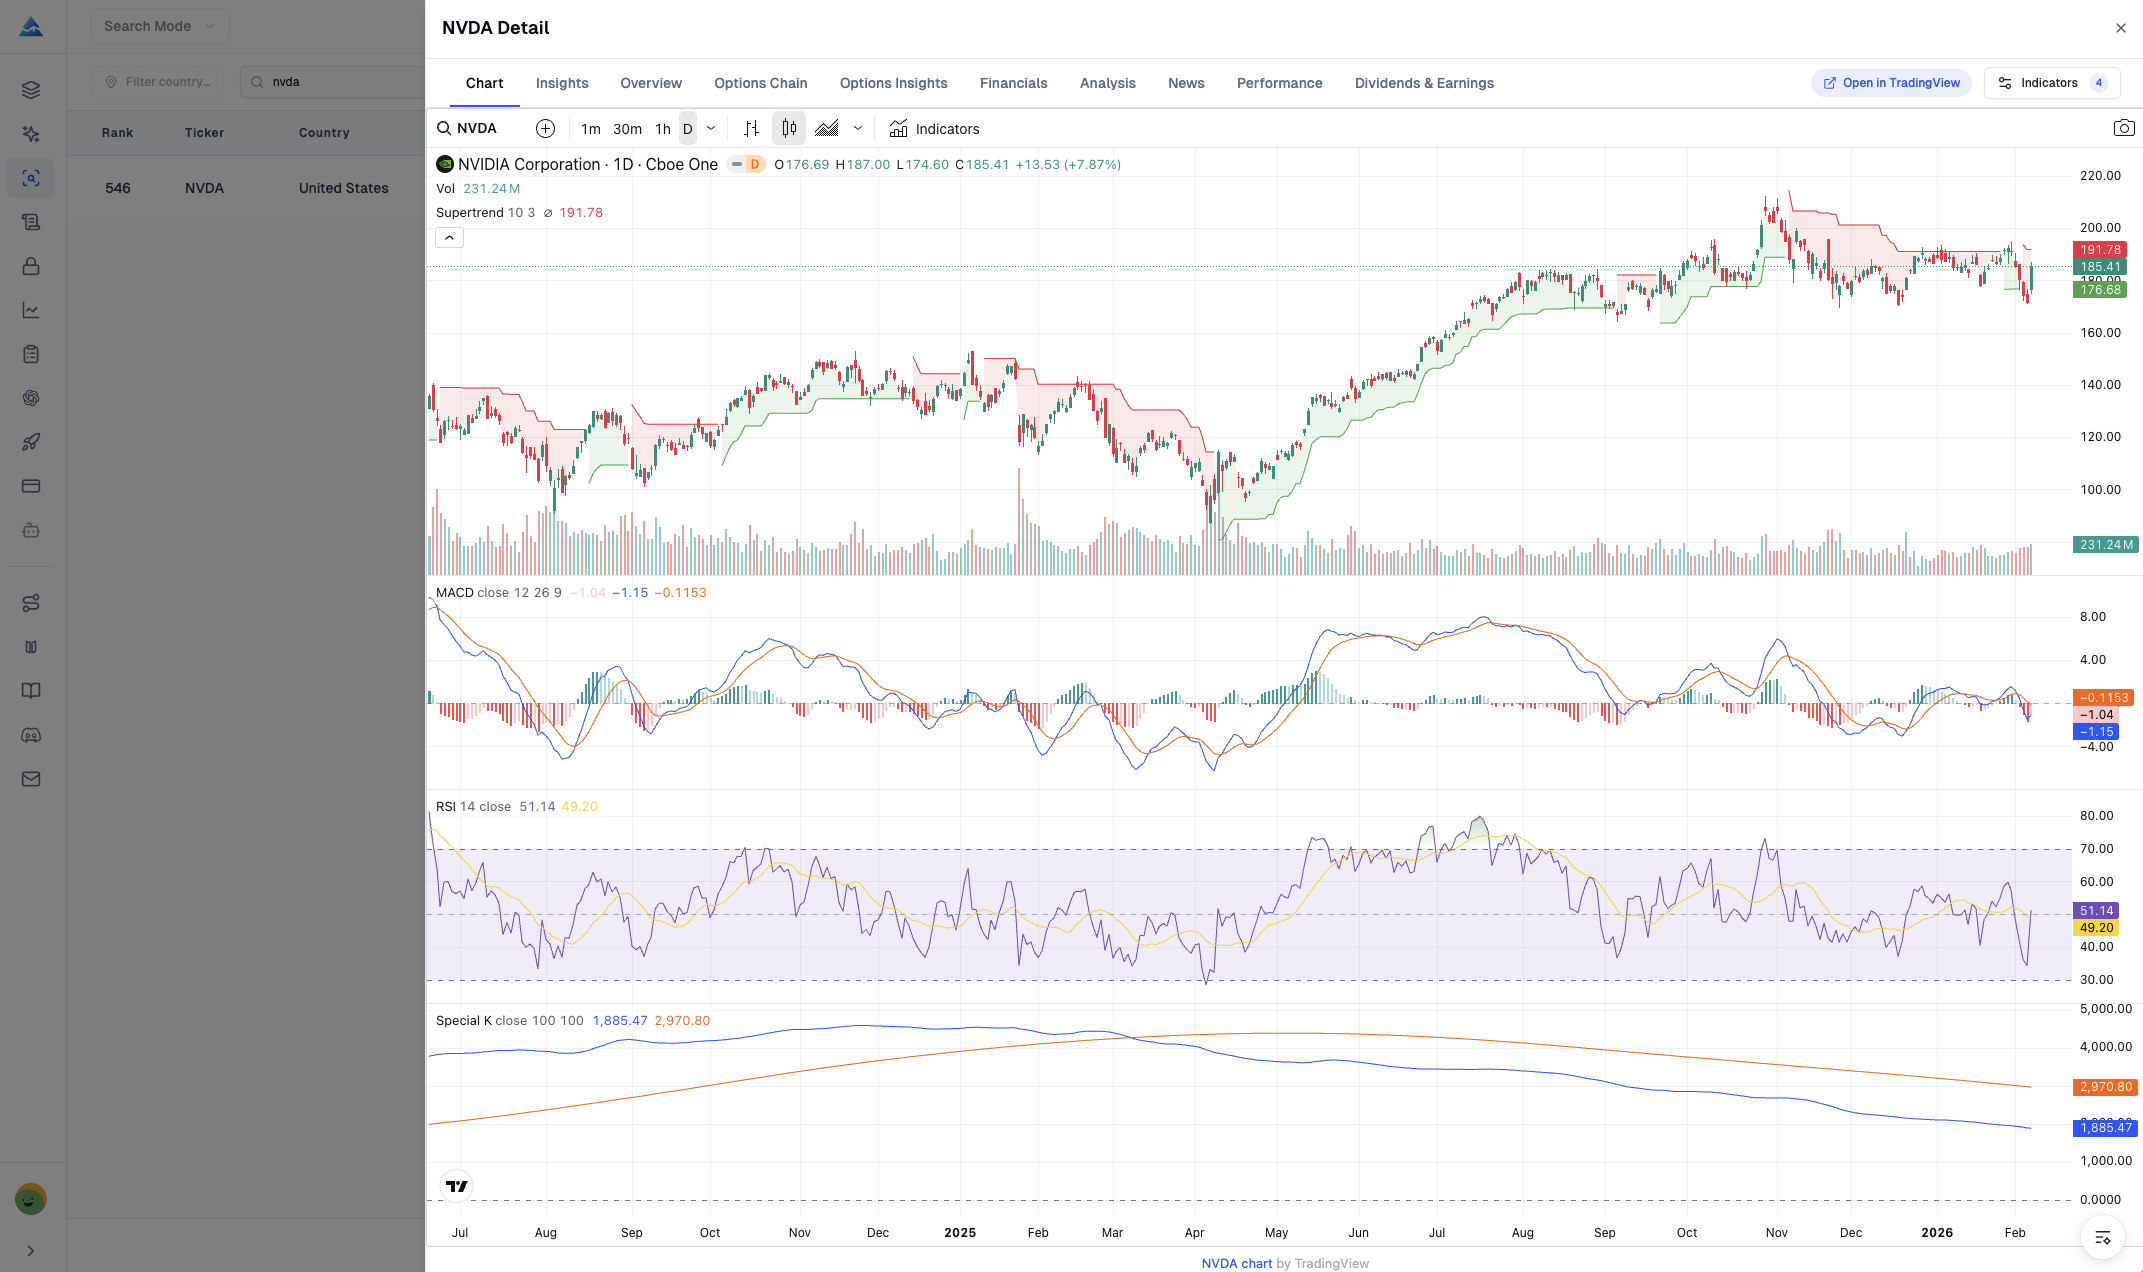
- Professional TradingView Charting — indicators, drawings, multi-timeframe analysis
- AI-Powered Options Intelligence and Max Pain — unusual activity, put-call ratios, expected move
- Performance Tracking and Benchmarking — returns versus S&P 500 from one week through five years
- Dividends and Earnings Calendar — payout history, surprise history, splits, upcoming dates
- Real-Time News and Sentiment — headlines, filings, sentiment scoring, source filters
I've been using the dividend list for a couple weeks now, and names like O and JNJ showed up there before I'd thought to add them to my watchlist. That's the kind of discovery I'd miss running my own scans.
How AI Picks Stocks
Pineify publishes a 1-10 predictive score per stock. Scores from 7 through 10 represent names that look strongest on the model's current read of fundamentals, technicals, and sentiment combined.
Here is how I sequence the workflow each morning:
- Start from the ranked table to see the model's ordering before imposing my own bias.
- Cross-check curated lists (Popular, Dividend, Growth) when I want a theme without building a screen from scratch.
- Apply smart filters — country, sector, or specific financial thresholds — when I already know the universe I care about.
- Drill into a single symbol only after it passes that funnel, because the deep modules deserve attention rather than every random ticker.
The score is not a guarantee — it is a compression layer. The FAQ is explicit that picks combine fundamental metrics (revenue, earnings, margins), technical indicators (price action, momentum, volume), analyst consensus, and sentiment. Knowing the ingredients helps me judge when a high score disagrees with my own thesis and when it flags something I missed entirely.
Last month I ran NVDA through this funnel and got a 9/10 score. The options page showed high put activity near the earnings date — a tension the scoring alone didn't capture. That's exactly where I find the tool useful: one view says "strong," the other says "cautious," and I get to decide.
Screening and Curated Lists
Daily rescreening turns abstract machine rankings into a repeatable habit. The screener processes thousands of names every day so the leaderboard is never a stale snapshot from last quarter. For my own routine, that matters most around earnings season, when static watchlists go stale fast.
The "clear buy signals" messaging is worth interpreting carefully. I read it as a consistency check across internal factors rather than a promise of profit. If you use it, pair it with position sizing and risk rules you already trust. I'll be honest — I haven't tested the screener on small-cap names below $1 billion, so I can't vouch for coverage there.

Real-Time Options Chain and Intelligence
A real-time options chain with Delta, Gamma, Theta, and Vega is the baseline dataset for tying an equity thesis to listed calls and puts without exporting tables to a spreadsheet. The product highlights live bid-ask, implied volatility and open interest, ITM versus OTM highlighting, and the full Greek set.
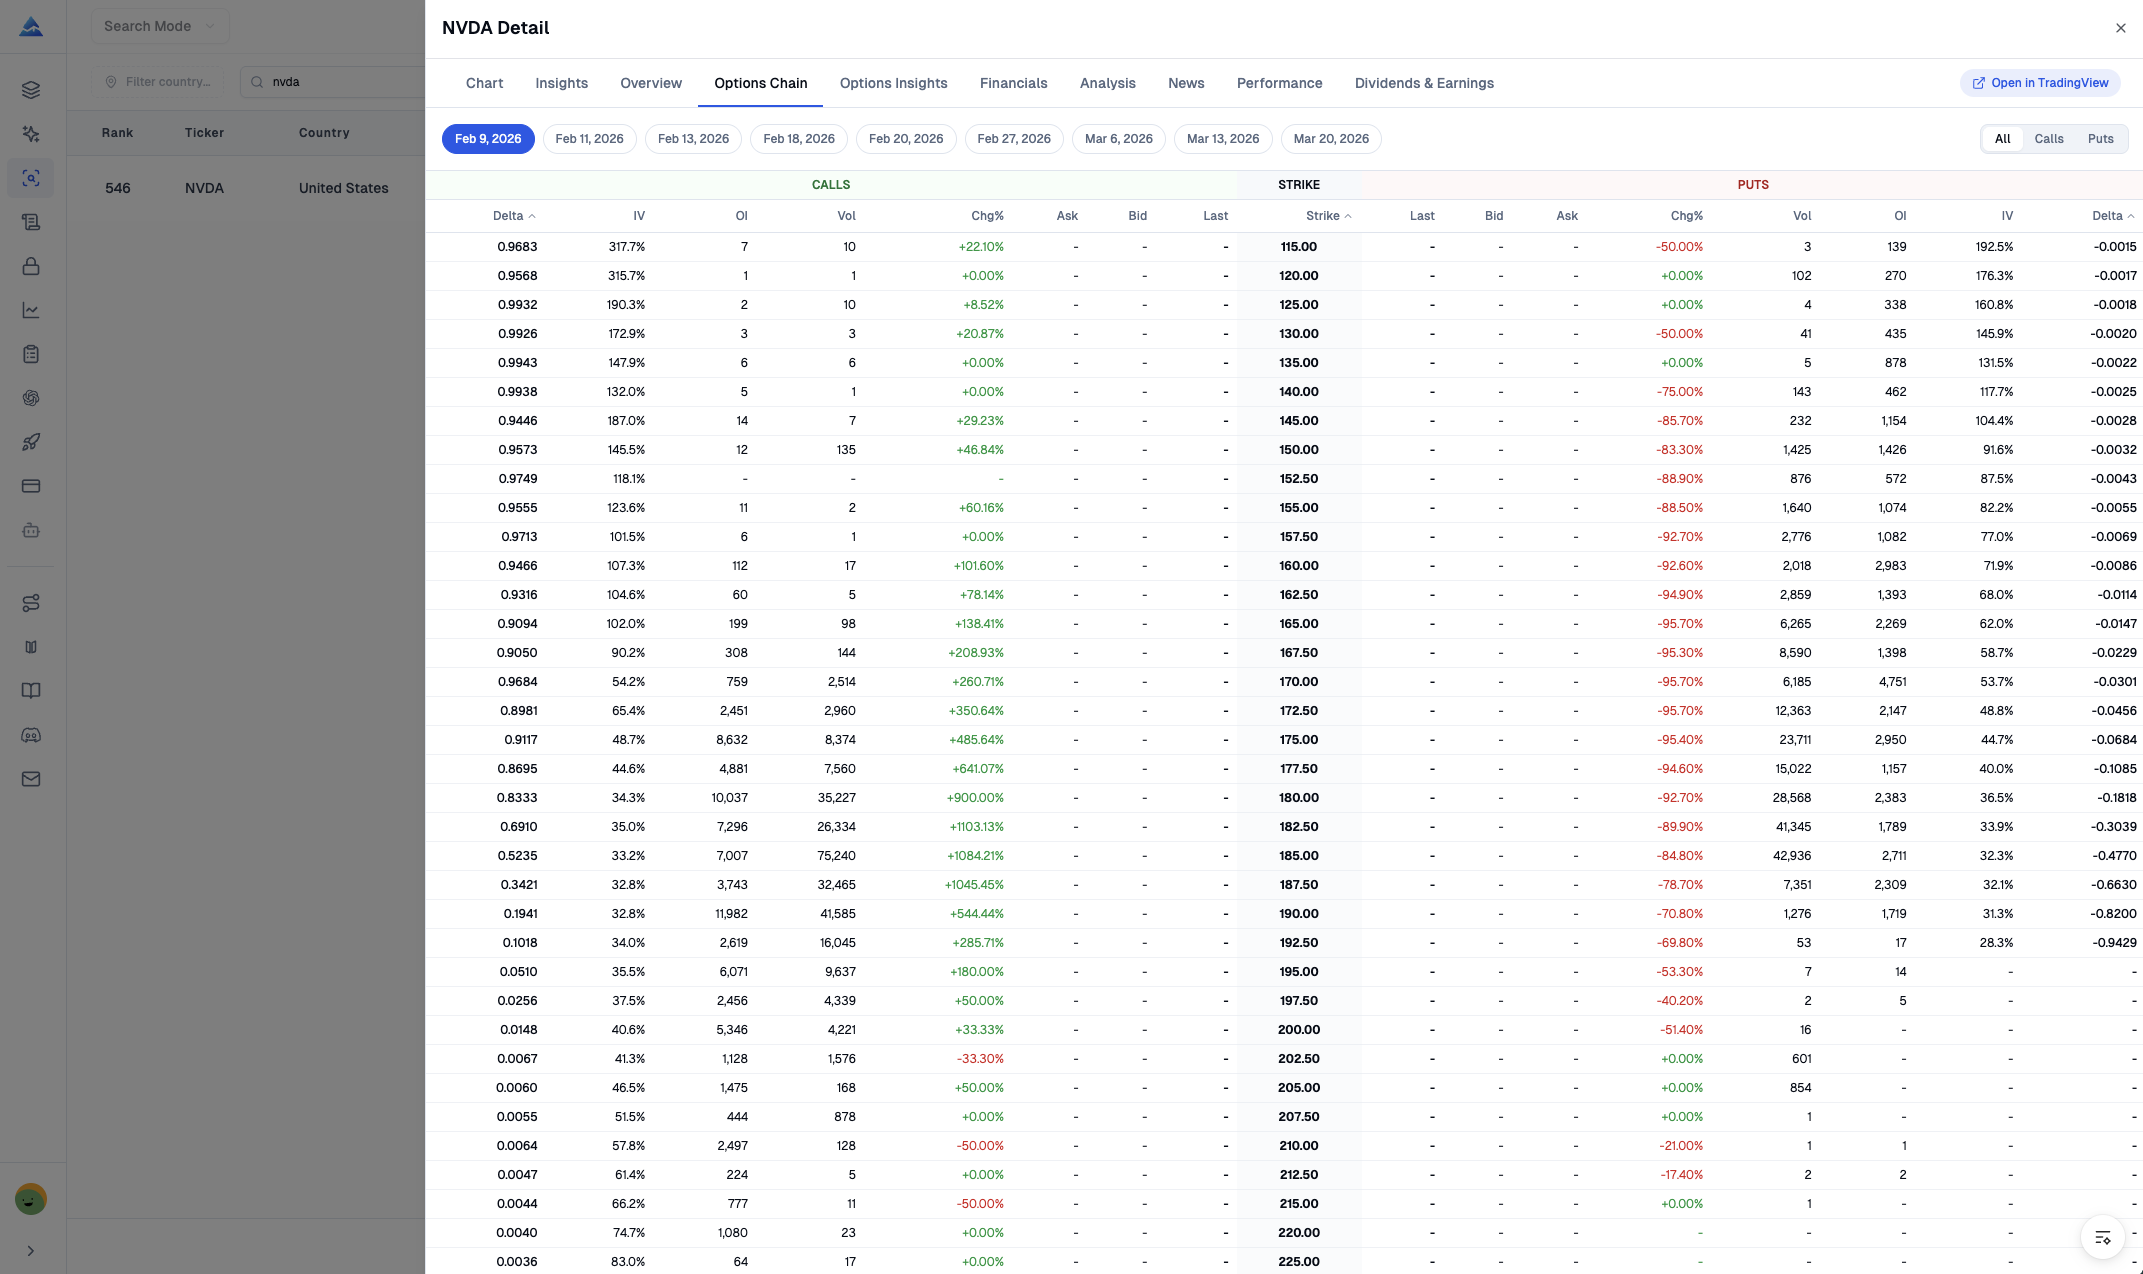
On top of the chain, Options Intelligence bundles max pain analysis, unusual activity scanning, put-call ratios on both volume and open interest, and expected move analytics. The Expected Move section visualizes implied-volatility-based price ranges by expiration — useful when I want a quick sense of what the listed surface implies before catalysts.
Deep Financials and Analyst Research
Income statements, balance sheets, cash flows, multi-year history, and health scores like Altman Z and Piotroski turn the same ticker from a chart into a balance-sheet story I can sanity-check. The site lists statement coverage with more than ten years of history where available, health scoring, and margin or growth trend views. When an AI score is hot but cash conversion is weak, this is the panel that exposes the tension.
Analyst consensus sits alongside the financials: buy/hold/sell aggregates, low-average-high target ranges, valuation metrics, and rating history. Performance tracking adds benchmark comparison versus the S&P 500 across horizons from one week through five years. Dividends and earnings cover payout history, surprise history, splits, and upcoming dates. Real-time news rounds out the stack with headlines, filings, sentiment, and source filters.
I prefer the S&P comparison tab when I'm evaluating a new name — it's a faster check than building a relative-strength chart from scratch. Though I wish the performance section included Sharpe ratios; right now it's just price returns, which tells only part of the risk story.
Professional Charting
TradingView-grade charting with indicators, drawings, and multiple time frames is the visual layer most traders trust when a score says "look here" and price action needs to confirm. Even when I lean on AI scores for discovery, I still want to see structure, liquidity pockets, and trend context before I care about an option strike.
Market Overview complements the chart with profile data, market cap, beta, volume context, sector and industry classification, and an upcoming events timeline — the orientation layer I want before committing attention to a chain or a filing.
Who Should Use This
- Beginners who want a simple ranked list: the 1-10 score and curated lists are the gentlest on-ramp — you see ordering before you learn every ratio.
- Systematic traders who want filters: smart filters let you enforce geography and sector rules before the model ranks what remains.
- Options participants who need Greeks and event math: the chain plus expected move and max pain tools are the natural home screen.
Disclaimer
Markets are risky and uncertain. Past patterns, model scores, analyst targets, or implied volatility levels do not guarantee future results. Options involve additional risks including rapid time decay and gap risk. I use Pineify as a research accelerator, not as a substitute for my own judgment, position limits, and professional advice when I need it.
Frequently Asked Questions
▶What is an AI stock picker and how does it work?
It's a tool that scans thousands of securities using models and ranks them by data instead of gut feel. Pineify's version scores each stock from 1 to 10 based on fundamentals, technicals, and sentiment — updated daily.
▶How much does the AI stock picker cost?
It's part of the premium plans, which include scores, curated lists, options analytics, and deeper financial views. Pricing changes over time, so check the live pricing page when you're ready to subscribe.
▶Can AI really pick stocks better than humans?
AI is good at consistent, large-scale pattern work. Humans are better at nuance the model might miss. Pineify's pitch is that software can weigh many factors at once without emotion — but no tool guarantees returns, and I think that's an important distinction to keep in mind.
▶How is this different from other AI stock screeners?
Most screeners let you filter on a few metrics. This one bundles predictive scoring with options Greeks, financial statements, analyst consensus, and sentiment in one place.
▶How do I use AI to pick stocks with Pineify?
Open the AI Stock Picker, scan the ranked scores, browse curated lists, apply filters, then click a symbol for the full picture — charts, options, financials, and ratings.
▶What are the AI stock picks based on?
Fundamentals, technical indicators, analyst consensus, and sentiment — all combined into the daily 1-10 score.
▶Does it work for options trading too?
Yes. You get unusual activity scans, put-call ratios, expected move views, and max pain alongside the options chain.
▶What is the best AI stock picking tool for beginners?
I'd say the main draw for beginners is the simplicity — a score out of 10 and curated lists mean you don't need to know every financial ratio to get started. Just don't trade real capital without understanding the risks first.